Stats201 midsem (chapter 1-9)
1/46
There's no tags or description
Looks like no tags are added yet.
Name | Mastery | Learn | Test | Matching | Spaced | Call with Kai |
|---|
No analytics yet
Send a link to your students to track their progress
47 Terms
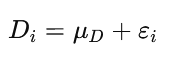
The null model
EXPLAIN
β0 is the intercept (=equiv to population mean μ)
ϵ is assumed to be independently and identically distributed (iid)
One sample t-test + Null model
to test if observed sample mean (ˉy) differs from the hypothesised population mean (null model μ),
the t-statistic is used, then compared to a critical value to determine significance. This helps assess if there is enough evidence to reject the null hypothesis.
Name the formula
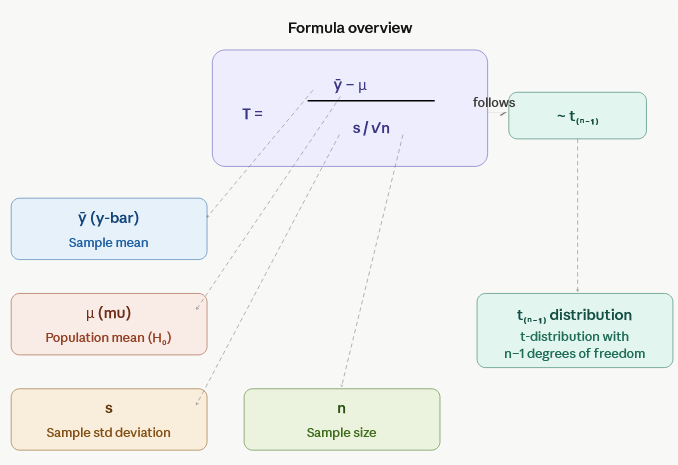
ONE SAMPLE T-statistic:
Yˉ is the sample mean
μ0 is the hypothesised population mean
s is the sample standard deviation
n = sample size
what does Yˉ mean?
The sample mean
what does μ0 mean?
the NULL or HYPOTHESISED population (not sample) mean being tested
what does s mean?
The sample standard deviation ; used to estimate the population standard deviation (σ)

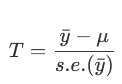
what does this mean?
the standard error of the sample mean;
> standard deviation divided by the square root of n (sample size)
What does the t-stat measure (conceptually)?
measures how many standard errors the sample mean is away from the hypothesised population mean;
how far Yˉ is away from μ0, measured in standard errors
A LARGE T VALUE MEANS….?
means the sample mean (Yˉ) is FAR from the null/hypothesised population mean (μ)
provides stronger evidence against H0
Why does the T statistic use S and not σ?
because σ (population standard deviation) is unknown, so it must be estimated USING S (sample standard deviation)
why does the T-distribution appear instead of the normal distribution?
because we estimate σ using S, which adds further uncertainty.
what is df in a one-sample t-test?
n-1
(sample size -1)
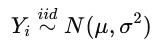
what does this notation mean?
Random error for observations ( εi) are independently and identically distributed from a normal distribution, according to/with μ and σ2.
σ2 =?
Population variance around mean
in h0, σ2 = variance of error terms around μ.
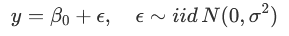
The null model =
Yi= B0 + εi, where εi ~N(0,2 )
e.g., observed value of Y = intercept/ Y population mean + random error for Yi
class example: ‘predicting exam marks(y) from test scores (x); the expected exam mark = B0
In the context of linear modelling, what does the 'null model' represent?
A model that estimates the value of the response variable (Y), without any Explanatory Variables (X);
where the expected value of Y equals the population mean plus the error term, which is iid~N(0,o2)
In a null model y=β0+ϵ, what population parameter does β0 represent?
The population mean of the response variable (Y).
Which standard statistical test is equivalent to fitting a null linear model using the lm function?
The one-sample t-test.
(R): How is the null model typically fitted in R using the lm function for a response variable y?
lm(y~1)
in a linear model output, what is the ‘Residual stand error’ an estimate of?
the standard deviation of residuals (random error), denoted as σ.
To test the null hypothesis H0:μ=60 using the lm function, what response variable transformation is required?
The response variable must be set to the observed values compared against 60,
which is done by y - 60.
in R = lm (I (y-60) ~1
under which conditions is a paired t-test usually used?
When the same population is measured twice, e.g., before and after studies
Definition: Paired t-test
A one-sample t0-test performed on pairwise differences between two related measurements
In a paired comparison study, how is the 'Difference' variable calculated for each subject?
‘difference’ is calculated by subtracting the second measurement from the first; GIVES CHANGE IN VALUES/OBSERVATIONS FOR EACH PARTICIPANT.
Why are test and exam marks from the same student considered non-independent data?
because both measurements are taken from the same individuals; creates a paired relationship. Data cannot be independent to one another.
What defines a model as a 'linear model' in the context of this course?
a model that is linear, in respect to it’s B coefficients.
the relationship between the independent variables and the dependent variable can be expressed as a linear equation, typically in the form of a straight line.
How is a quadratic curve considered a ‘linear’ model?
It is linear in the coefficients β0, β1, and β2, even though it is quadratic in x.
What is the expected value equation for a quadratic curve model.
What IS a paired t test?
paired t-test is just a one-sample t-test applied to the pairwise differences between first and second measurements.
why is a paired analysis needed for non-independent data?
e.g., test and exam scores: when comparing test and exam scores for the same student, these two measurements are not independently; a student who tends to do well in their test is likely to do well in the other. The data is paired, as each student has contributed two related measurements.
The difference is then calculated by subtracting the second measurement from the first.
a statistically valid test can still be meaningless, it is important to ask:
Is the null hypothesis mathematically correct?
Is it also scientifically or practically interesting?
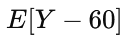
what does this mean?
The expected value of Y - 60
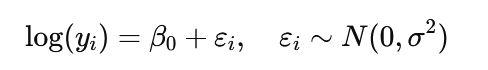
Why might you apply a log transformation to y in a null model if the data is right-skewed?
to make median the focus (not mean)
use log transformation on Y > back-transform to discuss median
what is a linear model?
where εi∼N(0,σ2)
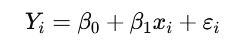
yi
The observed response for the iiith individual or observation.
xi
The explanatory variable for the iiith observation.
β0
the intercept / expected value of the response when all explanatory variables (x) equal 0.
you interpretation of the intercept depends on if on whether x=0 is meaningful.
β1,β2,β3
Regression coefficients; describe how expected response changes with explanatory variables
εi
random error term; where εi ~ iid N(0,o2)
σ2
variance of random error around the expected value
CLT/ central limit theorem
The sample’s distribution of the mean will approximately create a normal distribution as the sample size increases, regardless of the population's distribution.
as n increase, the more ‘normal’ sample distribution will be
when data is strongly right skewed; clt will not apply: what do you do?
log transform Y, back transform to discuss median
The log-transformed null-model
the median = eβ0.
to log transform Y….
ONE SAMPLE T TEST FORMULA
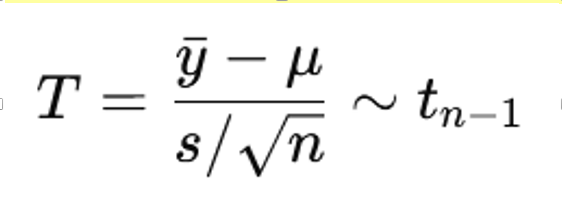
one sample t -test breakdown:
T tells you: how many standard errors is the sample mean away from μ?
Large |T| → evidence against H₀. Compare to t-table with df = n−1.