7: Visual Fields
1/145
There's no tags or description
Looks like no tags are added yet.
Name | Mastery | Learn | Test | Matching | Spaced | Call with Kai |
|---|
No analytics yet
Send a link to your students to track their progress
146 Terms
what is the visual field
all the space that one eye can see at any gven instant
what does assessment of VF/perimetry enable
allows the detection and analysis of damage along the visual pathway and the monitoring of disease progression
what is perimetry
the study/ investigation of the visual field
done using a machine called the perimeter
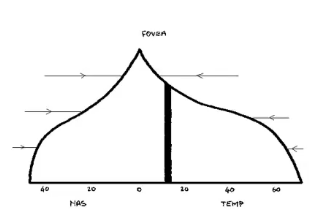
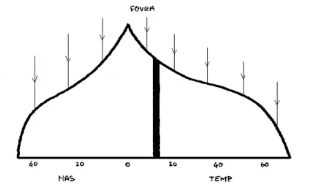
extent of the visual field
inferior VF i bigger than the superior VF
temporal VF larger than nasal VF
with both eyes open, binocular VF is when RE and LE overlap: 120 degrees
LE/RE 40 degrees each
photopic
light conditions
most sensitive at the fovea - when looking directly at something
scotopic
low light conditions
centre of vision/ fovea lacks usefullness and sensitivity
peripheral works better , much more sensitive
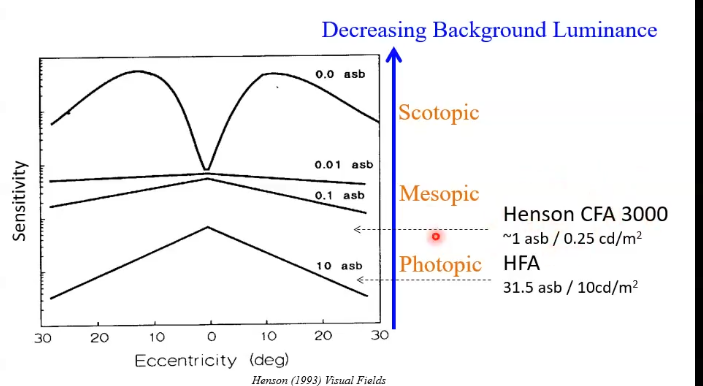
sensitivity profiles
VF done with room lights off
not testing VF in scotopic environment as machine inside is lit
so expect the centre of the field to be very sensitive and pick up more stimulus than the periphery
why do we do perimetry
to assess health of visual pathway
picks up lots of dieases like tumours, glaucoma, diabetic retinopathy, cataract
mainly used for testing for glaucoma
types of perimetry
kinetic perimetry ( moving)
gross (arc) perimetry
goldmann manual
octopus semi automated
static perimetry ( non moving)
amsler grid
supathreshold
threshold
kinetic perimetry
approaches centre of vision laterally, moving target
constant luminance, variable position
static perimetry
constant postition
variable luminance
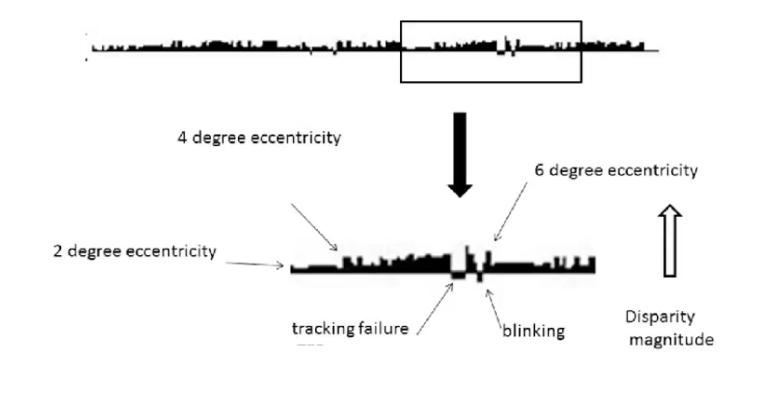
what is done for each stimulus on kinetic perimetry
vary eccentricty from fixation
px reports when a stimulus fisrt becomes visible and if it dissapears again
test meridians every 10 or 20 degrees
change stimulus intensity usually by changing stimulus size
who should central VF screening not be performed on
px with minimal risk factors eg those over 40 without other risk factors of POAG
this is due to porblems of false positives results when testing healthy px
who should central VF screening be performed on
if a px has a known defect, risk factor for a VF defect, or when following protocols for the management of glaucoma
IOP greater than 24mmHg, 60+ age
symptoms consistent with a neurological disease eg headahces, dizzyness
gross perimetry
type of kinetic
a target is moved from an area of non seen to seen
px reports when the target first becomes visible, and if the taregt dissapears again
bead on a stick
arc perimetry./ confrontation perimetry
arc ( gross perimetry)
practitione holds bead on a stick
px is covering eye with hand
practitioner asks px to fixate on their eyes/nose
mpving the bead form behind the px head, bringing it around into an arc to a point in which they first see the bead
keep moving until it dissapears
done at around 33cm away
done in 8 meridians
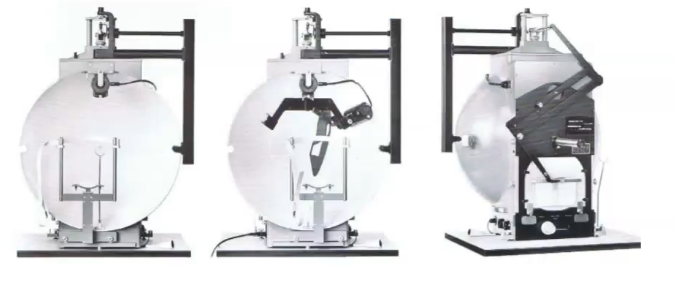
kinetic perimetry- goldmann manual
VF test that maps the px peripheral vision using a moving light stimulus
small light of specific size and brightness is moved inward from non seeing to seeing areas
the point where the px detects it is marked
connecting these points forms an isopter
kinetic semi- automated perimetry
CF test where a moving stimulus os presented bu a computor controlled perimeter, but practitioner can stilla adjust settings
px fixates centrally inside the bowl
light target moves inwards from peirphery and px presses button when first seen
computor records detection point and points are connected to form isopters
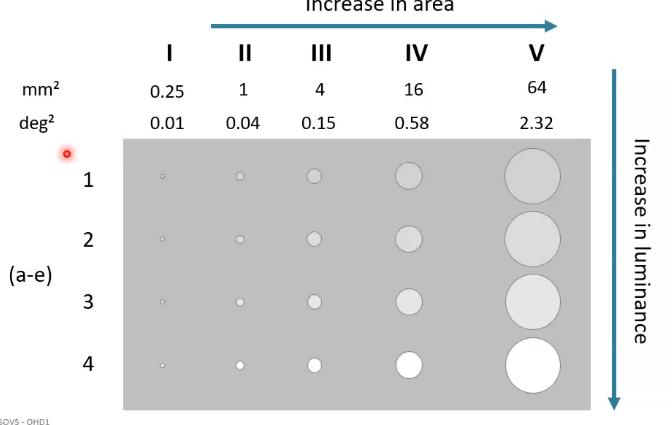
goldmann stimuli
static usually involves at III - 4mm² target / 0.15²
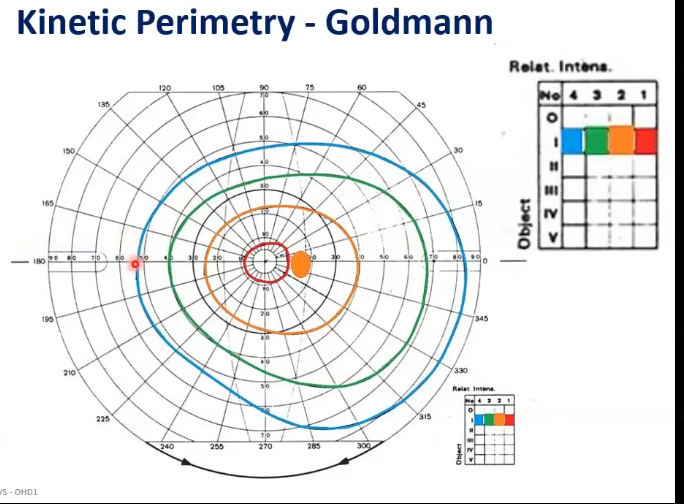
what is isopters
kinetic plots results in isopters
this is a line joining points of equal retinal sensitivity to a given test stimulus
blue ring is how far out px can see the light
can tell the right hand side is temporal as extends further out
colours correspond to brightness- red is the dimmest blue is the brightest
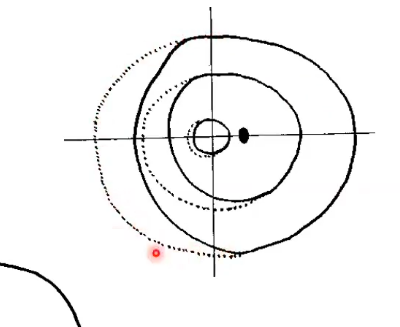
constricted visual field
dotted line is where we expect he px to see up to
advantages of kinetic perimetry
more px friendly
goes further into the periphery
often used for neurological conditions
disadvantages of kinetic perimetry
often requires an experineced examiner- need t make sure target is in stright line at constat speed
can be more time consuming
types of static perimetry
amsler grid
supratheshold
threshold
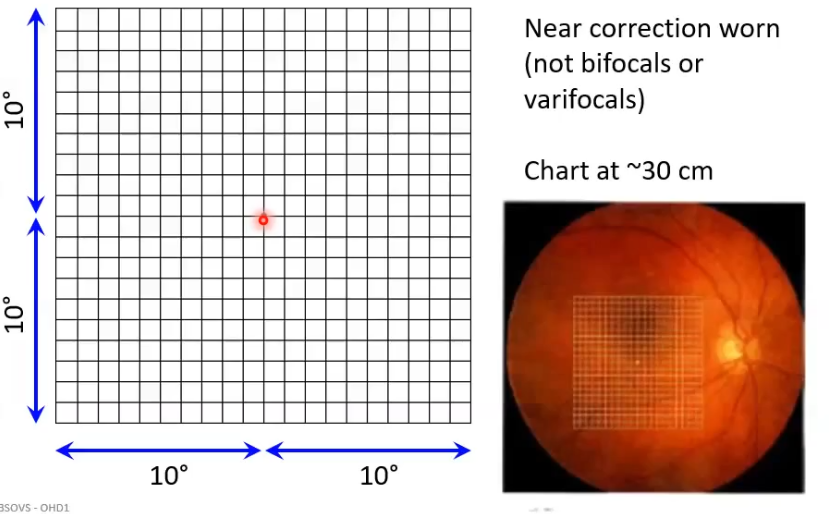
amsler grid
only looks within central 10 degrees - fovea
a grid on a piece of paper is shown to px and ask them to stare at the centre dot. then asked if all grid lines are visible/ if any are missing/ do lines look straght or wavy
types of amsler charts
chart 1: standard. 5mm square, white gris with each square subtending approx degree from 30cm on black bckground with central white fixation target
2: same as 1, but with 2 diagonal white lines to assist steady fixation
3: similar to 1, but with a red grid. useful for toxic amblyopias and optic neuritis
4: scattered white dots with central white fixation target- dtection of scotomas
5: white parallel lines only and a central white fixation target. chart can be oreinted by rotation. used to investigate metamorphospia
6: similar to 5, but black lines on white card with additional lines above and below fixation
7: similar to 2, but with additonal squares in central 8 degrees. detect subtle macular disease
what does asking the px if lines appear wavy do for practitioner
helps them detect any metamorphospia which is usually caused by macula oedema
recording of amsler
record defects or distubrnaces
note down eye tested, date of examination, and px name
if no defects found then recorded as Amser charts: central fields full R and L
static perimeters
what happens for a given stimulus area of static perimetry
stimulus doesnt move- just flashes on and off
test fixed locations, typically 6 degrees apart
px reports when they see a stimulus
2 main types of programme- suprathreshold and threshold
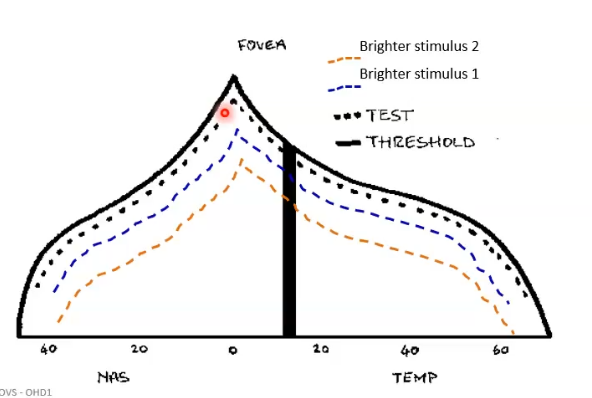
establishing a threshold
intensity of a stimulus that is just visible
stimuli brighter are seen and timuli dimmer than threshold not seen
centre of field most sensitive
sensitivity is the reciprocal of threshold: a high sensitivity means px can see very dim light , so threshold is low
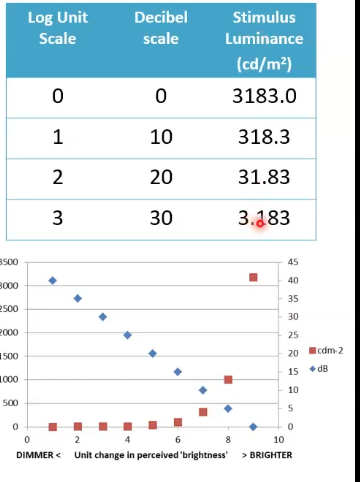
what scale do perimeters use for recording
use a logarithmic scale
higher numbers = increasng sensitivity and dimmer light seen
lower end of scale is exaggerated
matches response of the visual system
1dB step change percieved the same along the whole range
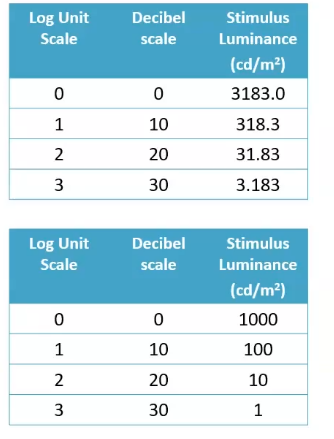
what is the dB scale based on
the dB scale is a relative scale- it is based on the maximum luminance the instrument can generate
sensitivity of 0/ log scale/dB of 0 is max luminance the machine can produce
what is the goldmann size for static perimetry
goldman size 3
4mm²
0.15 deg²
what does static perimetry include:
usually named : standard automated perimetry (SAP)
is a white GIII stimulus
white background
stimulus displayed for 200ms
test location typically 6 degrees apart
px indicates hey have seen a stimulus by pressing a button
the central visual field
few defects with no central component
retinal detachment
retinitis pigmentosa
tumours
mainly central 30 degrees tested
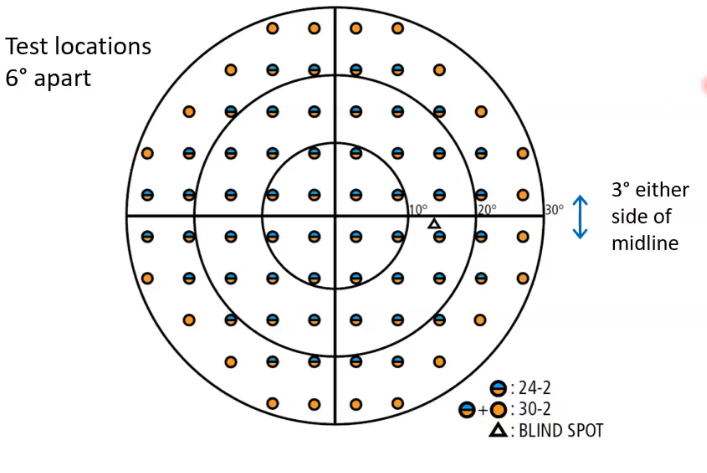
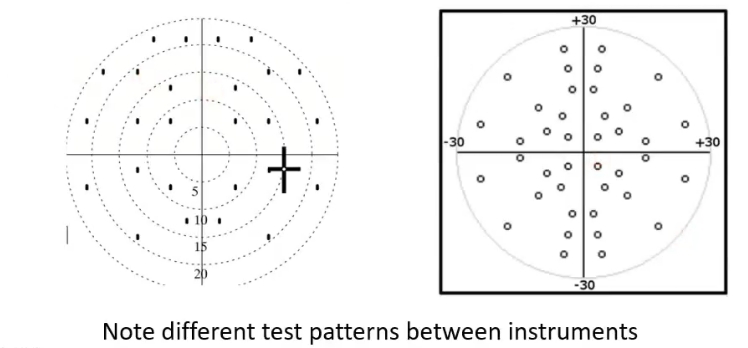
test locations- grid pattern
6 degrees apart
24-2 test pattern : shape is slightly larger around temporal side. nasal goes to 30 degrees peripherally
30-2: more symmetrical
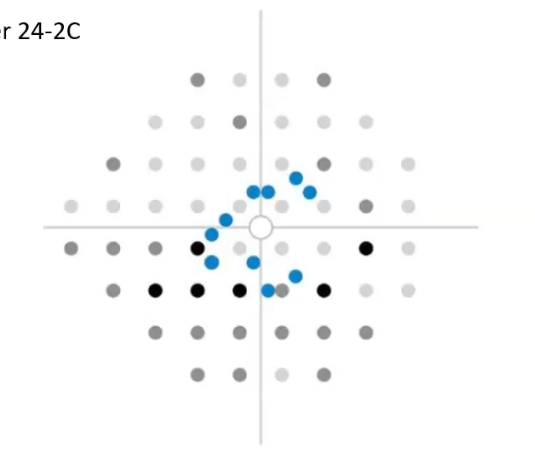
test location grid patterns: SITA Faster 24-2C
extra spots for location within the centre
full threshold
a stim is presented. px does not press the button as they havent seen it
next stim presented is brighter . the px presses the button to indicate that they have seen it
the next stim presented is less bright than the last stimulus but is brighter than the first one
or px presses button as sees light, so go dimmer, px cant see so go slightly brighter than last sitm to work out threshold
visual field plot
advantages of threshold tests
individual threshold for each location is tested
identifies small and early defects
effective for tracking changes over time
disadvantages of threshold tests
time consuming
more difficult for px as can get false positives
max 30 degrees from fixation
suprathreshold screening
stimuli is slightly brighter than expected threshold
so px is expected to see all the stimuli presented
if a px misses a stimulus it may be opresented again in case px blinked or wasnt paying attention
if px still fails to respond to the stimulus, a brighter stimulus may be presented at the same location
suprathreshold screening: how test stimulus is chosen
how bright the test stimulus is, depends mainly on age
elderly have more variable thresholds
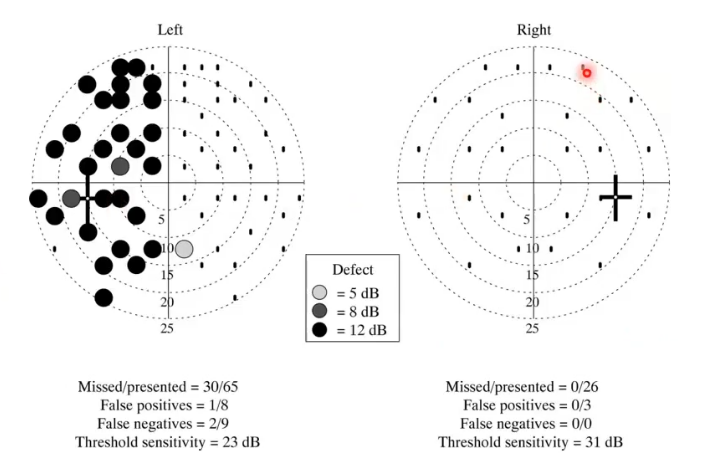
more spots presented on left eye
eg grey spot shows 5dB greater than stimulus
black shows 12dB brighter.
advantages of suprathreshold tests
quicker if there is no defect present
easier for px
can go further into the periphery
disadvantages of suprathreshold
may miss small defects due to locations chosen my manufacturers
not good for monitoring change
stimulus luminance and/or test pattern may be sub optimal
what is the multiple stimulus test
type of suprathreshold
multiple stimuli presented at the same time
px verbally reports how many stimuli they saw and where using a clockface
operator manually records if stimuli are missed
advantages of multiple stimulus test
more px friendly
can check px understandng through questions
quicker if VF are normal
disadvantages of multiple stimulus
requires manual operation and input
can be more time consuming if defects are present
max 30 dgrees from fixation
testing closer to fixation eg 10-2
red spots in centre, 2 degrees apart in many different centre, and tests 10 degrees from fixation in all directions
done if suspect something is wrong with the macula
mainly on a nhumphry analyser
whats the 24-2 test
tests 24 degrees from fixation in most directions
test points are arranged 6 degrees apart, but offset so none lie directly on the horizontal or vertical meridians - main use is standard glaucoma test
advanced glacomatous defect
can use 10-2 to concentrate on the vision px still has left so any small changes can be picked up quicker
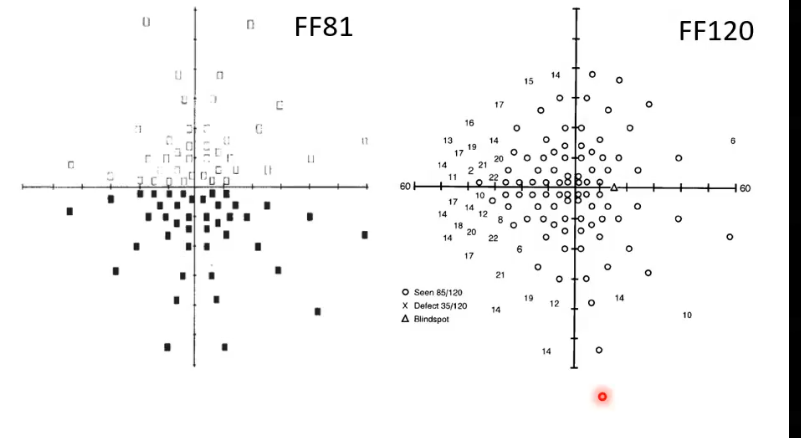
testing further into the periphery
eg 60 degrees from fixation
FF: full field
begins with suprathreshold then moves out as can be time consuming
esterman
binocular test
suprathreshold
120 locations/ 75 degrees either side of fixation
35 degrees superiorly
55 degrees inferiorly
used for driving standards
what is the minimum field of view for group 1 driving for esterman
a field of view of at least 120 on the horizontal measured using a targett equivalent to the white goldmann settings
the extension should be at least 50 degrees left and right. In addition there should be no significan defect in the binocular field that encroaches within 20 degrees of fixation above or below Hx meridian
SWAP: short wavelength automated perimetry
uses a blue, goldmann size V stimulus displayed on a yellow background
preferentially stimulates the short wavelength ( koniocellular) pathway
evaluation of SWAP
higher test- retest variability with swap compared with SAP
longer test time
short wavelength light absorbed by macular pigment and ocular media
no longer recommended in glaucoma management
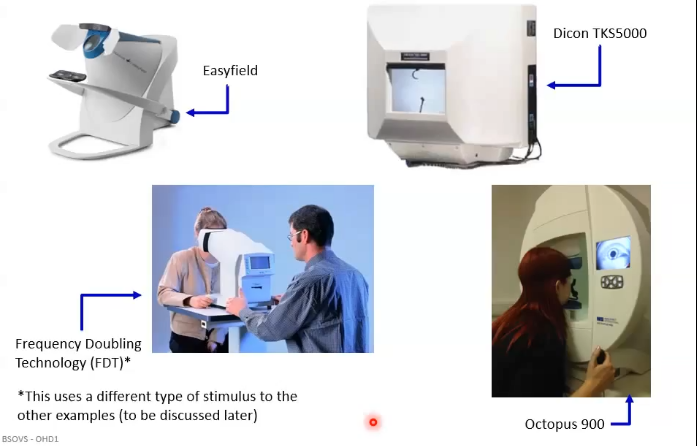
freuency doubling technology FDT
black and white flickering stimuli
when it flickers at a specific speed the stimuli looks like it doubles
thought to stimulate the magnocellular pathway
evaluation of FDT
quick test
robust to optical blur
less robut than GIII to reduced retinal illuminance - if they have cataract or small pupils
px dont always understand it
could lead to false positives
what are you testing for when doing a visual field test
glaucoma: age and family history
disc appearance, IOP, anterior chamber angle
if already diagnosed, monitoring for chages, and if the changes have advanced
also testing if had a stroke, or concerning history or symptoms
what VF test is used for glaucoma
if suspicions of glaucoma- threshold, central 30 degrees
if no suspicions- suprathreshold, central 30 degrees
already diagnosed- advanced threshold central 10 degrees
what VF test is used for no suspicions
suprathreshold as a backup
what VF test is done for a px with suspicions- case history. other symptoms that you cant idenfity for
how far into the periphery should you test would determine what test to choose
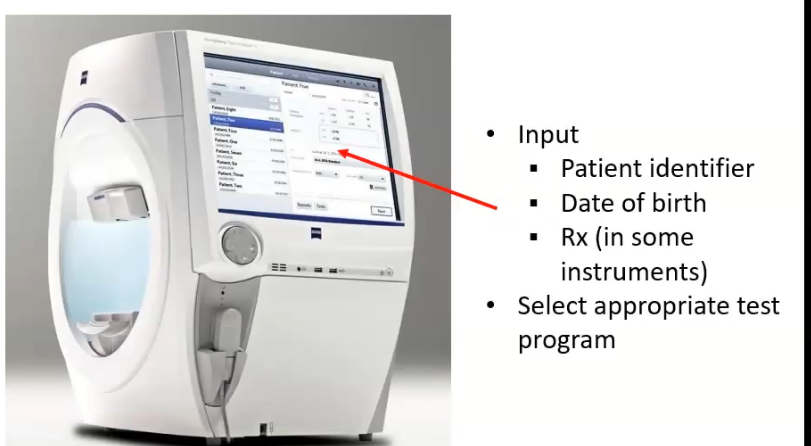
insturment set up
some VF have a lens holder- put the trial lens in to correct the px refractive error
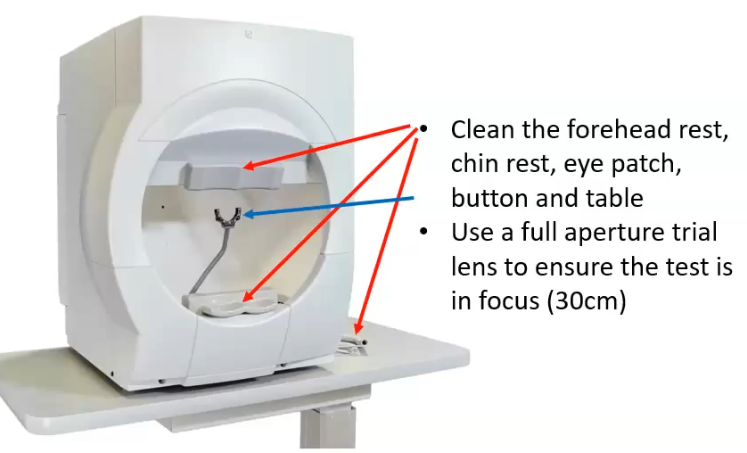
what is the px set up for a VF test
trial lens positoned close to the eye
px places their chin on rest, forehead against bar. would be on the left side to test the right eye
chin rest adjusted
monitor px thoughout
quiet environment
short break before left eye VF done
what is recorded on a VF test
what test was done
and if the fields are normal : WNL is wihtin normal limits
why is the size of stimulus mainly in degrees, and not mm
in mm, spot size stays the same, but the size of the image it makes on the retina is different to how far away it is
in degrees, when the image is further away, image on the retina is made bigger to maintain the same visual angle on the retina
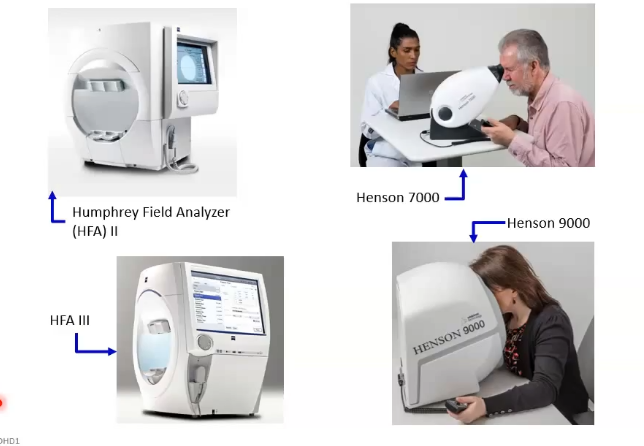
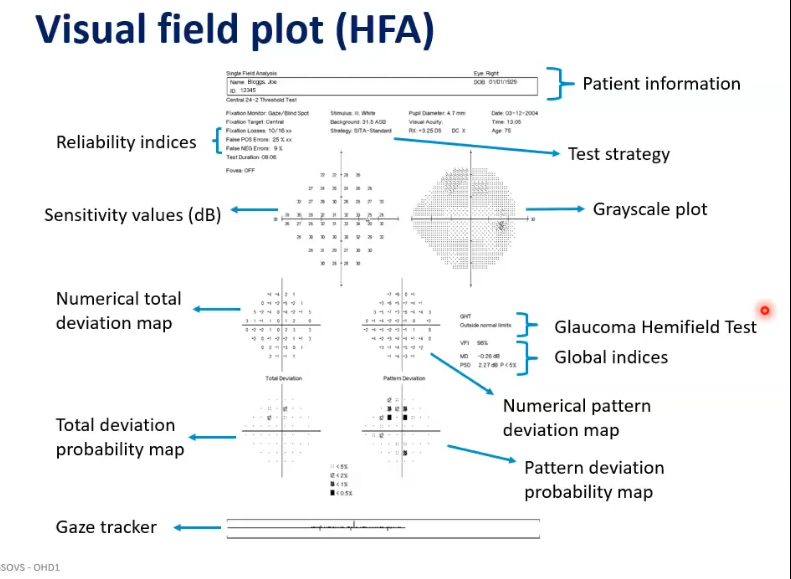
visual field plot of a humphry field analyser
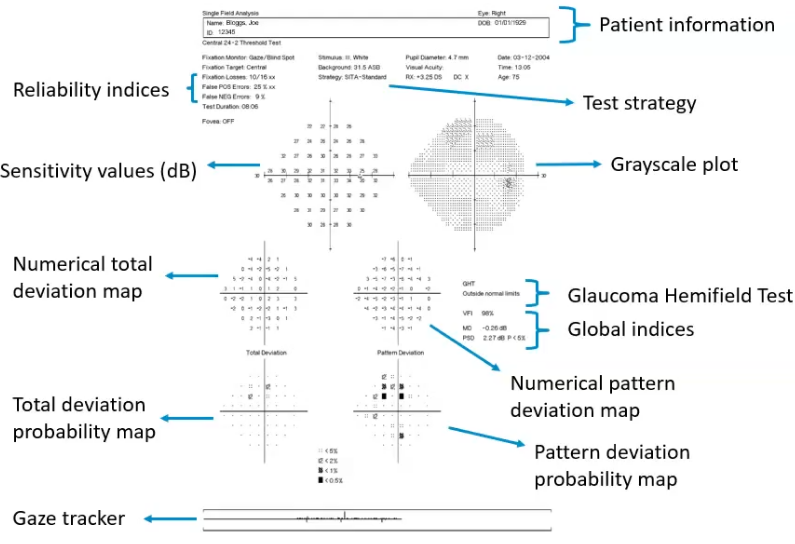
VF plot (hfa): px information
name
ID
which eye tested
DoB
also has test information: eg what test is done,like central 24-2 threshold tets
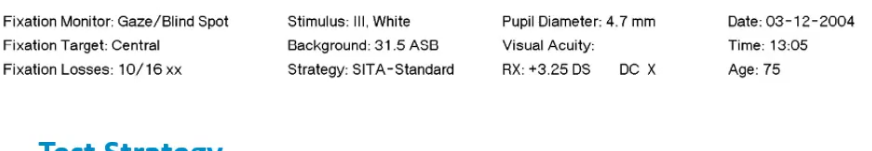
what are the reliability indices on a visual field plot of HFA
fixation monitor: gaze/ blind spot - would be able to track where px moves eyes
fixation losses: eg if recorded as 10/16 x x then would think the px moved their eyes
false POS errors: how many x the px clicked button when wasnt light
false NEG; how many lights were missed
test duration: longer test less likely px is paying full attention. bgger defects = lonnger duration time
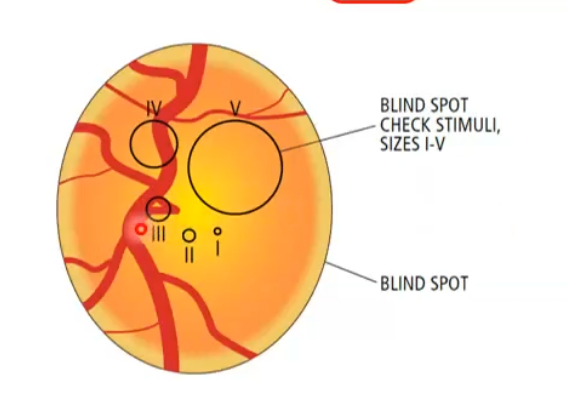
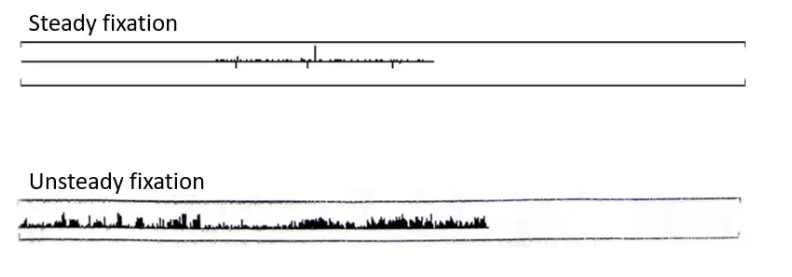
reliability indices: fixation losses
bright stimulus periodically presented at the blind spot throughout the test
a positive px response suggests that the pc may not be fixating consistently
if exceeds 20% may suggest compromised test results
why would fixation losses not always be relliable/ work
can be artificially hgih
blind spoty could be incorrectly plotted
monitoring the px fixation using internal camera can help to distinguish between artefacts and poor fixation
reliability indices: false positives
the px presses the repsonse button in the absence of a stimulus
>15% strongly associated with compromised test results
a high fixation loss rate may actaully be indicative of excessive false positives
considered most important and useful reliability index
reliability indices: false negatives
the px fails to respond to a stimulus they shouldve seen
>15% indicative of inattention
a high false negative rate may indicate that the px is not paying attention to the test
reliability indices: gaze tracking
used with fixation loss measure to monitor fixation stability
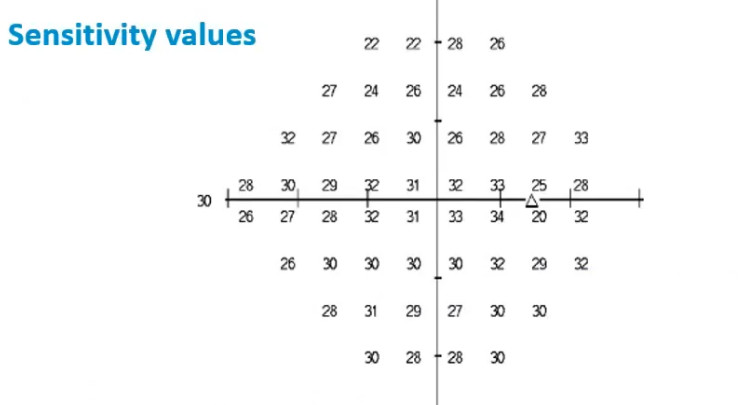
sensitvity values : interpreting VF plot
deicebels values higher in centre
triangle is blind spot so expected to be lower
higher value: high sensitivty: dim lights
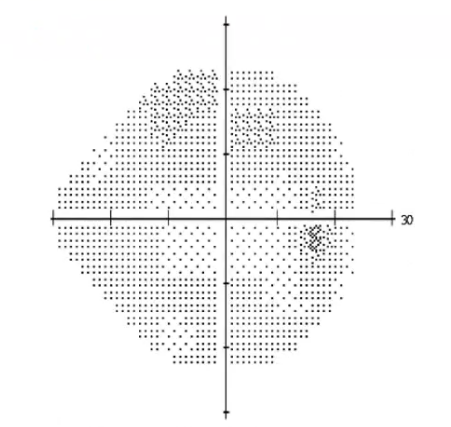
interpreting VF plot: grayscale
visual representation of the data
more condensed the spots, the brighter the spots had to be
limited use when analysing results in detail
interpreting VF plot: global indices
mathematical summaries of all sensitivity values
VFI: visual field index- approx 100% in normal fields, and approaches 0% in perimetrically blind fields
less affected by cataracts and to provide imporved correspondance to ganglion cell loss compared with MD
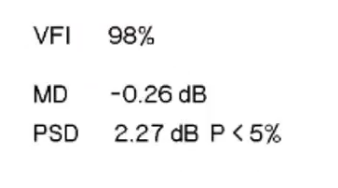
global indices: mean deviation MD
departure from age normal
comparing px to the normative database for specific age group
approc 0dB in normal fields and ←30dB in extreme visual field loss
global indices: pattern standard deviation PSD
ireegularities in the field
small, close to 0, both in normality and blindness
peaks at moderate levels of localised field loss
looks at what parts are less sensitive than others
evaluation of global indices
useful tools to gain a quick idea about the field
summarising enitre field plot into 1 number gives limited information
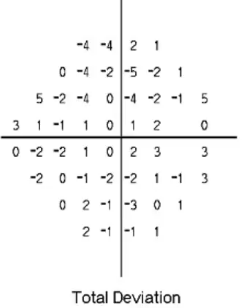
interpreting VF plot: numerical total deviation map
this is looking at each individual number and comparing it to the database
age matched comparison of sensitivity values
-ve = sensitivity below expected values
+ve= higher than expected sensitivity
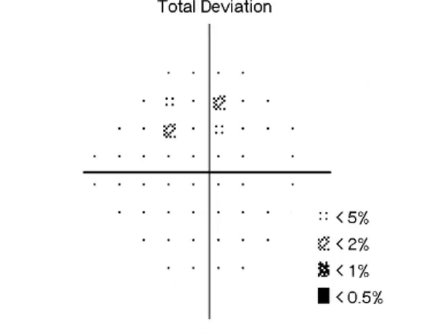
interpreting VF plof: total deviation probability map
representation of TD values, based on probability of normality
eg prob of that spot being normal is less than 0.5%
evaluation of total deviation
normative databse only includes osbervers who meet certain criteria, only on the database if:
-5.00 to +5.00 mean sphere
<2.50 cyl
6/9 or better
largely caucasion/ white
means that those falling outside criteria doesnt mean their values arent normal
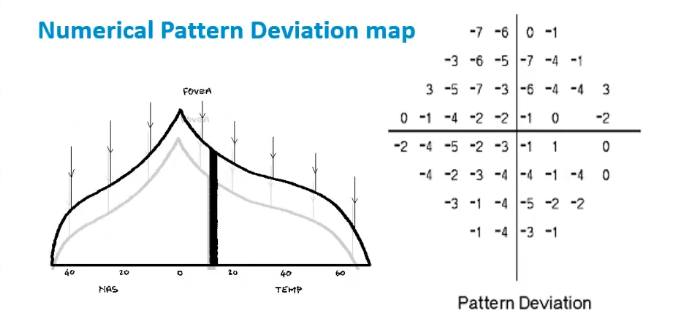
interpretation of VF plot: numerical pattern deviation map
compares the px to themselves
removes any generalised depression in sensitivity - eg ruling out what isnt serious but reasons why values differ
looks only for localised differences and loss
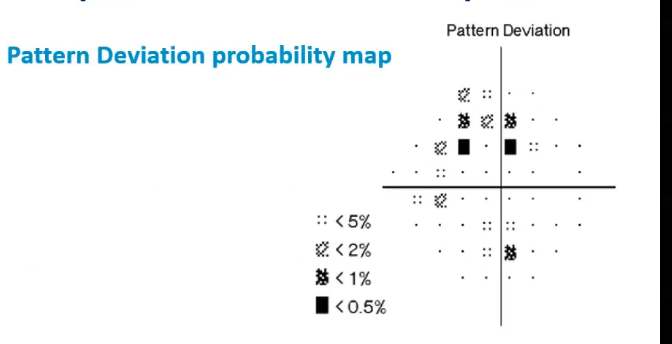
interp VF plot: pattern deviation probability map
if TD and PD maps similar, little/no generalised depression
shows that the prob of values being nomral is eg less than 1%
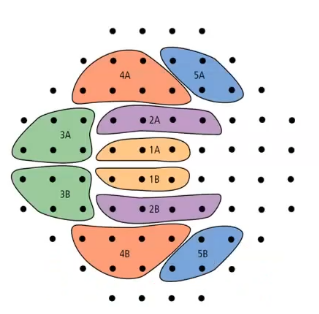
interp VF plot: glaucoma hemifield test GHT
machine scores : whether it is outside normal limits, within etc
specific to HFA
compares different zones of the visual field between superior and inferior hemifields
idea is that the zones comparing should be symmetrical
GHT categories: outside normal limits
at least 1 zone pair differes by an amouont fooound in fewer than 1% of normal observers
CHT catergory: borderline
at least 1 zone pair differs by an amount found in fewer than 3% but more than 1% of normal observers
GHT category: general depression or abnormally high sensitivity
whenever even the best test point locations are either so low or so high they are seen in fewer than 0.5% of normal observers
GHT category: within normal limits
whenever none of the other conditions form categories apply
interpretation of results: what is WANDER
W: what was done
A: how accurate are the results
N: are the fields normal
D: if abnormal, what defects are present
E: evaluate the field
R: is the field repeatable
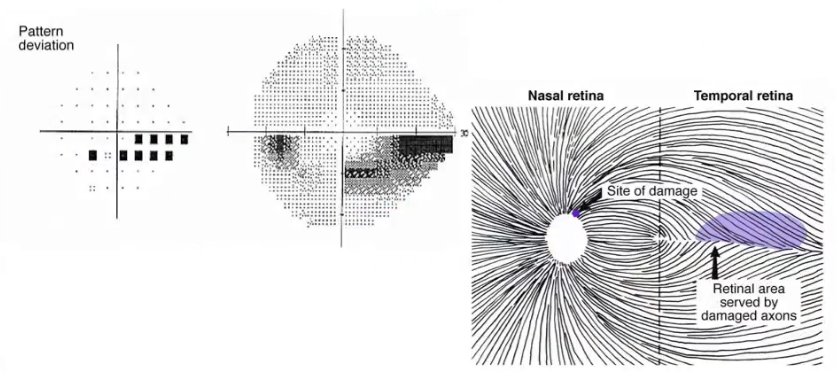
what is the anatomy of the field plot
pattern of the nerve fibres of retina do not pass the horizontal line
if a defect is seen superior/inferior, it is at the level of the retina
pre chiasmal
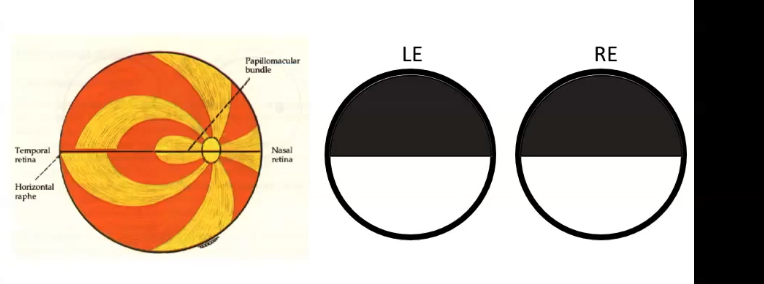
anatomy of the field plot in visual pathway
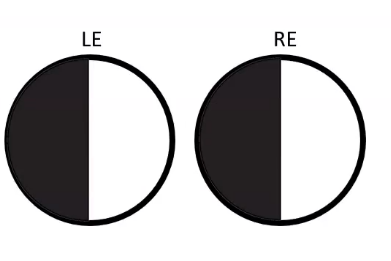
once the information crosses the optic chaism and crossing of nerve fibres, a vertical demarcation is seen here , instead of superior / inferior
would see a pattern of vertical lines on the field plot - which shows post chiasmal
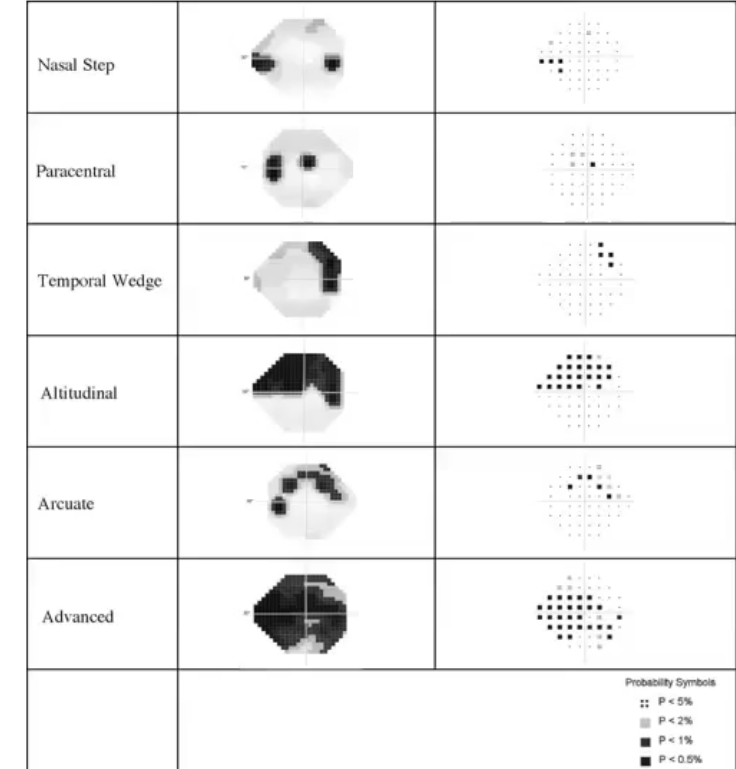
glaucoma field defects: patterns of loss
paracentral : pointed section is the 24-2 , defect at the centre near macula
temporal wedge: defect at temporal side
arcuate goes from disc sup or inf to nasal side
altitudinal: most of one half of VF defected, either superior or inferior, mainly pre chiasmal
advanced: affected majority of visual field
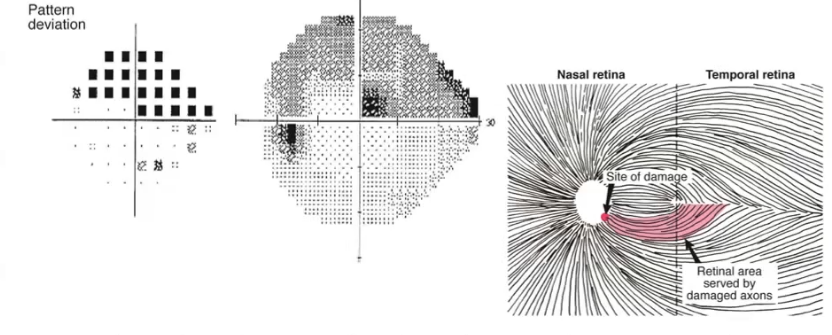
arcuate defect
focal notch at the optic disc, loss of rnf in the corresponding area
physiological blind spot is in the temporal VF, but the optic disc is inthe nasal retina: inversion
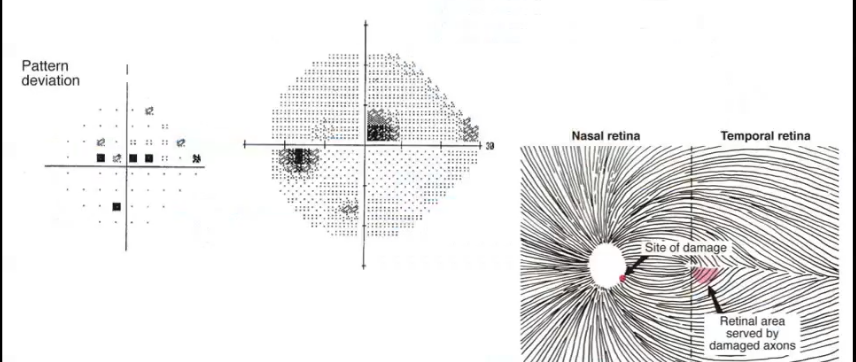
paracentral defect
within 10 degrees of fixation
nasal step
asymmetrical involvement of superior and inferior field