ECN 120 Statistical Tests
 Call Kai
 Learn
Learn Practice Test
 Spaced Repetition
 Match
Match Flashcards
 Knowt Play
1/36

There's no tags or description
Looks like no tags are added yet.
Name | Mastery | Learn | Test | Matching | Spaced | Call with Kai |
|---|
No analytics yet
Send a link to your students to track their progress
37 Terms
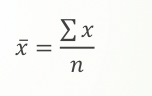
Mean
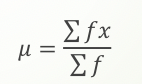
Mean of grouped data
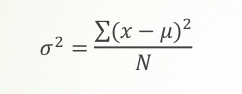
Population variance
Use N-1 for Sample Variance, for frequency tables multiply for squared deviations by the frequency before summing to find the Mean of grouped data.
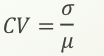
Coefficient of Variation
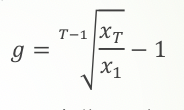
Average Annual Growth Rate
Bayes Theorem

Binomial Distribution
P = Probability of Success
R = Number of Successes
N = Number of Trials

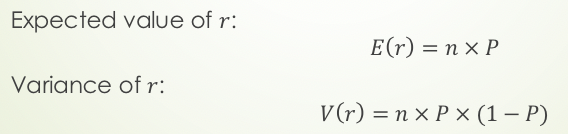
Binomial Approximation to E(r) and Variance of r
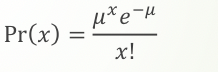
Poisson Distribution
Use when nP<5
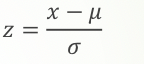
Z-score
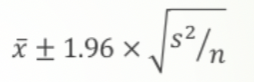
Point Estimate For Mean
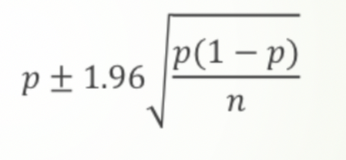
Point Estimate For Proportion
Point Estimate For The Difference Between Two Means

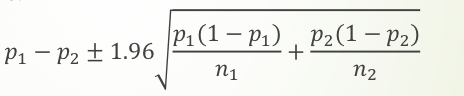
Point Estimate For The Difference Between Two Proportions
Two Tailed Tests at 90,95 & 99%
1.64, 1.96, 2.27
Estimation With Small Samples (n<25), and unknown true variance 𝜎2
Use t-distribution, dgf either; 𝑛 - 1, 𝑛1
+𝑛2 - 2, and pooled variance for the difference between two means
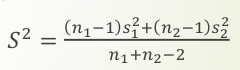
When To Use A Two-Tailed Hypothsis Test
To detect any significant difference (higher or lower) from a standard- ie reject the null if smaller than the left tail or greater than the right tail
When To Use A One-Tailed Hypothsis Test
To detect a specific hypothesis that lies in one direction (greater or smaller) - ie reject the null if; Left Tail- test statistic is less than critical value, Right Tail- test statistic is more than critical value
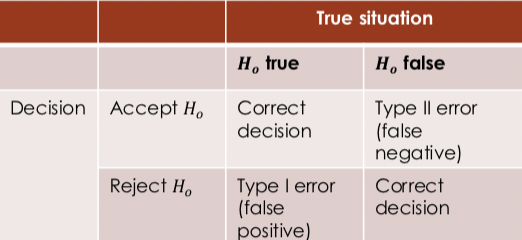
Type One and Two Errors
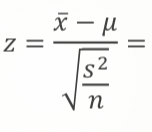
Hypothesis Testing WIth Large Samples
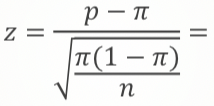
Hypothesis Testing A Proportion
Hypothesis Testing The Difference Between Two Means
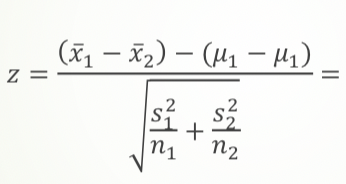
Hypothesis Testing With Small Samples (n<25)
Use t-distribution, dgf n - 1
Hypothesis Testing With Small Samples The Difference Between Two Means
Use pooled variance
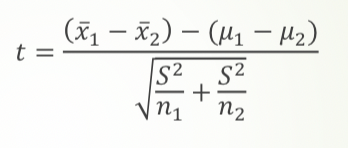
When To Use A Chi-square Test
To estimate the confidence interval of a variance, To compare actual and expected frequencies
Estimating a variance: Confidence
interval
Take half the Chi square values from both the upper and lower tail, ie 0.975 and 0.025 for 95% confidence, to find the upper and lower bounds, use dgf v= n -1
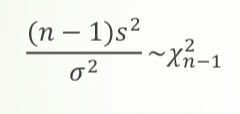
Comparing Actual And Expected
Frequencies
Based on hypothesis ie null = fair die, alternative = biased die, dgf k = 1 (k is the number of possible outcomes), if the test statistic < critical Chi Square value, fail to reject, dgf contigency tables = (rows-1 X columns-1)
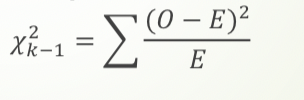
Testing Equality Of Two Variances
Use F-Distribution, Put the larger variance on top of the fraction so you use the upper tail only, n1 -1 = v1 (along)is always associated with the larger variance ad vice versa for n2 - 1 = v2 (down)
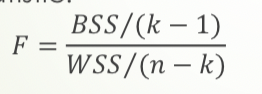
ANOVA
K = number of factors, n = number of observations
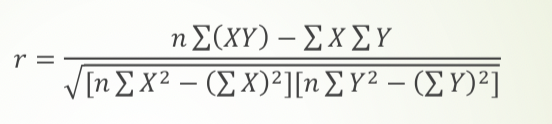
Correlation Coefficient
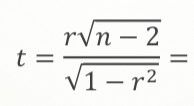
Testing The Significance Of A Correlation Coefficient
Use t-distribution, dgf n-2, if test is greater than t-value, correlation is significant
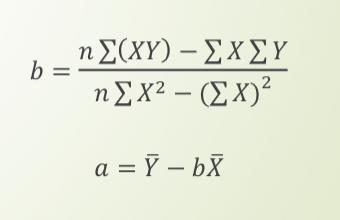
The Regression Line
𝑌 = 𝑎 + 𝑏𝑋
Goodness Of Fit
If 𝑅2 was 0.378, regression could explain 37.8% of the variance of Y
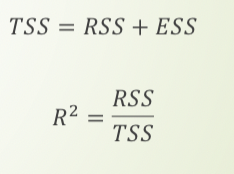
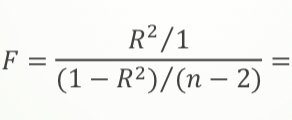
Testing The significance Of 𝑅2 Simple
Compared against F- statitsic, if test statistic is smaller then fail to reject, dgf1 = k , dgf2 = n - k - 1 (k = number of independent or explanatory variables)
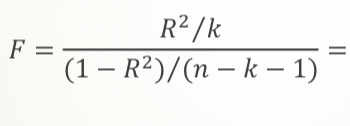
Testing The significance Of 𝑅2 Multiple
Compared against F- statitsic, if test statistic is smaller then fail to reject, dgf1 = k , dgf2 = n - k - 1 (k = number of independent or explanatory variables)
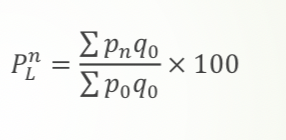
Laspeyres Price Index
For the quantity index switch the places of Q and P keeping 0 and n in place
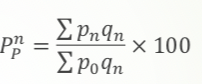
Paasche Price Index
For the quantity index switch the places of Q and P keeping 0 and n in place