Environmental Geoscience
1/356
There's no tags or description
Looks like no tags are added yet.
Name | Mastery | Learn | Test | Matching | Spaced | Call with Kai |
|---|
No analytics yet
Send a link to your students to track their progress
357 Terms
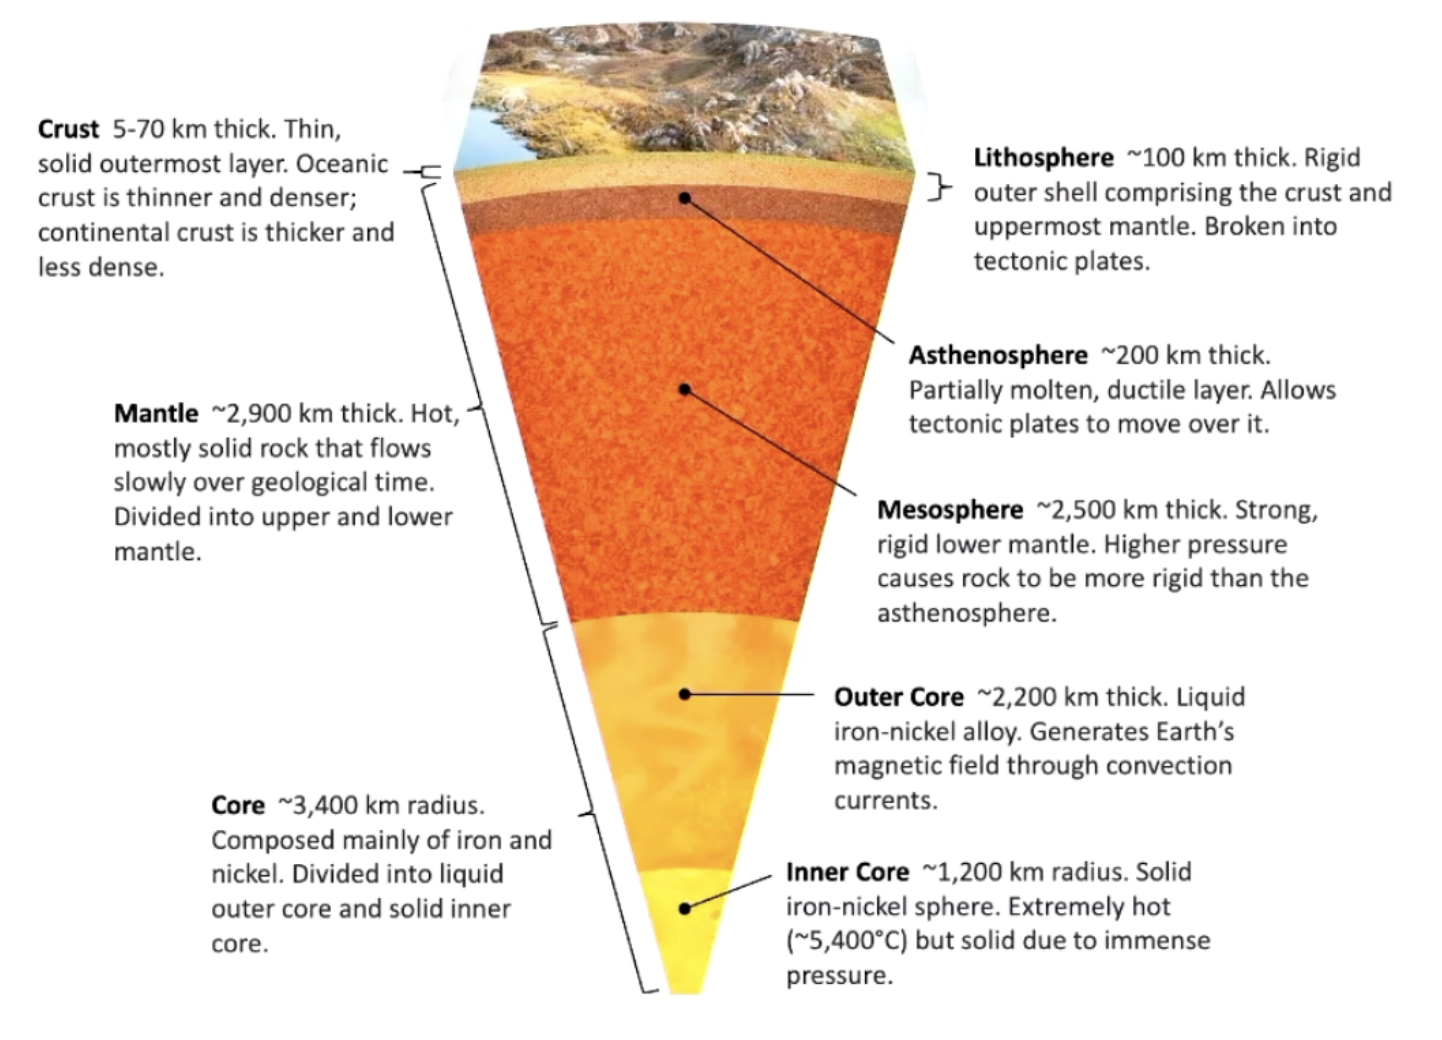
Earth’s structure
how environmental science informs society
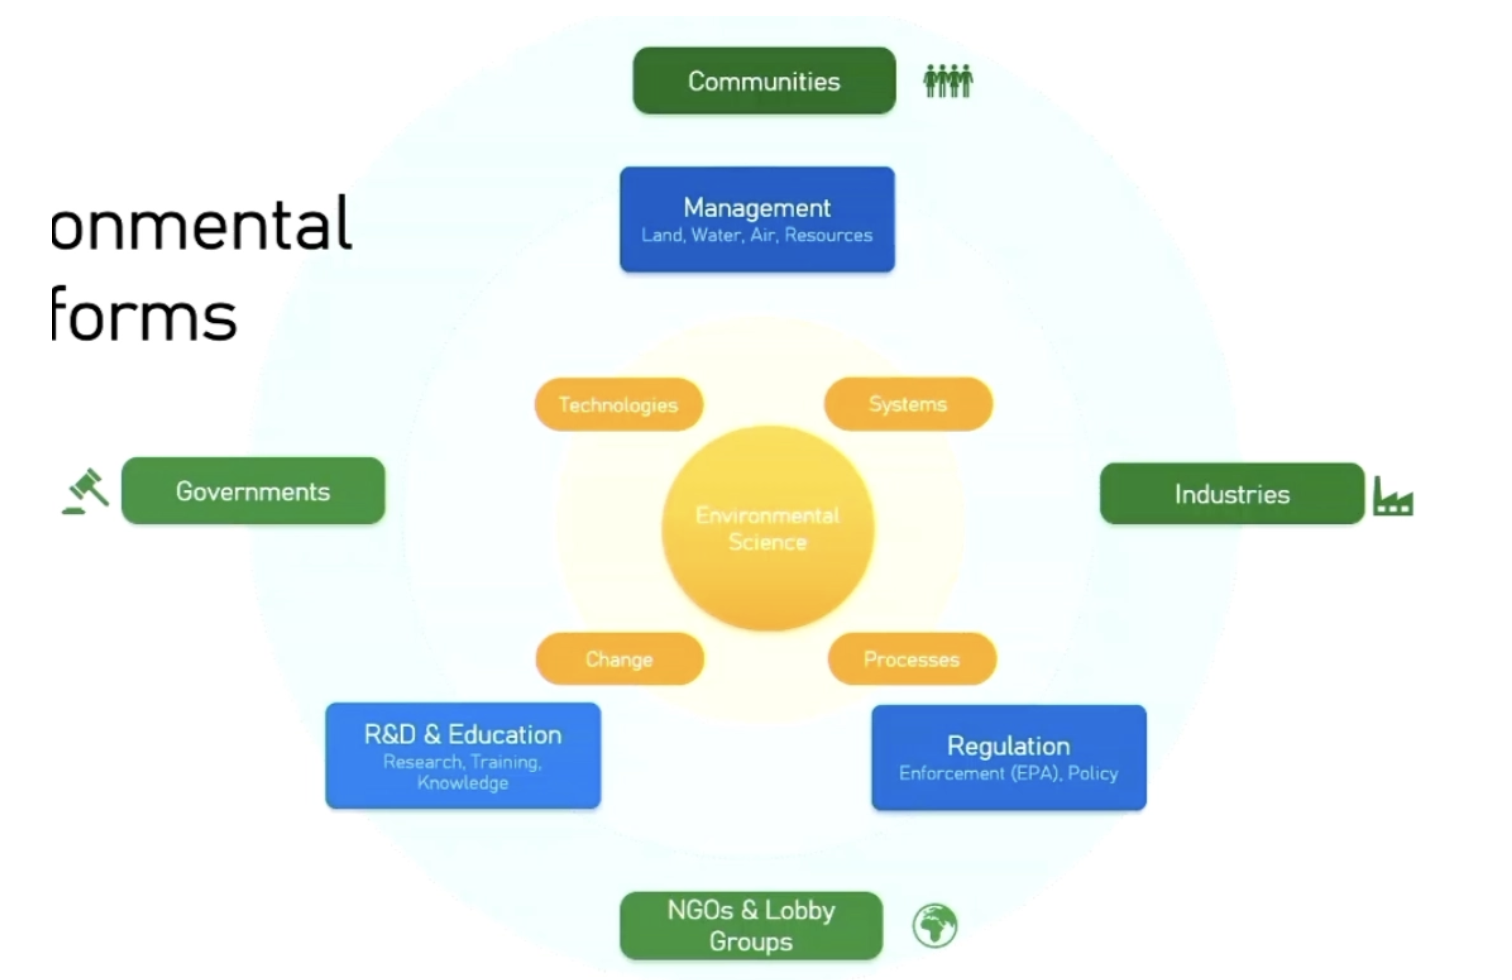
plays a huge role in characterising and predicting changes to physical-chemical processes at the earth’s surface affected by human activity
contributing to interdisclipinary environmental system analysis
identifying trends as opposed to natural baseline variability
what are the fundamental processes leading to the observed change?
over what time will the change occur?
what technologies are available to mitigate the change?
the geological record
a record of environmental change over decades
e.g. Niger, Nigeria, and Chad sees loss of lakewater because unsustainably managed
a record of environmental change over hundreds of thousands of years
a record of environmental change over millions of years
Basalt in Melbourne
formed from volcanoes → lava spat out, air bubbles in rock as well
as rocks erode they become rich and fertile soils, very high in nutrients (calcium phosphate) → can sustain agriculture
granite
forms in continental collisions
doesn’t weather very well, very hard
coarse textured
coarse gravelly soil
low in nutrients (silicon and al-rich)
BUT good for growing wine grapes
the fertility divide
basaltic regions
higher crop yields support denser populations, trade, and urbanisation
fertile land historically drives conflict and colonisation
less rich in mining wealth
granitic regions
poor soil paradox → infertile land drives trade, fishing, manufacturing, emigration → outward-looking commercial cultures
lower agricultural value reduces land conflict
mining regions attract investment but also resource nationalism
rich in mineral wealth → boom-bust economies
BUT important to remember environmental determinism has limits
geologies set conditions, not destinies (climate, institutions, trade routes etc.)
e.g. Venezuela, DRC → should be wealthy buttt
stratigraphy
Australia’s ‘geological diary,’
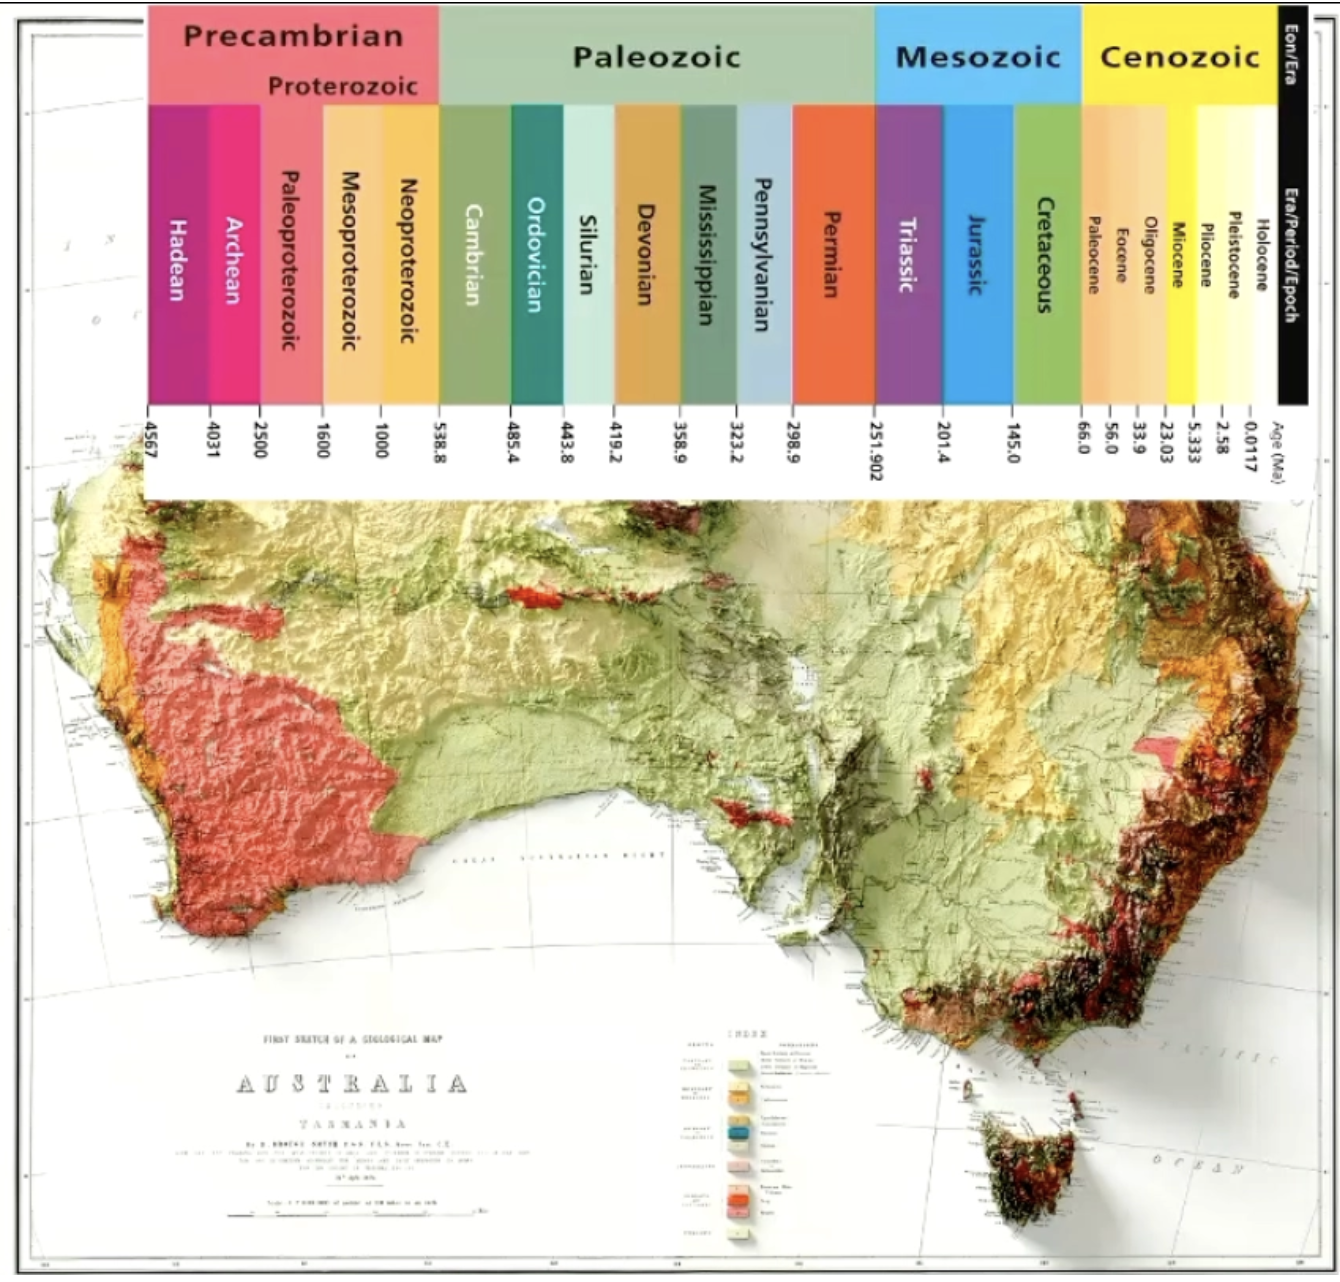
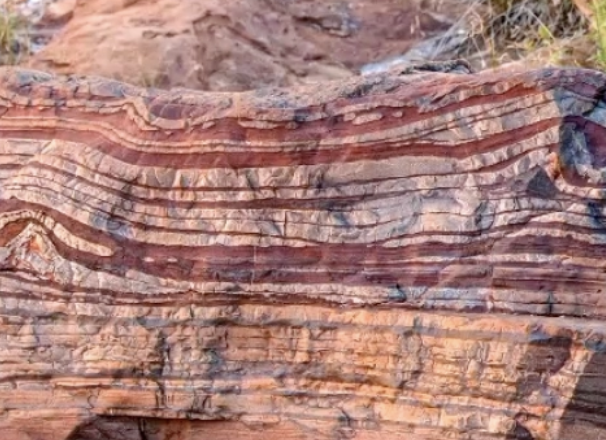
2.4 billion years ago → shallow ocean floor oxygenated by early cyanobacteria (hence reddish)

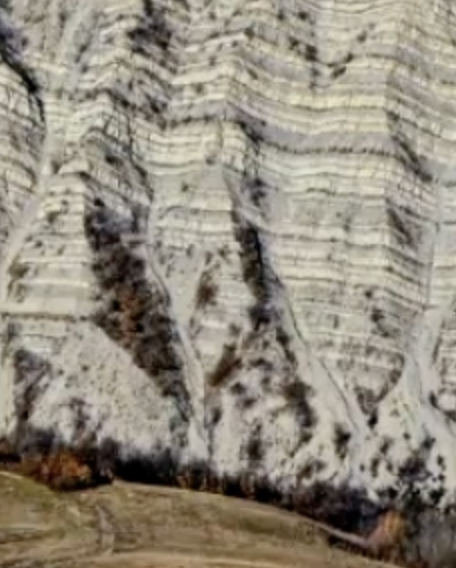
white cliffs of dover → trillions of microscopic shells from warm shallow cretaceous sea, 70-100 million years ago

sweeping curved layers in red sandstonre record ancient dunes in rid desert approximately 200 million years ago
‘aolian processes,’ → windblown across the desert landscape
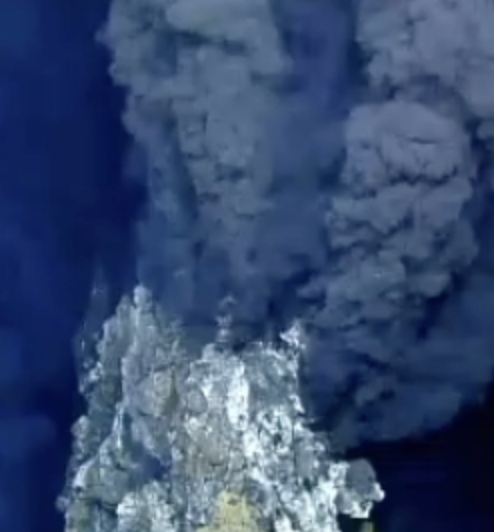
black mineral chimneys spew 400 degree gluid from the seafloor in a mid-ocean ridge hydrothermal vent system
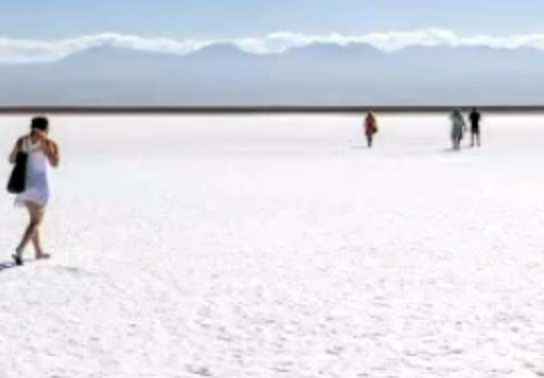
salt plains → white crystalline landscape in an arid closed basin due to shallow inland sea that slowly evaporated
coase sand grades to fine mud repeated in stacked layers → deep ocean floor, deposited by turbidity currents
the evolutionary ladder
cyanobacteria meant that oxygen could be produced on earth’s surface, also therefore allowed for water
phenezoic → cambrian explosion (lots of fossils discovered)
geologically speaking we are in an ice-age period, in previous millions of years there were no ice caps
we’re gonna be a supercontinent one day again!
pangea ultima in 250my+
oxygen isotope ratio variations coupled to the global water cycle
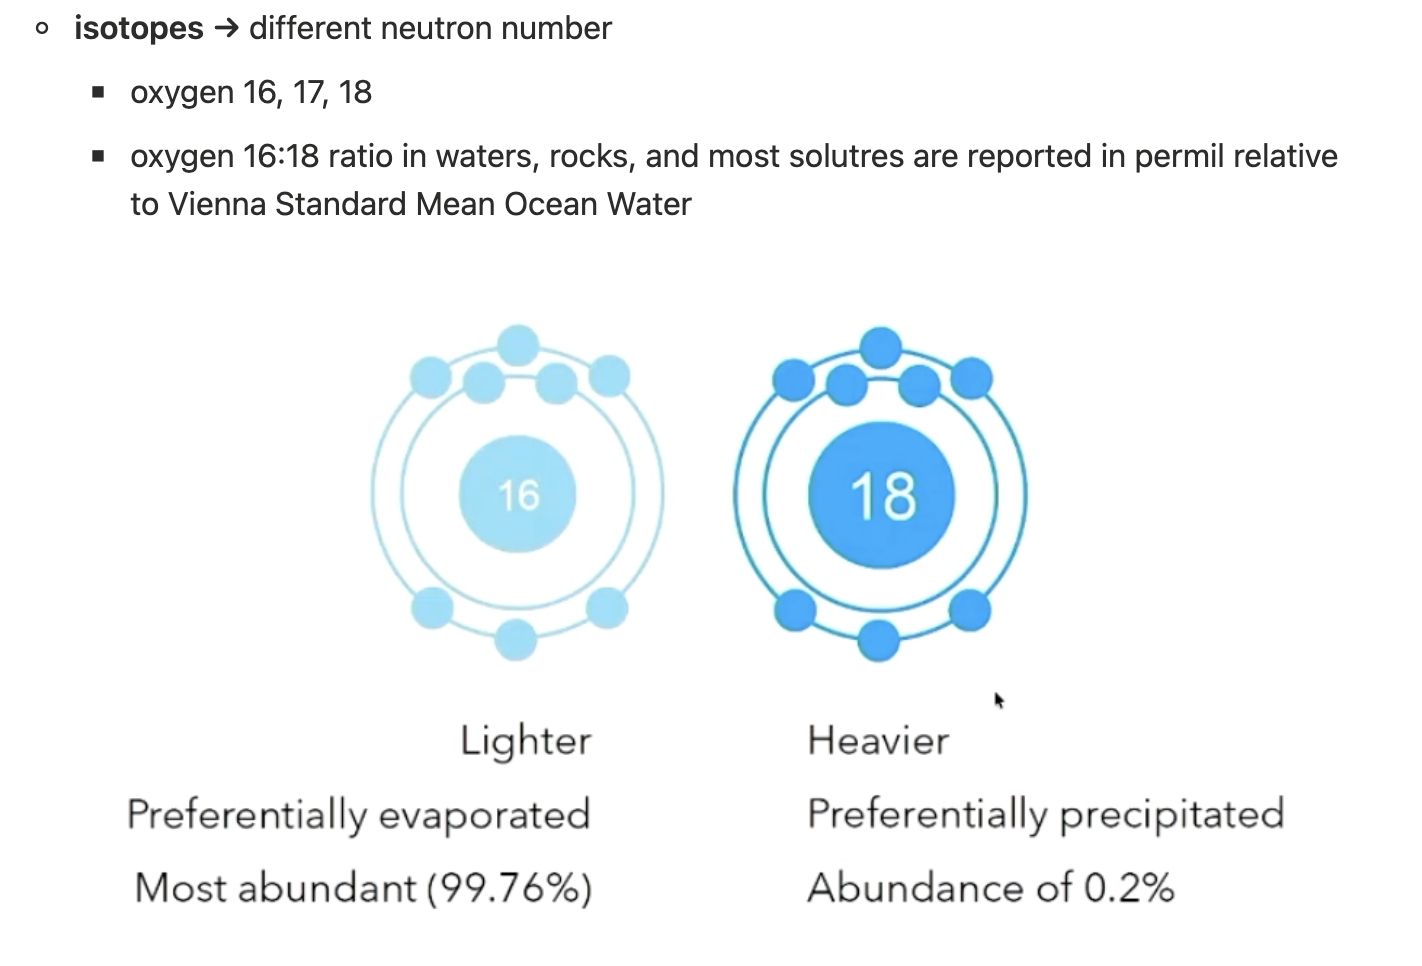
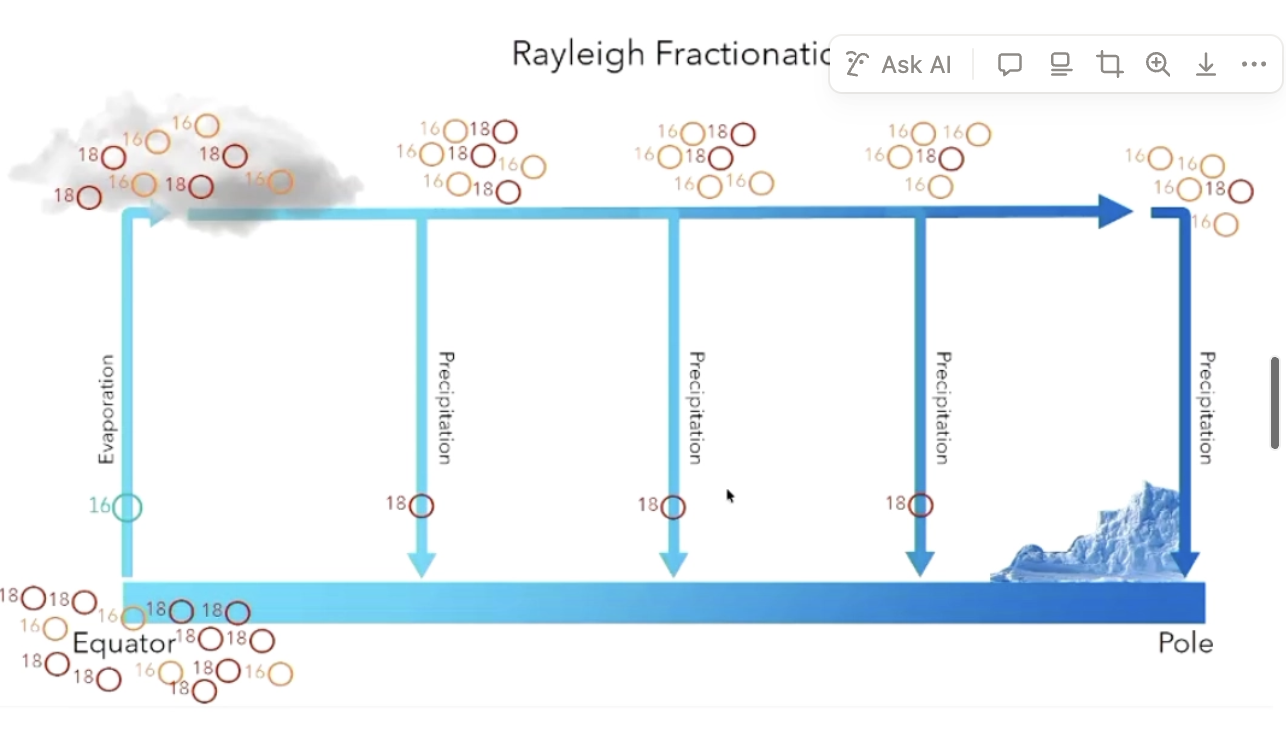
you get less Oxygen 18 as you get closer to the poles bc it falls out of the sky sooner basically
interglacial vs. glacial period
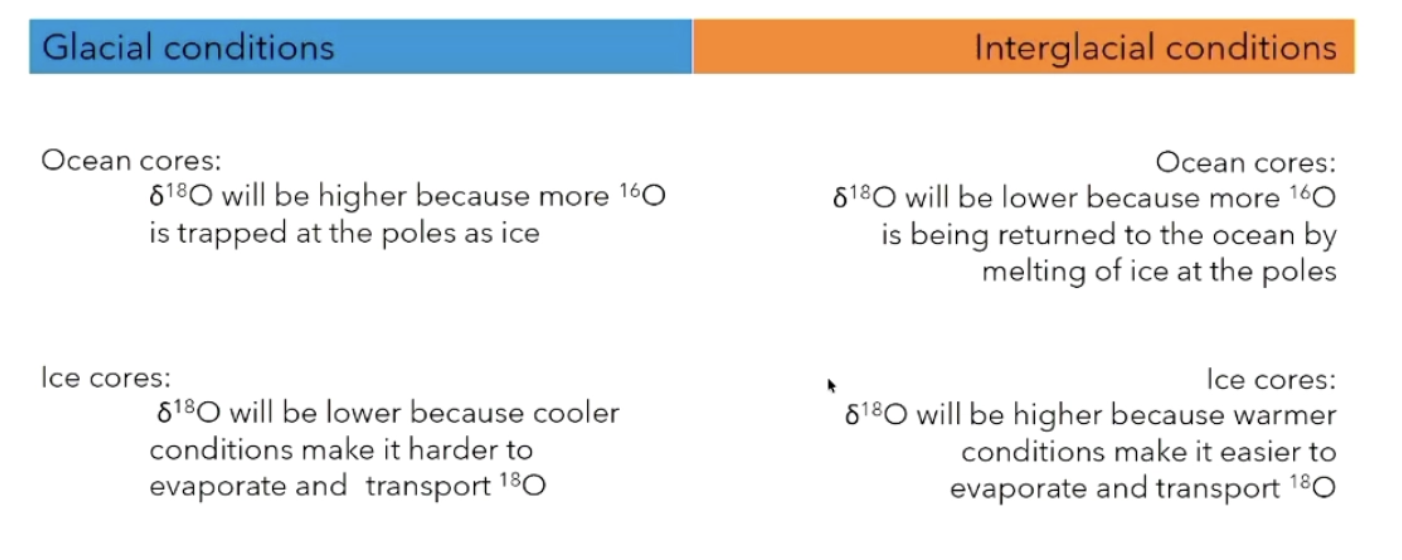
looking at lake and deep sea sediments, ice cores
3.6km of ice shows 400 000 years ago to present day
can see glacial and interglacial periods
reconstructing paleooenvironmental history in corals
18o and Sr/Ca can reconstruct sea surface temperature
need more than ice cores because ice cores are quite localised!
discovered mercury contamination in south china sea during the three civil wars in China → how humans can alter the record
tree rings
thickness of rings impacted by
precipitation
temperature
sun
soil nutrients
wind
so not perfect but does show precipitation variation!
peat sediments show historical record of lead contamination
more paleoclimate and paleoenvironmental indicators
microfossils
pollen
frustules of protozoa (e.g. foraminifera)
macrofossils
tracks
bones
chemical composition
organic carbon concentration
stable isotopic composition (see oxygens above but also with other elements like carbon)
element enrichment (elements found in rock formation under specific environmental conditions)
organic molecules (’biomarkers,’)
speleothems (stalactites)
sedimentary basin
a depression in the Earth’s crust where sediments accumulate over geological time, creating layered sequences of rock.
have layered stratigraphy, organic-rich horizons, and varying permeability
layered stratigraphy
different rock types at different depths
varying permeability
some layers store/transmit fluids, others combine them
organic-rich horizons
source of coal, oil, and gas
pore space
store groundwater, hydrocarbons, and potentially CO2
Australia’s sediment-hosted resources
$239B in energy exports (2022)
6264 PJ of gas production/year
$33B GAB economical value
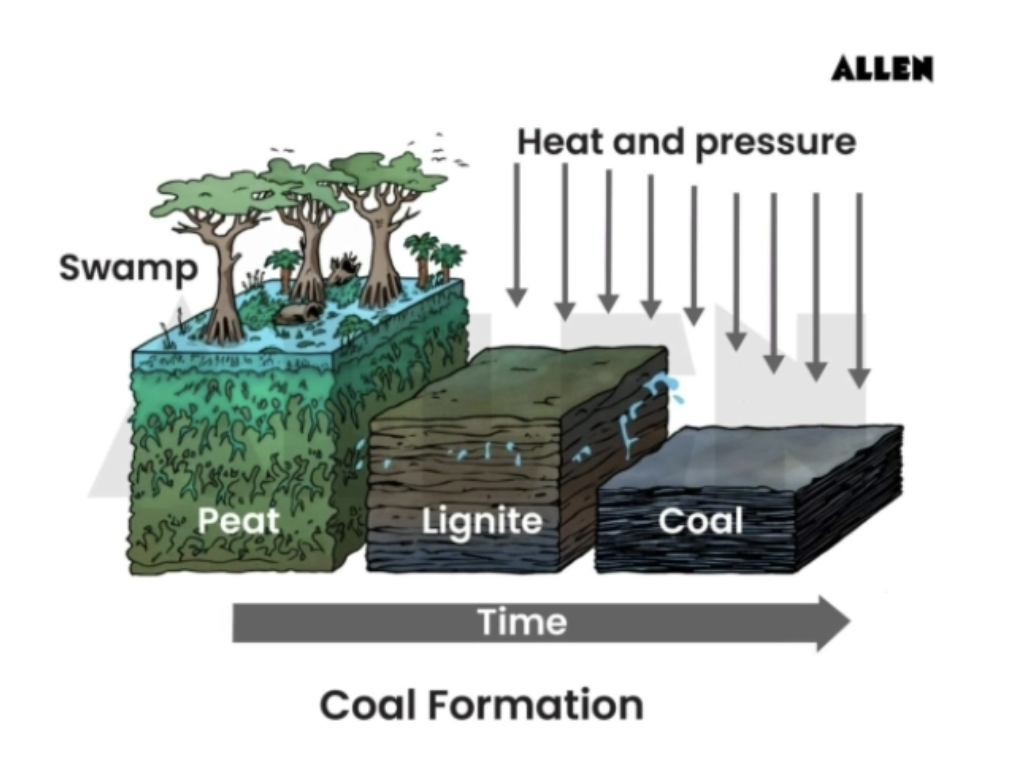
formation and occurence of coal
major coal basins
Bowen, Sydney, Surat, Gaililee, Latrobe Valley
conventional formation of natural gas
porous reservoir rock (sandstone)
impermeable seal (mudstone/clay)
structural or stratigraphic trap
gas migrates and accumulates
unconventional formation of natural gas
coal seam gas (CSG) - absorbed on coal
tight gas → low-permeability sandstone
shale gas → organic-rich mudstone
no migration needed - gas stays in source
trapped by water pressure rather than structural traps
Unlike conventional gas, which migrates and is trapped by impermeable seals, CSG stays within the source coal
Coal seam gas (csg)
methane is absorbed onto the surface of coal within coal seams
held in place by hydrostatic water pressure
operators pump water from coal seams to reduce pressure
methane desorbs and flows to the surface
associated water must be treated and disposed (extraction is fundamental to CSG)
the great artesan basin
a sub-surface water reservoir laterally and vertically connected across sedimentary basin and lithological boundaries
1.7 million km2 → one of the world’s largest groundwater basins
supports $33.2B/y in economic activity
historically 2000ML/day extraction
now ~1500ML/day (improved management
multiple aquifer layers: springbok, hutton, precipice sandstones
supports agriculture, pastoral, mining, and town water
other sedimentary basin resources
mineral sands
uranium
sedimentary iron ore
co2 geological storage
resource co-location
a single column may host:
0-10m: irrigation water (condamine alluvium)
10-100m: groundwater
100-900m: coal & CSG
800-4000m: CO2
extracting one resource changes conditions for others
condamine alluvium
name of soil package of top 30ish m, basically the water/(soil?) that interacts with weather, very seasonally/precipitation dependent, susceptible to evaporation).
the surat basin
21000+ registered water bores
215GL/year of groundwater extraction
7500 active CSG wells
510 PJ/year CSG production
95GL/year of CSG associated water
528 bores affected
aquitard
an impermeable geological unit
petroleum system of the surat/bowen basins
the big rig in Roma, australia’s first oil production starting in 1907
oil occured below the seal layer for big rig
depressurisation problem
registered water bores, 215GL extraction per year, 95 GL water from CSG
CSG extraction depressurises the Walloon coal measures (underground coal layers that normally contain groundwater) which propogate upward through the springbok sandstone
When the pressure drops, water from surrounding rock layers can start moving toward the coal seams to replace the removed water.
Pumping water out of the coal seams pulls groundwater down from the sandstone aquifer above.
This can lower groundwater levels in the aquifer, which may affect springs, bores, and ecosystems that rely on that water.
condamine alluvium water table affected:

water intensity and production trends
water intensity dropped 80% GL/PJ
but cumulative aquifer impact continues at ~38GL/yr
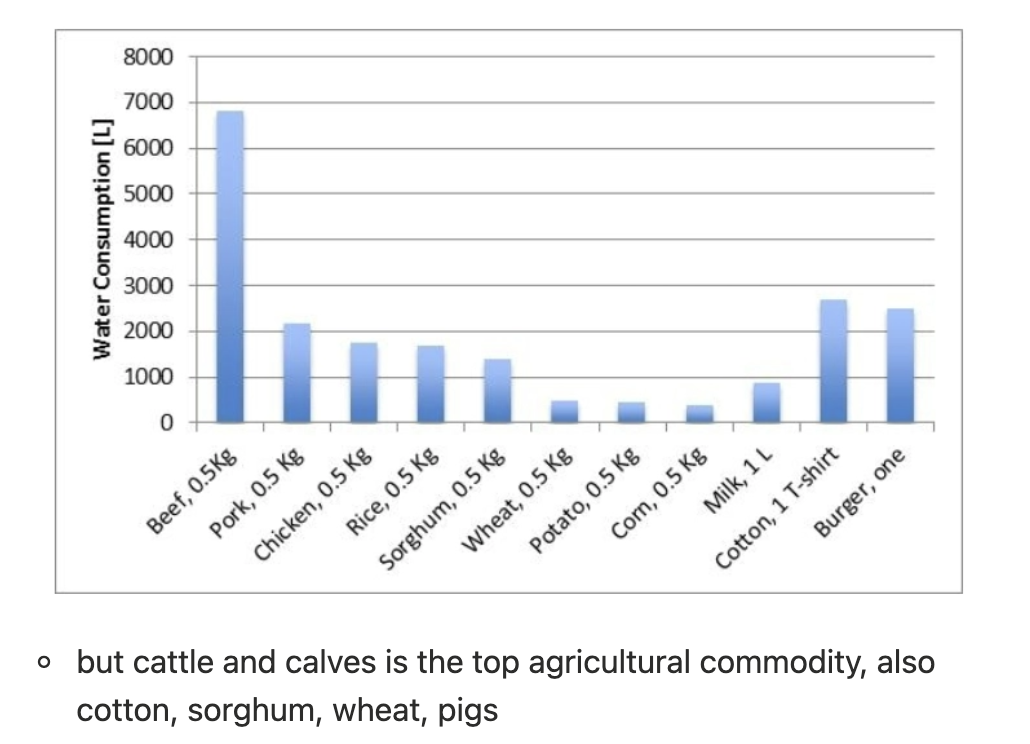
irrigation, cattle grazing, certain crops require a lot of water
water demand by farming → artesan basin has huge agricultural industry
519.4M = gross value of western downs
water requirements for plant and animal products
how will water from CSG production be used or disposed
capacity for subsurface water storage (Acquifer managed resource)
putting the water back into the aquifers
acquifers have natural filtration capacity, removes particulates
good in bushfires, surface water is often contaminated (ash)
can offset drought years, we can turn to groundwater
hydraulic conductivity
how well the ground can absorb water
low: means ground is less absorbative of water, better to mine for CSG as less water will inflow from surrounding aquifers
multi-resource development in the surat basin
multiple resources occur in near proximity
oil & gas, coal, CSG, surface and groundwater
over 100 years of resource development and economic wealth
unconventional oil and gas production such as CSG production now requires integrated water management
shale oil and gas production will pose further water challenges
water is almost exclusively stored at surface leading to significant loss through evaporation
groundwater recharge into the condamine river alluvial aquifer has large potential
groundwater recharge
the hydrologic process where surface water, such as rain or river runoff, moves downward through soil and rock layers to replenish underground aquifers
Managed Aquifer Recharge (MAR): Intentional, engineered, or "artificial" replenishment to boost water supplies, reduce evaporation loss, and prevent land subsidence.
explain what the great artesan basin being laterally and vertically connected across sedimentary basin and lithological boundaries means for resource management when CSG operators depressurise the walloon coal measures.
alters the pressure gradient, which may cause the water to move to areas of lower pressure
condamine alluvium water level (name of soil package) → surface layer that interacts with the environment, very susceptible to seasonal/rainfall variations, susceptible to evaporation
as CSG production increases, condamine alluvium water level (in m below surface) also increases → water level is decreasing
removing water from higher layers, some farmers may not be able to access water if their wells don’t go deep enough
extract water from the top layers to reduce the pressure on the gas trapped in the coal seams
shell build a pipeline delivering treated CSSG water to chinchilla weir, farmers pay $4/ML but face 1$60/ML if they don’t take agreed volumes. Is this equitable?
shell benefits as farmers are responsible for building dams, storing water, bearing the risk
encourages farmers to build dams to store the water → transferring the cost of CSG water storage onto the farmer
but not the most equitable as shell bears no risk
the 528 registered bores that will be affected represents 2.5% of the overall 21000 bores, but are the remaining bores safe? why might this prediction be uncertain?
No — the remaining bores are not guaranteed to be completely safe. The prediction that 528 out of ~21,000 bores (≈2.5%) will be affected is based on modelling, not certainty. It means those bores are expected to exceed a “trigger” drop in water level, but other bores could still experience smaller or unpredicted impacts
Predictions are uncertain because groundwater models rely on incomplete data, assumptions about geology, and unknown future development of CSG extraction.
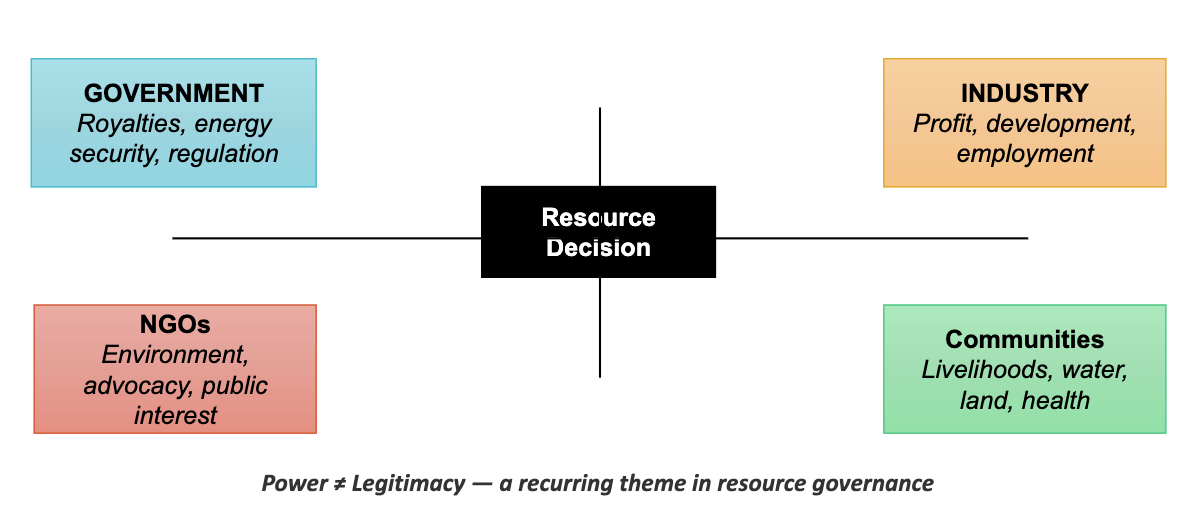
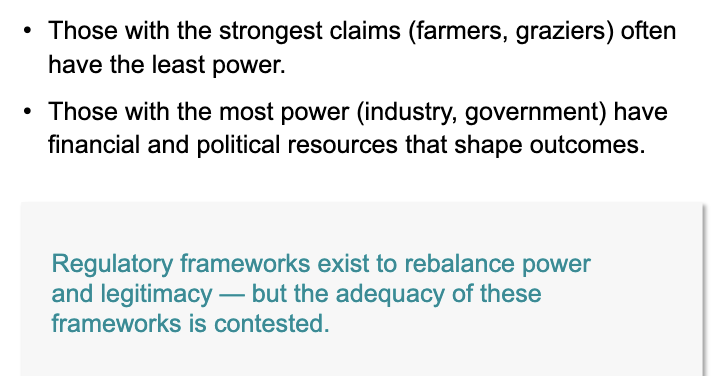
stakeholders of environmental management
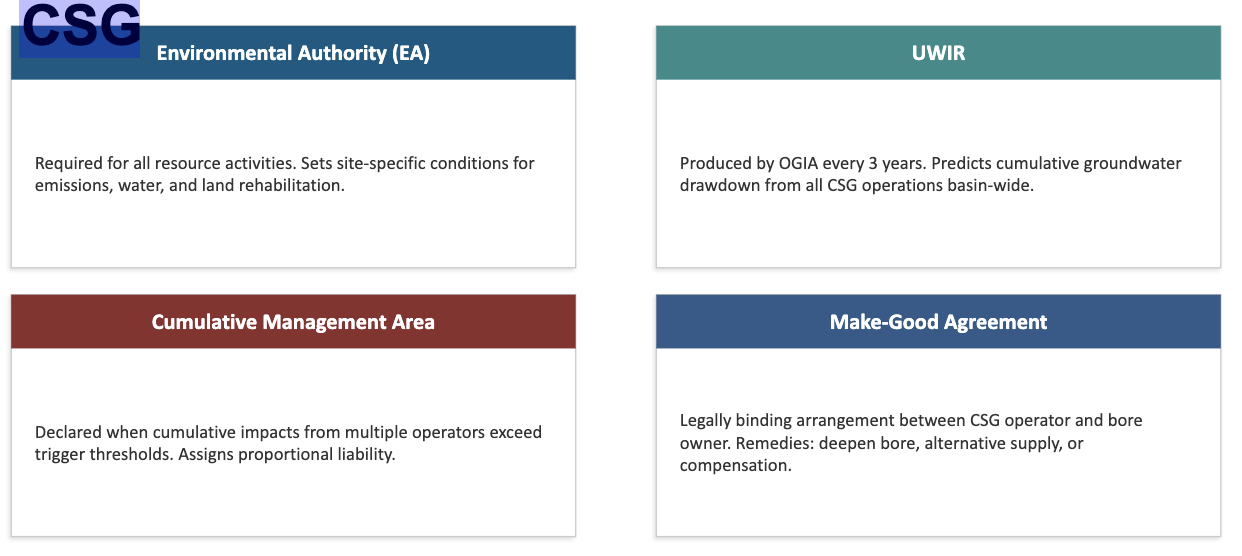
Queensland’s Regulatory Framework for
CSG
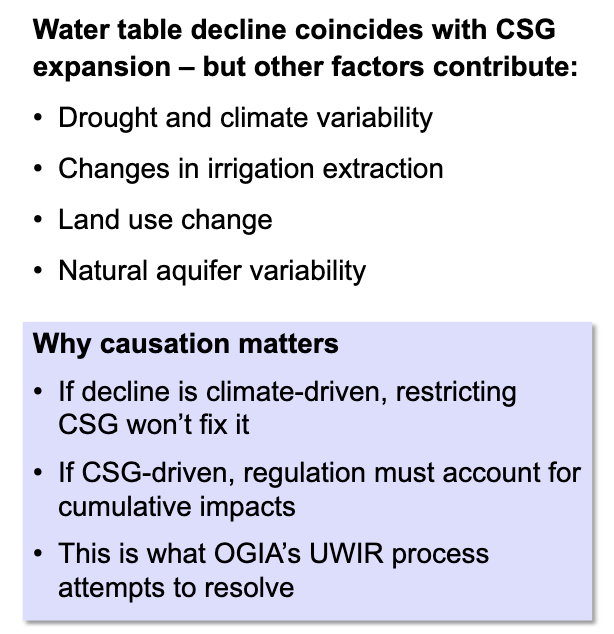
other potential contributors to water table decline
Legitimacy vs. Power in Resource Decisions
deep carbon cycle
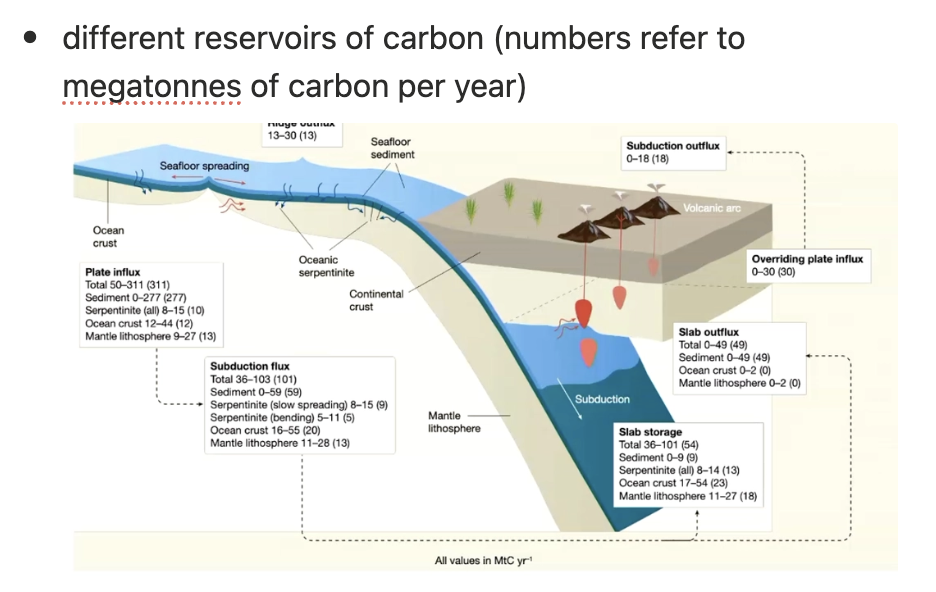
carbon influxed into oceanic sediments
surpentinite
molten interior of the earth is exposed to the overlying water column (surpentinisation and uptake of carbon within surpentenite rocks)
carbon within oceanic crust as new oceanic crust is formed, and the mantle lithosphere
the whole oceanic plate is a massive carbon reservior
as a parcel of oceanic seaflor travels it can pick up more carbons, can come close to and erode continents which deposits into the oceans
continental deposits get incorporated into the oceanic sediments
eventually might find a place like a subduction zone (125km depth ish) where the oceanic seaflor is being subducted under the overriding continental crust
opens up pore spaces in the bending plate → water can get into, surpentinise, extract even more carbon from the surface
portion of the carbon stays inside the plate and becomes mixed deeper and deeper into the molten interior of the earth
a lot of carbon is released → devolatilisation
volatile gases like carbon can’t stand the pressure and temperatures at the subduction zone
released into mantle above, percolates into the base of the overriding continental crust
volcanoes → outflux and released back into the atmosphere
shorter deep carbon cycle explanation
i.e. carbon sequestered into the plate, plate recycled into the interior of the earth, devolatilisation of the subducting plate occurs, portion of carbon is released back through the mantle and overriding plate into the atmosphere
repeats and repeats over millions of years
interesting stuff about deep carbon cycle
a mass balance between influx and outflux can be observed at ocean ridges and subduction zones over geological timescales
divergent plate boundaries (ocean-plate ridges) contribute a lot more carbon to the atmosphere than we previously thought
(we overestimated volcanic arcs on the pacific rim)
plankitic calcifiers
only evolved ~200mya are responsible for sequestering much of the earth’s emissions
take carbon, turn into shell/rock, die
build huge carbon reservoirs on the seafloor
controls on carbon sequesteration
biological:
evolution of planktic calcifiers
dense rainforests during the cretacious
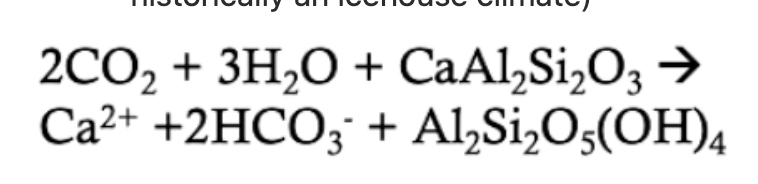
chemical weathering of silica rocks at the earth’s surface:
draws down and traps carbon in the sedimentary products
usually deposited in ocean
(high strontium ratio takes too much carbon, historically an icehouse climate)
i.e. spreading silica crystals on beaches to wash out to sea and absorb crystals, cannot compensate for anthroprogenic emissions because it cannot be accomplished on the required scale
long-term, natural carbon sink
its natural pace is too slow to compensate for current anthropogenic emissions
chemical weathering equation
carbonate compensation depth
depth below which calcium carbonate dissolves completely (CaCO3)
deeper in warm waters, shallower in cold waters (capacity of ocean to fill itself with carbon)
i.e. if waters are too warm than CaCO3 doesn’t dissolve soon enough to store lots of carbon
ocean can store less carbon, which means more is present in the atmosphere
short-term carbon cycle
atmosphere: CO2 traps heat → greenhouse effect → global warming
ocean: CO2 dissolves → carbonic acid → ocean acidification
land: CO2 feeds photosynthesis
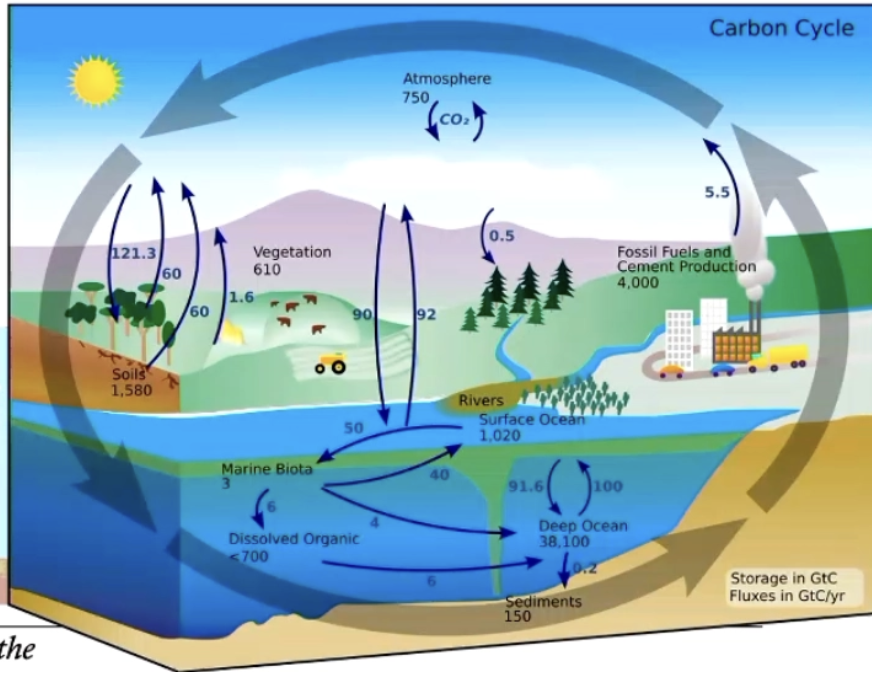
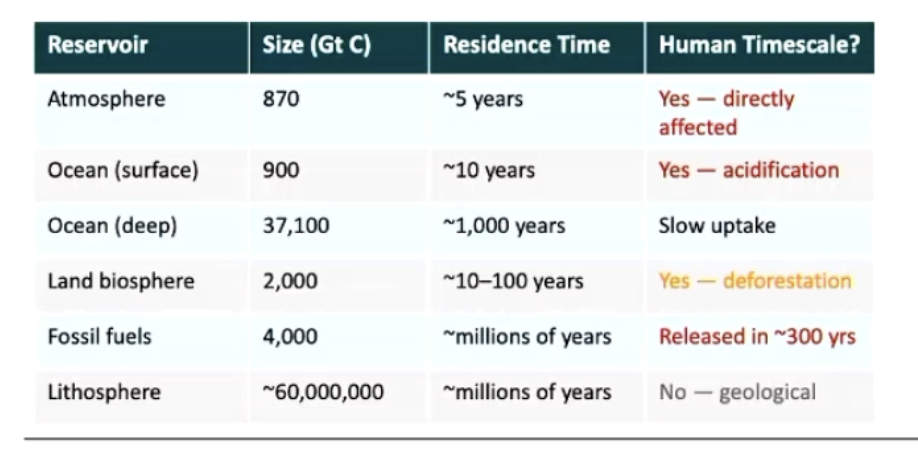
co2 reservoirs
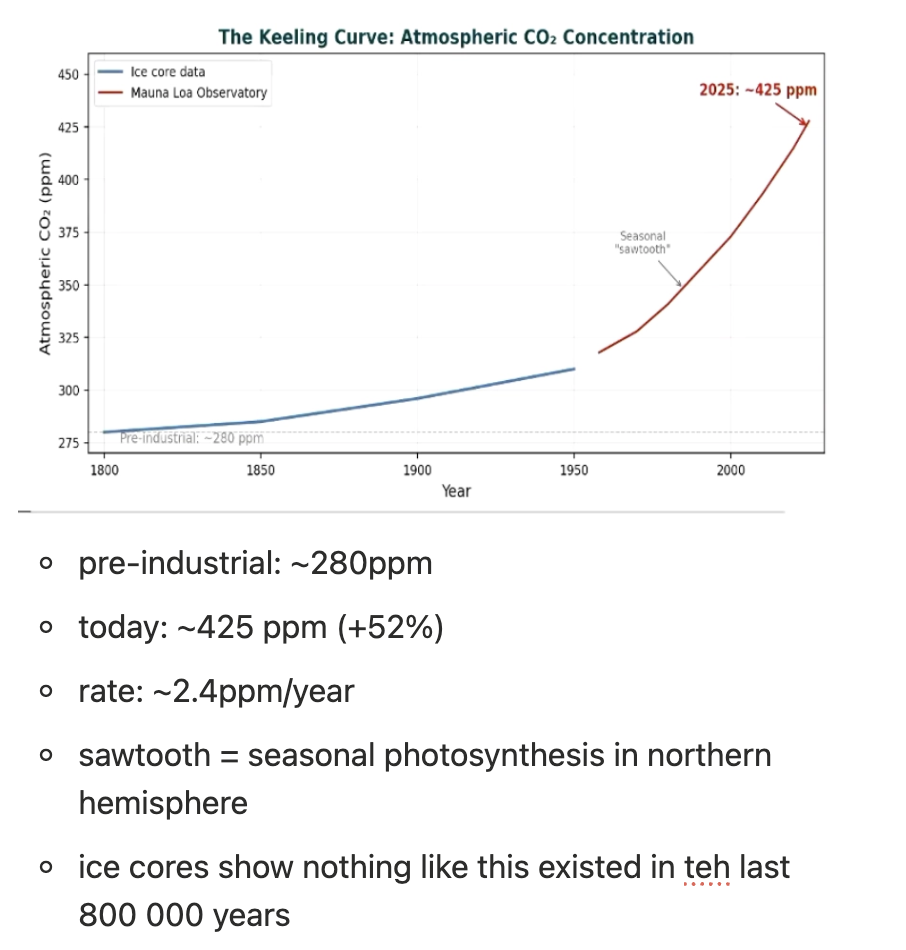
the keeling curve:
carbon reservoir sizes and fluxes
land ~27%
vegetation
litter
soil
ocean ~25%
surface ocean
surface biota
intermediate and deep ocean
sediment
atmosphere ~48%
fossil fuels and land use changes are small year-year but accumulate
deforestation is in a significant ballpark to our fossil fuel emissions
carbon cycle and humans
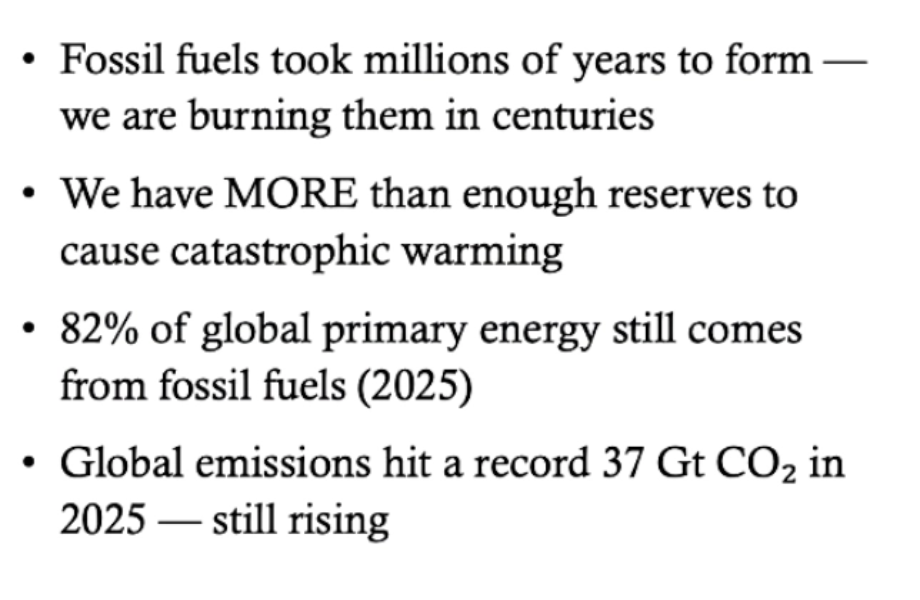
fossil fuels
solar energy stored over hundreds of millions of years, released in just a few centuries
resource vs. reserve
inferred how much of that resource we have underground vs.
once we have a very reliable estimate it becomes a reserve
need a means to access
growth in oil reserves (probs don’t need percentages!!)
middle east - 47.5%
south and central america - 19.5%
but e.g. venezuela, political issues
north america - 16.9
fracking → only produces light crude oil which american plants can’t process, have to export all of it.
venezuela has all the heavy crude oil
australia (asia pacific) by far least
aus has wound down oil production recently
growth in natural gas reserves
middle east - 43.2%
europe and eurasia
a lot for aus → one of our largest exports
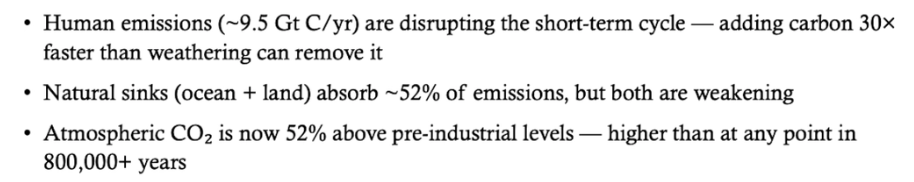
major trade movements
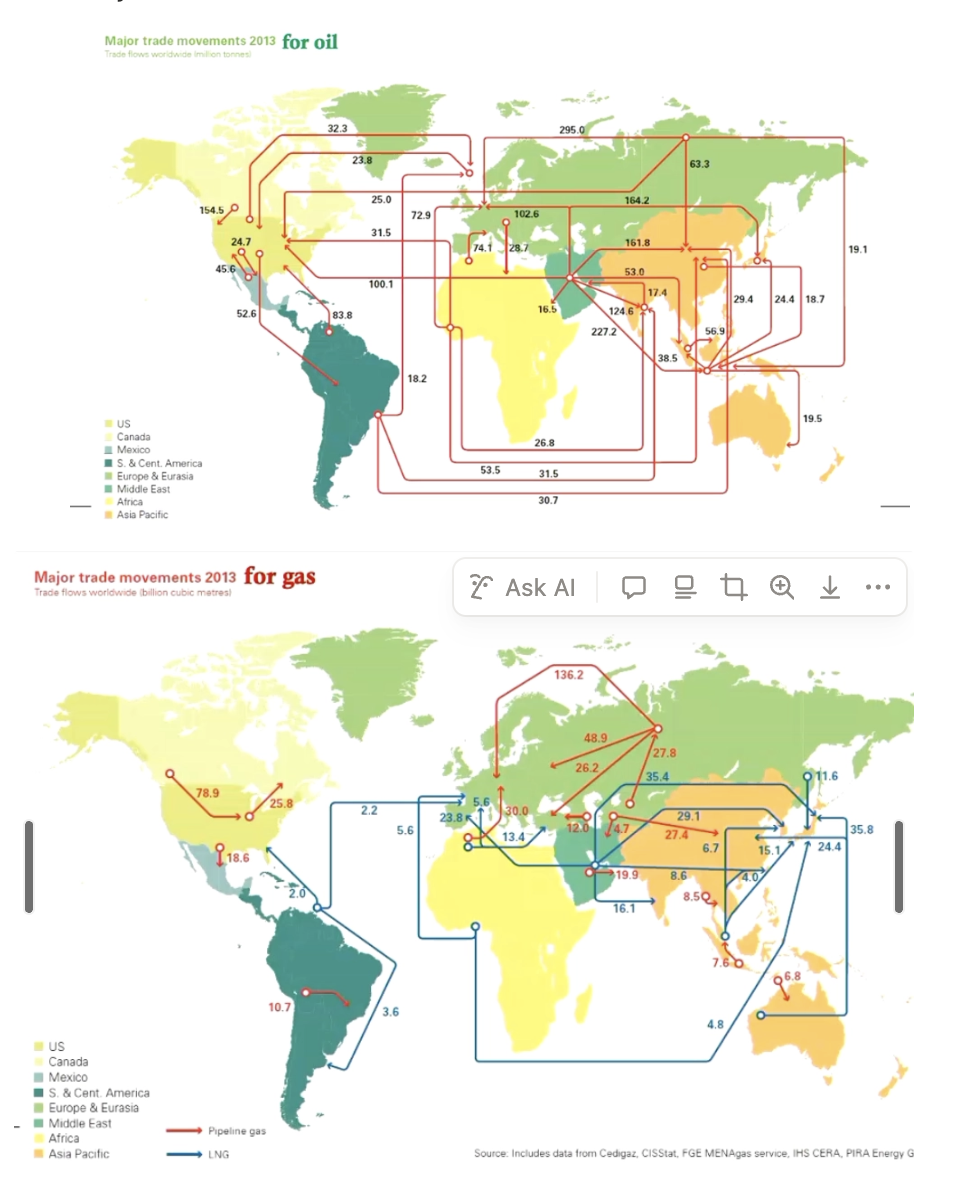
closure of the strait of hormuz
affects 20 million barrels of oil per day
27% of global seaborne trade
20% of global LNG, and 84% of asia-bound share
~16Mb/day remains at risk even with full pipeline bypass utilisation
decline in global coal reserves
world’s kind of had enough and is transitioning
mostly europe, then asia pacific, north america, middle east, s + central america
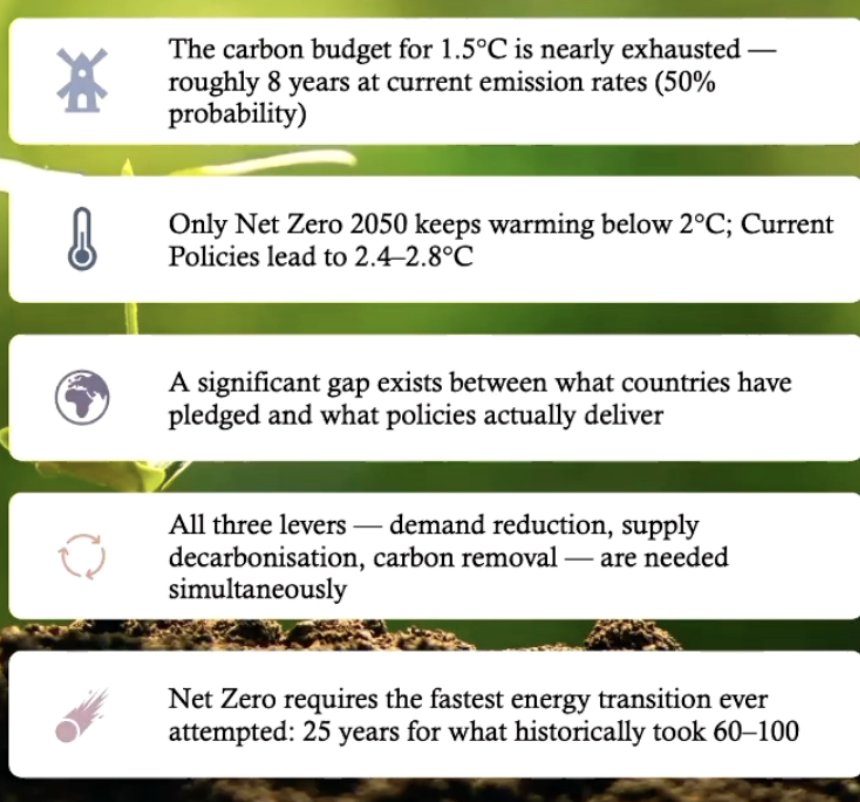
if we burned through all our remaining coal reserves → 3-12x remaining carbon budget for 1.5-2 degrees celsius
we’re not running out! we’re burning too much. we have enough resources discovered
but supply chains matter → geopolitical risks to accessing much of our reserves (hormuz, venezuela)
coal is growing → china and india using it to make steel for their industrial booms
types of coal power stations
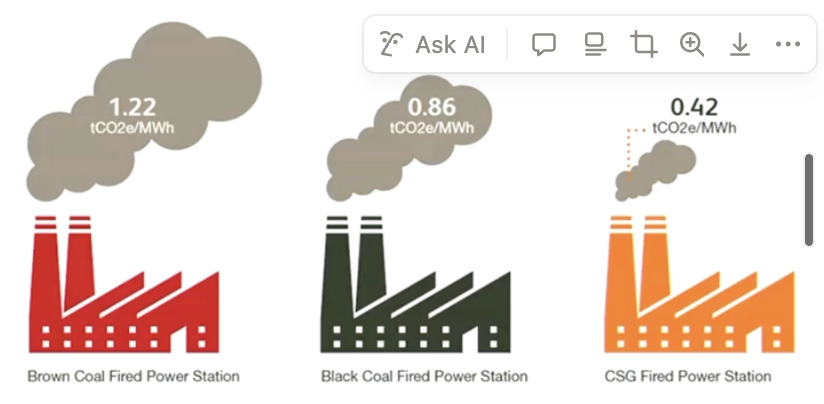
brown coal hasn’t been precooked → sits higher in the earth, contains more organic matter and hasn’t been squashed as much, black coal has already been heated and compressed a lot
CSG emits half as much co2 as black coal
global stats
the question of who is responsible depends entirely on your chosen metric → becomes an equity debate
China and india have been rising a bunch in co2 emissions
China is world’s largest co2 emitter
Australia has highest emissions per capita
USA has contributed most cumulative co2 since 1850
India, with 4x population of USA, emits half of USAs emissions
Australia accounts for ~1% of global emissions BUT also exports fossil fuels!
if remaining carbon budget were shared equally per person, Australia would need to cut emissions the most
COMPARING EMISSIONS PUNISHMENT APPROACHES
This approach divides the remaining carbon budget equally based on population size, providing every individual on Earth the same emissions allowance. → favourable to developing nations
historical: Places heavy responsibility on industrialized countries
Based on accountability—those who caused the problem should fix it.
current-emissions basis → limits growth for developing nations but focuses on efficiency and urgency—cut where emissions are highest now.
key policy drivers of australia’s energy transition
2001: mandatory renewable energy target (howard government)
2009: RET (renewables energy target) expansion, target raised to 20% renewables by 2020
2011: RET split for solar and wind
2012: carbon price of $23/t (gillard government)
2014: abbot repeals carbon price
2015: LRET cut to 33000 from 41000 GWh, large-scale wind and solar investment stalls
2017: hazelwood closes (victoria’s largest coal plant) abruptly, 5 months notice, price spike
2018: national energy guarantee abandoned
2019: LRET target met ahead of schedule
2023: NSW’s largest coal plant closes after years of notice
2022+: Albanese: 82% renewables by 2030
australia’s decline in coal use
reflects aging plant economics and corporate decisions as much as direct regulation
solar’s rise to 18% is largely due to the SRES (small scale renewable energy scheme) subsidy plus collapsing panel costs
state government took up federal government’s slack
private investment going up, subsidies by government
fossil fuels summary
the carbon budget and future scenarios
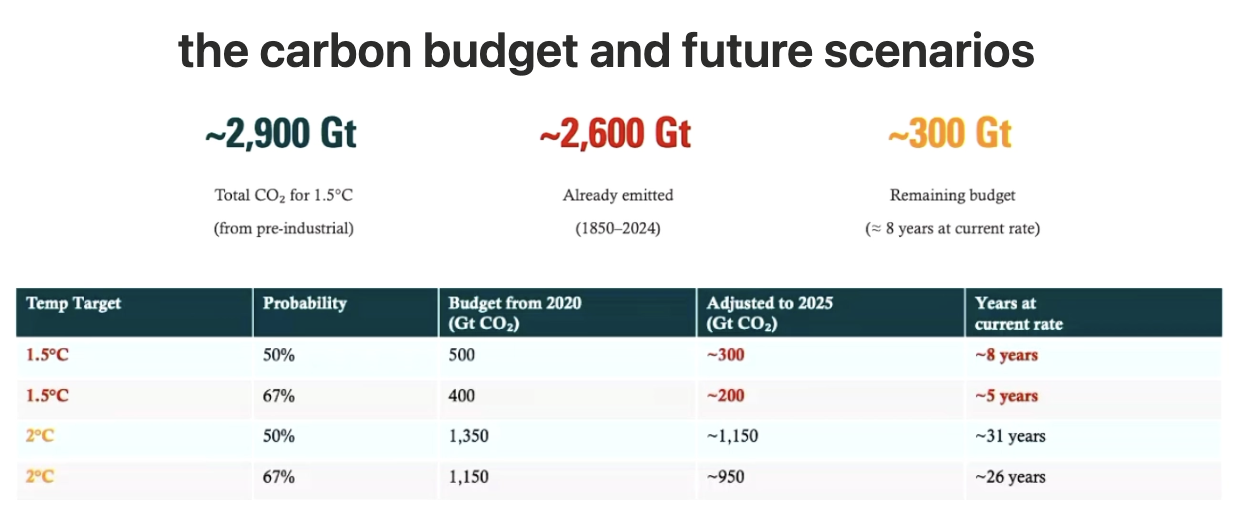
but 2 degrees is quite destructive
humidity increases because ocean temps increase
heat deaths
pacific islands underwater
vegetation is sensitive → coffee plantations in Brazil being moved up mountains
possible carbon futures:
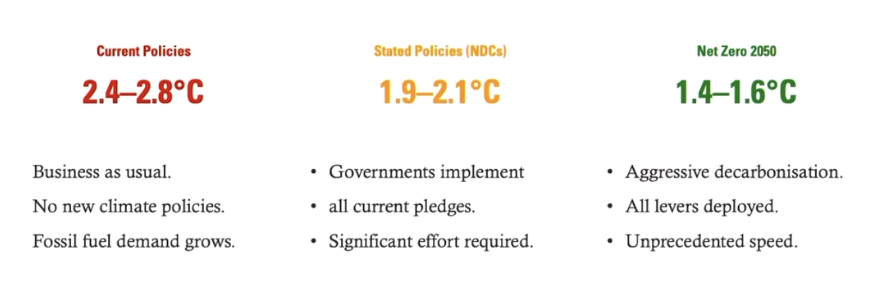
three levers for emission reduction:
reduce demand
energy efficiency
behaviour change
electrification
circular economy (minimising trade → aus is well-placed)
decarbonise supply
solar and wind
nuclear
green hydrogen (though some issues?)
grid storage
remove carbon
reforestation
direct air capture
enhanced weathering
spreading silica crystals on beaches to wash out to sea and absorb crystals
bioenergy with Carbon Capture and Storage
nuclear in europe
france is 17x cleaner than germany
german residents paid more than 44 euro cents per kilowatt hour compared to 33 euro cents
when germany shut 8 reactors immediately after fukushma, carbon intensity went back up 1022-2013
germany is much more reliant on imported gas (price spike after russia invading ukraine)
early nuclear reactor designs have a shelf life of like 40 years
nobody notices silent deaths caused by coal → life expectancy significantly affected by proximity to coal plants
arguments for nuclear
zero-emissions baseload
near-zero co2 and runs 24/7 (unlike solar and wind)
australia’s coal fleet which provides ~90% of current baseload is set to retire by 2037, big gap left
energy density and land use
do have to mine uranium tho
3000 GWh of generation per km2
62 GWh for solar
872 GWh for wind
we literally have the world’s largest uranium reserves (which we currently export)
AUKUS precedent
we are investing billions in nuclear-powered submarines, yet prohibits civilian nuclear
we could power them ourselves
coalition cost claim
the opposition modelled/argued a nuclear-inclusive plan would be ~44% cheaper than a renewables-only approach (heavily disputed)
arguments against nuclear
too expenny
1.5-2x more than renewables according to CSIRO’s GenCost 24-25
too slow
at least 15 years away
no regulatory framework
no trained workforce
no development pipeline
nuclear could not be expected to produce electricity well after all coal plants are expected to retire
Small-Module-Reactors (SMRs) are unproben comercially
only 3 operational SMRs globally, all in russia and china
no OECD-country SMR comercially has been completed
cost overruns are the norm
the uk’s hinkley point c is costing 3x more than promised (~90 billion) and is running 14 years late
renewables already winning
renewables continue to fall in cost
the cost of electricity from nuclear by 2040 would be more than for solar and wind
the nuclear option in australia
core tension: timing vs. long-run reliability
strongest argument: grid stability once renewables dominate
weakest point: cannot arrive before the problem it’s meant to solve
carbon budget and scenarios summary
calculating emissions
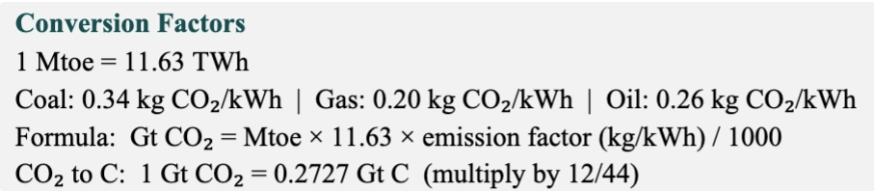
Mtoe x 11.63 x emission factor converted to Gt (/1000)
see examples in notion
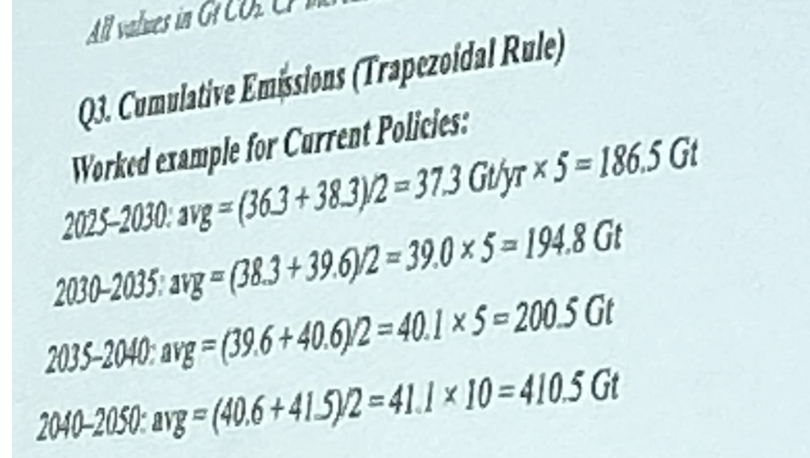
trapezoidal rule.
calculate the cumulative emissions
average of the start and end of the period → amount released/year
multiply by number of years
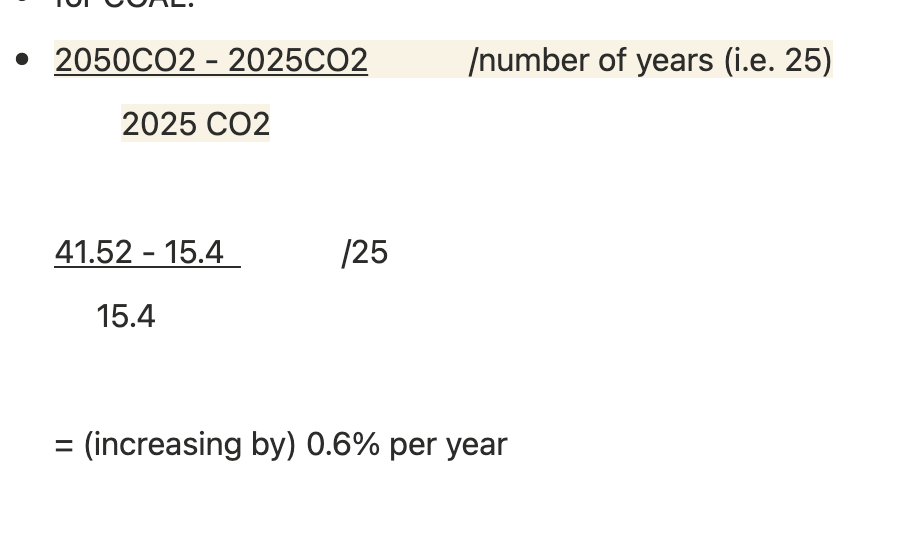
For each scenario, calculate the required annual rate of emission reduction (% per year from the 2025 baseline) needed to reach its 2050 level. (suggests you don’t need to do increments)
groundwater use and recharge image
5 features
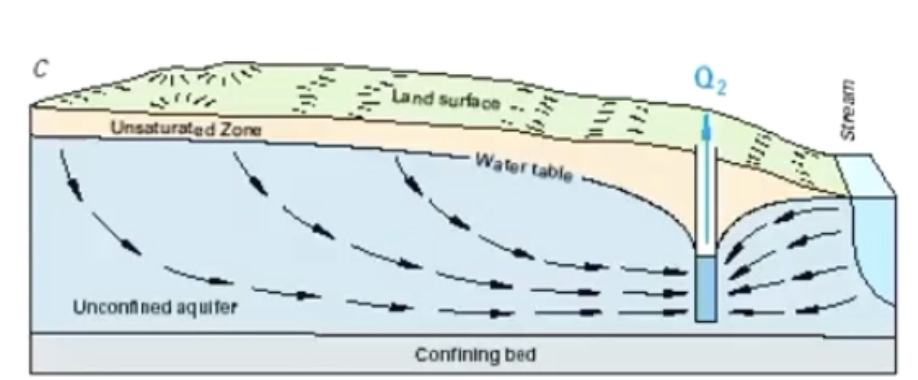
groundwater flow in confined and unconfined porous aquifers
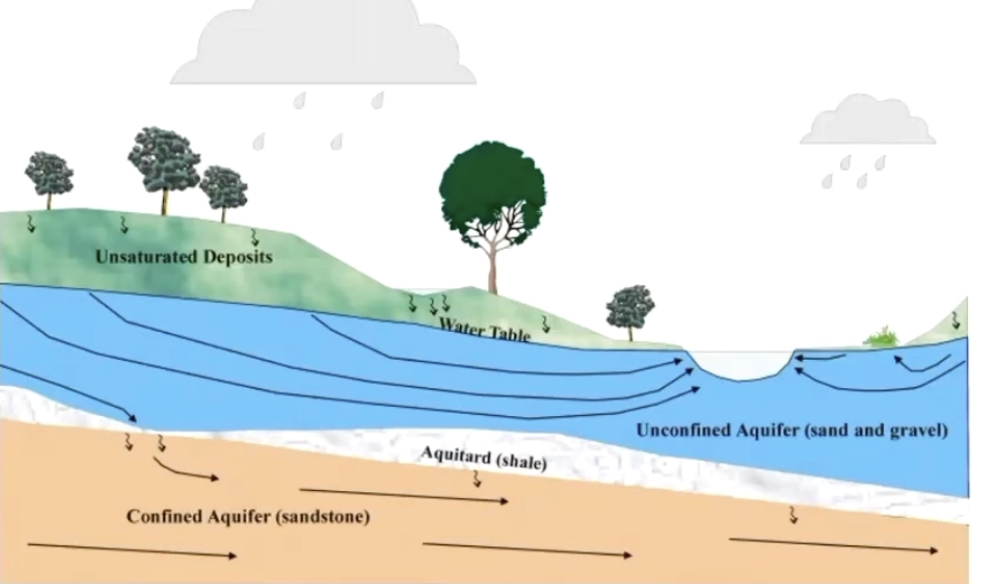
aquifer
porosity
permeability
a medium of rock that water flows through
efficient → permeable and porous rocks
basalt = porus but not permeable, not effective
water enters and recharges the unconfined aquifer, enters and recharges the river through arrows around divoty thing
Porosity is the amount of empty space (pores) in a material, defining its capacity to store fluid. Permeability is how easily fluids flow through those connected spaces,
potentiometric surface and flowing wells
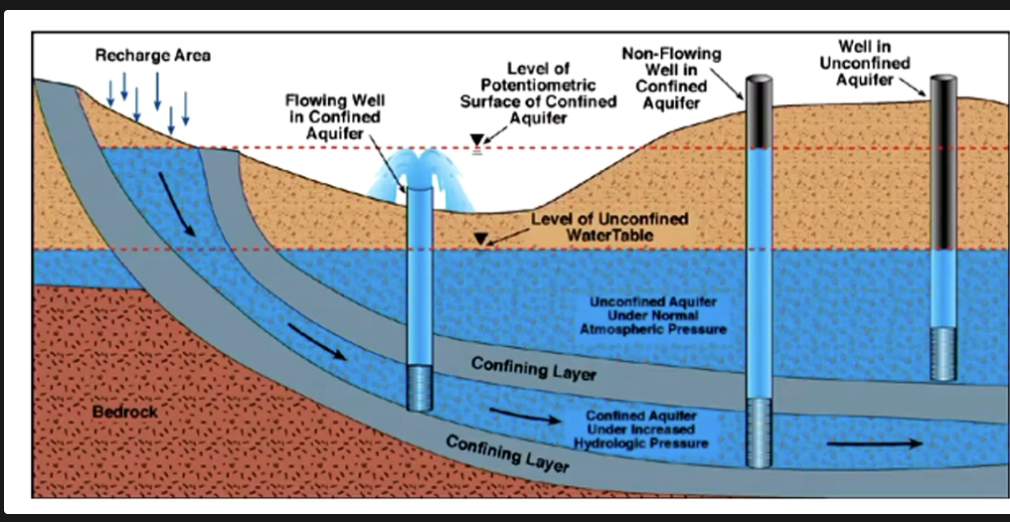
recharge area, 2 confined aquifers, and 3 wells
heights correspond to water pressure inside the well
if well only intersects with unconfined aquifer, then height of water will be same as water table
if well intersects confined aquifer, hydrostatic pressure can be much greater and therefore water level can be much higher → at potentiomentric surface
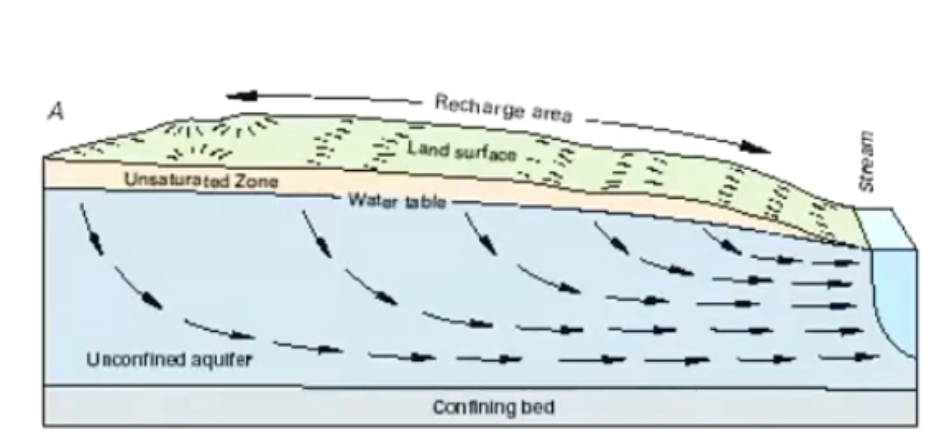
undisturbed groundwater flow
minor water extraction
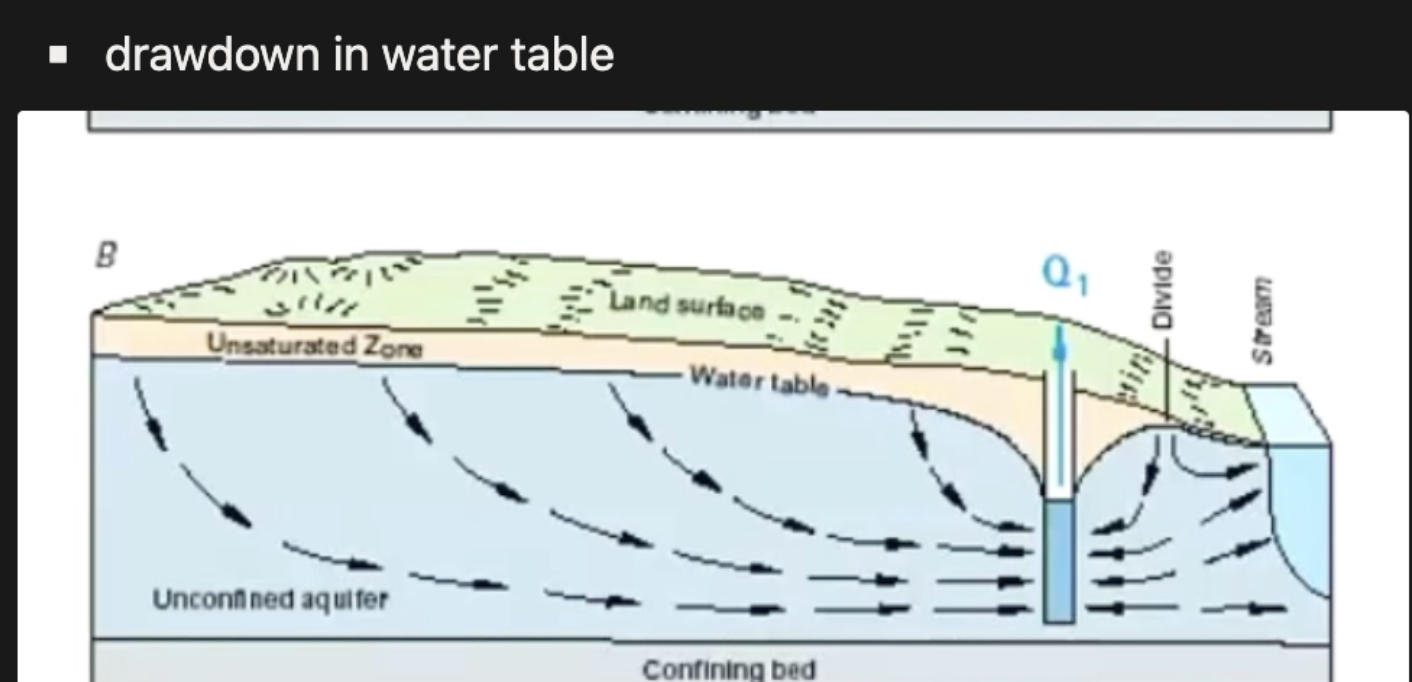
major water extraction
breville liquid descaler example
unconfined aquifer = squeezing a bottle with the lid off vs. confined = squeezing a bottle with the lid on, how water rises
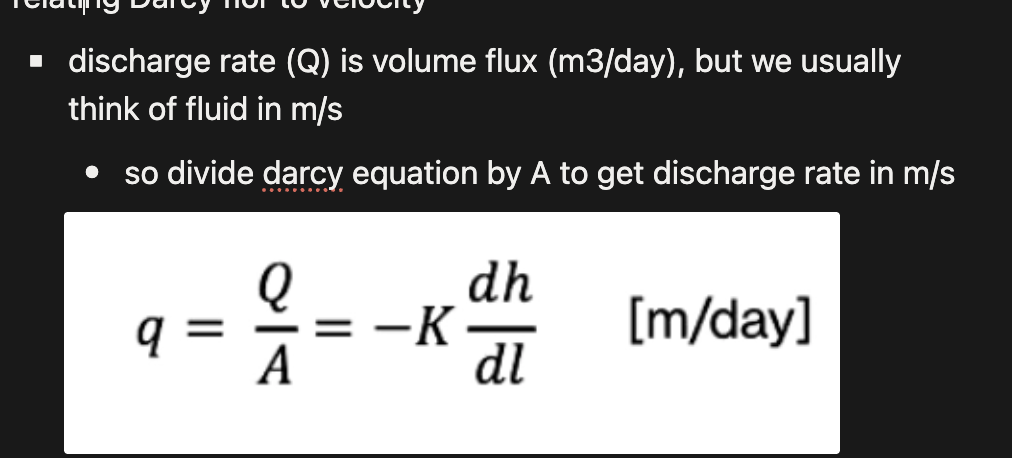
Darcy’s law
how to quantify groundwater flow
rate of water flow through a tube = Q
proportional to:
the difference in height of the water between the two ends of the tube
is inversely proportional to the length of the tube
a coefficient K, hydraulic conductivity
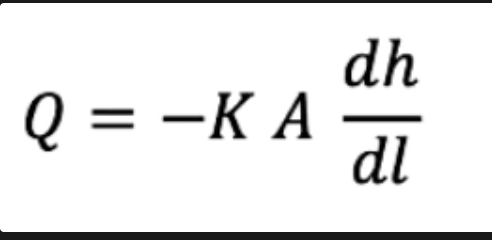
Q = volume of water flow in m3/day
K = hydraulic conductivity in m/day
A = cross-sectional area in m2
dh/hl = hydraulic gradient
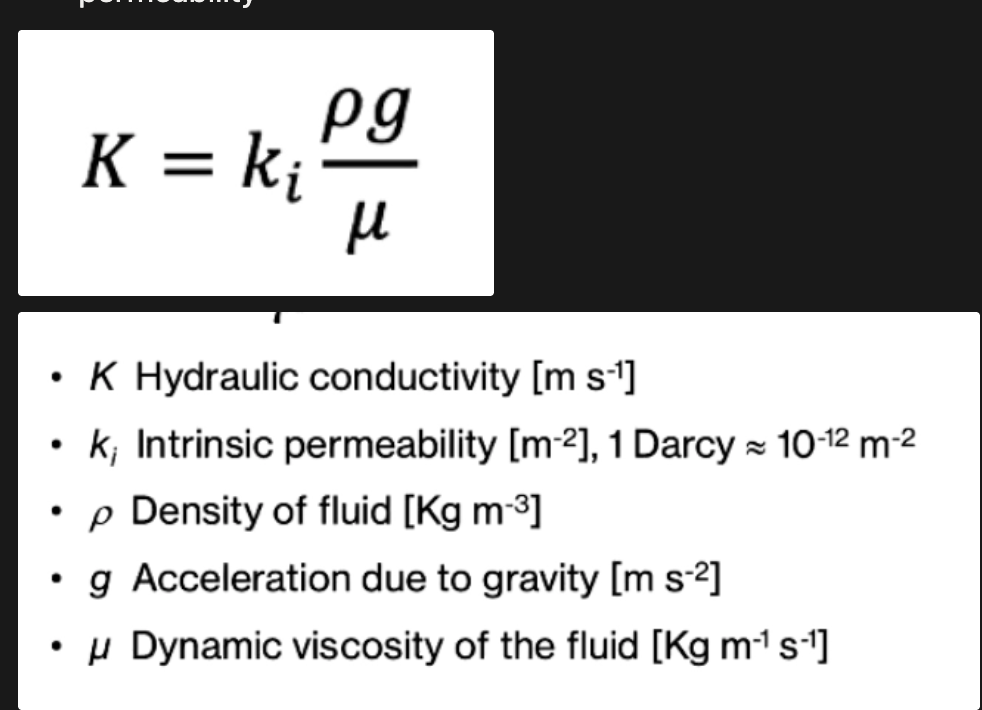
relating hydraulic conductivity to permeability
you can get hydraulic conductivity from permeability
the capability of a rock to allow the passage of fluids
dependent on the size of the pore spaces and to what degree they are connected
grain shape, grain packing, and cementation affect permeability
relating Darcy flow to velocity