pubhlth 222a: week 7 - health care delivery
1/35
There's no tags or description
Looks like no tags are added yet.
Name | Mastery | Learn | Test | Matching | Spaced | Call with Kai |
|---|
No analytics yet
Send a link to your students to track their progress
36 Terms
hospital data & trends
Hospital care accounts for $1.5 trillion
1/3 of National Health Expenditures
among private hospitals…
71% are non-profit
national hospital care expenditures
1/3 - hospitals
1/5 - physicians & clinics
1/4 - other health
year-over-year growth spending on healthcare (2016-2024)
mostly + growth spending on care since there's only are facing downward in 2020 & 2022
solutions to hospital spending growth reaching 2 digits in 2023-early 2024
hospital operating margins
policy focus on reducing healthcare & hospital spending
KFF analysis of RAND Hospital data examines
margins ((revenues – expenses)/revenues)
operating margins vs. total margins: focus on patient care/operating activities
non-federal general short-term hospitals
short-term hospital operating margin KFF graph
drops in 2020 & 2022
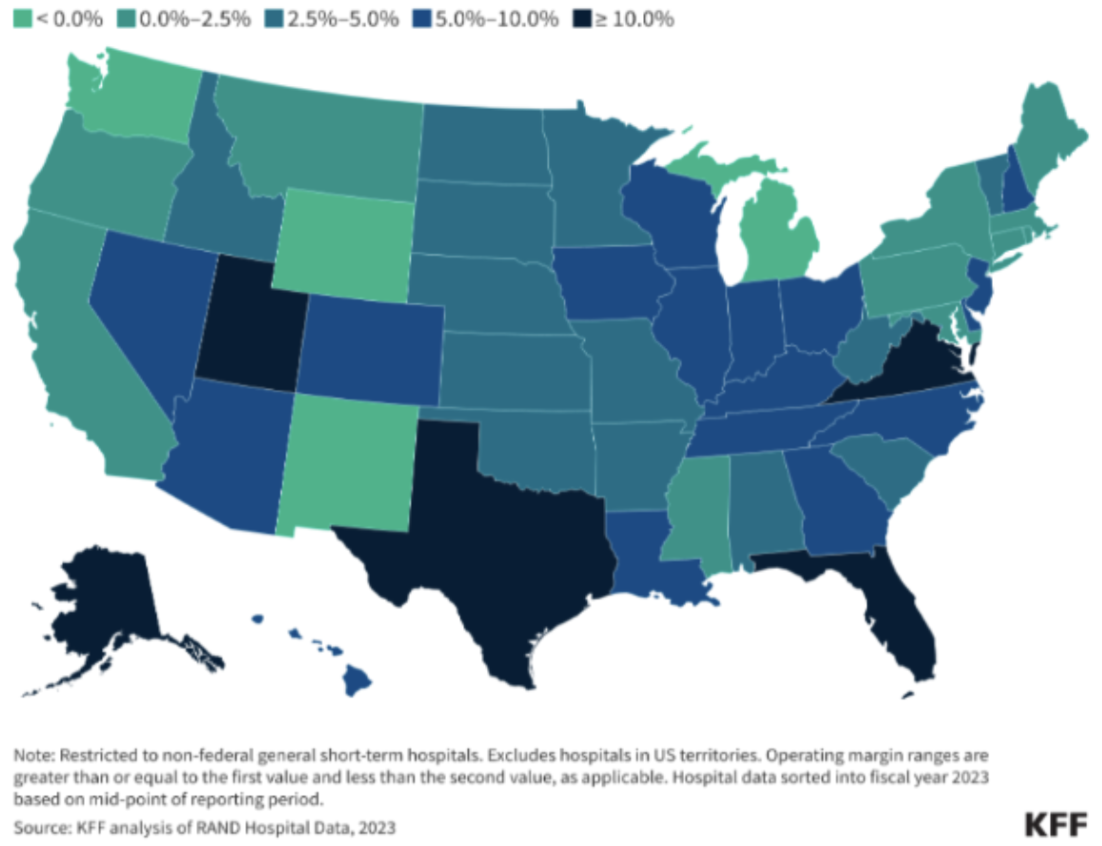
hospital operating margins in 2023
operating margins
for-profit hospitals w/ high commercial discharge shares, & system-affiliated hospitals operating margins were higher than avg.
hospitals w/ low market shares operating margins were lower than avg.
rural hospital operating margins were lower than avg.
operating margins varied across states, 2023 map
hospital utilization 2000-2023 KFF
hospital inpatient utilization has decreased
hospital outpatient utilization has increased
hospital market is highly concentrated & increasingly consolidated
concentrated —> there are few large hospitals
trends in US have been toward higher market concentration as hospital & physician org mergers become more common
by 2016, 90% of all metropolitan areas had highly concentrated hospital markets
“As Hospitals Grow, So Does Your Bill,” Wall Street Journal, June 6, 2024
consolidation across the hospital has contributed to the higher cost of healthcare
“Corporate Giants Buy Up Primary Care Practices at Rapid Pace”, NYT, 2023
large health insurers & other companies are interested in doctors’ groups that care for patients in private medicare plans
1 or 2 health systems controlled the entire market for inpatient hospital care in nearly half of metropolitan areas in 2022
1 healthcare system controls a given share for more than 25% of the market
health system in the west vs east
dense 1-3 health system is more common in the east
sparse 3-4+ health system is more common in west & middle
share of hospitals & physicians affiliated w/ health systems
increasing share of hospitals are affiliated w/ health systems
share of hospitals affiliated w/ health systems increased from 56% in 2010 to 67% in 2022, w/ the share growing in both rural & nonrural areas
increasing share of physicians are affiliated w/ hospitals or health systems
traditional care
illness
acute care
inpatient
individual health
fragmented care
independent institution
service duplication
patient-centered care
wellness
primary care
outpatient
community well-being
managed care
integrated settings
continuum of services
payment models
fee-for-service
capitation (per member, per month fee for each enrollee assigned to provider)
global budget (budget covered by payer)
facility costs vs. professional services (hospitals & doctors are paid separately, typically w/o coordination)
attempt to align incentives in the system
higher cost → volume-driven healthcare
changes in healthcare use associated w/ the intro of hospital global budgets in maryland
matched 8 maryland counties w/ hospitals in the program (94,967 beneficiaries)
assuming parallel trends, we estimated a differential change in maryland
associations of maryland global budget revenue w/ spending & outcomes related to surgical care for medicare beneficiaries w/ cancer
medicare beneficiaries undergoing cancer surgery in control states had a statistically significant reduction
hospital payment under medicare
since october 1983, medicare has paid for inpatient care according to the hospital inpatient prospective payment system (PPS)
hospital receives a fixed payment based on the patient’s Diagnosis-Related groups (DRG), regardless of the cost of treatment
incentives limit to length of stay & resource utilization
created volume-driven healthcare
hospital reimbursement outside of medicare
varies by insurer & negotiating entities
DRGs are often used, but the medicare fee schedule may not be used
per diem is used especially in commercial contracts. medicaid programs have tried to shift from per diem to DRG
bundling has become increasingly popular
reimbursement for Outpatient Care
Professional Fees
How are they determined?
Fee-for-Service Fee Schedules (like Medicare)
Encounter/Visit Based Fees
Capitation for a set of services
Facility Fees can still apply
In Ambulatory Surgery Centers, for example
Scope of Practice Laws
Determined by state law (dictate what NPs, PAs can do)
2012-2013 veterans affairs data
cohort of medically complex patients w/ diabetes to compare health services use & costs depending on whether the primary care provider was a physician, NP, or PA
case-mix-adjusted total care costs were 6-7 percent lower for NP & PA patients than for physicians' patients, driven by more use of emergency & inpatient services by the latter
NP State Practice Environment, 2023 (AANP)
full —> very northeast & midwest
reduced —> northeast & southeast
restricted —> ca, tx, & southeast
physician Associate State Practice Environment, 2025 (AAPA)
reduced —> southeast
moderate —> ca, tx, east midish
advanced —> “w” us states
optimal —> northwest
nurse practitioner scope of practice & the prevention of foot complications in rural diabetes patients
expanding np practice authority may be effective solution for preventing complications from diabetic foot ulcers in rural communities
what are the trade-offs b/w more stringent & more flexible scope of practice laws?
pros
increase supply of care in underserved areas
shorter wait times
optimize workforce
cons
over-prescribing
fragmentations if mid-level providers don’t coordinate w/ specialists
accountable care orgs (ACO)
provider-led orgs w/ a mission to manage the full continuum of care & be accountable for overall costs & quality of care
physicians & hospitals at shared financial risk w/ the payer for a global budgetary target for a defined patient population
overall, ACOs reduce costs w/o reducing care quality
growth of accountable care orgs (ACO)
positive growth
medicare shared savings program ACO
allows providers to form accountable care entities w/ goal of delivering high quality care while reducing medicare costs
voluntary
different participation options (tracks)
promotes accountability for a patient pop
max 75% risk sharing
realizing equity, access, & community health (REACH) ACO
Advanced ACO model launched by Biden administration in 2023
First to offer a global risk track (100%)
Waiver flexibilities related to SNF admissions, home visits, & telehealth
Includes track dedicated to high-needs Medicare beneficiaries (e.g., one or more chronic conditions that impact mobility, unplanned hospital admissions)
REACH ACO – High Needs ACOs (HNACOs)
When examining performance in 2023, HNACOs performed better than other REACH ACOs, representing the top 5 performers
disparities in telemedicine:
age
limited english proficiency
rurality
income
telehealth
increased since covid & simultaneously decreased ED visits
In 2024, 71.4% of physicians reported using telehealth in their practices weekly,
79% who reported doing so in 2020
25.1% who reported doing so in 2018
Among psychiatrists, 85.9% reported having used telehealth in the previous week