Exam Technique pointers
1/19
There's no tags or description
Looks like no tags are added yet.
Name | Mastery | Learn | Test | Matching | Spaced | Call with Kai |
|---|
No analytics yet
Send a link to your students to track their progress
20 Terms
Describing evidence from a figure / Use information from a figure to suggest / explain why…
USE the figure / USE the figure then explain using connectives
Interpreting / describing line graphs
general trend - make sure you state the two variables
does the increase / decrease rate change? If so, state the x-axis variable at which the y-axis variables remains the same / slows (i.e. where the trend begins / ends if obvious)
if there are two groups (key), is the relationship the same for both and do they have the same range/ mode? If there are error bars, differences are only significant if error bars do not overlap
be careful if the y-axis is a rate. For example, levelling off does not mean that the process has stopped
Interpreting / describing bar charts:
standard deviations / error bars; overlap suggests differences are not significant and due to chance. Non-overlapping error bars suggests a significant difference but don’t forget to state what the difference actually is (i.e. which is larger / higher)
if there are two categories (key): are the ranges the same for both? Where do the ranges overlap? Are the ranges the same for both? What are the modes for both? What is the most obvious difference?
Describing data in tables:
general trend; increase / decrease
check table headings and units carefully
Describing a method. Remember to include:
how variables should be controlled / monitored (i.e. instead of control the temperature, say ‘use a thermostatically controlled water bath to control the temperature. Measure the temperature of the water bath at 5 minute intervals using a thermometer and use corrective measures if temperature fluctuates’)
which measurements taken. How and when. (i.e. instead of record the mass, say ‘use a precise mass balance to record the mass at 5 minute intervals’ )
replicates? Processing of data? Sometimes it is appropriate to describe the calculation in full (e.g for mark release capture)
Describing the use of a calibration curve (RP3)
make solutions of known concentration of named substance (e.g. produce a serial dilution of glucose solutions of known concentrations using a stock glucose 1 molar solution… add set volume of Benedict’s solution to set volume of glucose solution)
measure absorbance using colorimeter of each concentration
plot graph of colorimeter reading on y axis and concentration on x axis and draw calibration curve
find concentration of unknown concentration of sample solution from calibration curve using absorbance reading of sample and interpolating
Describing a serial dilution (dilution series)
add 1 part stock solution to 9 parts distilled water
mix
repeat using 1 part of diluted stock solution and 9 parts distilled water
Describe how you would produce X cm3 of solution of X concentration using distilled water and X molar stock solution
find dilution factor by dividing desired concentration by concentration of stock solution
multiply dilution factor by desired volume of solution to find volume of stock solution that should be used
subtract this volume from volume of desired solution to find volume of distilled water that should be used
Do the results support a conclusion? Evaluate this statement using data.
Give reasons for and against, these are usually separated in the mark scheme.
Things to think about:
do any, only some, or all of the data points support the conclusion? Is the correlation weak or strong? Is there a little or large effect? Are there exceptions? Is there a change in control? Quote data evidence when appropriate (especially where trends / patterns change)
any differences significant - do error bars or SDs overlap? Is there actually any information to suggest whether a difference is significant? Does a statistical test need to be carried out? N.B always name what type of statistical test needs to be carried out e.g. students t test for difference between (means), spearman’s rank for correlation/relationship, chi-squared for goodness of fit / different between expected and observed frequencies etc
do smaller intervals of the independent variable need to be tested (e.g. if trying to find the optimum temperature for enzyme activity of a specific enzyme / solute concentration of a tissue sample)? Does each value need to be replicated to get a more accurate estimate (not relevant if mean is provided)? Is the sample small? Is the duration of the study short? Could another factor explain the results? Was it done on a different or just one species/ organism / cell etc?
is there data supporting all the parts of the statement / conclusion?
if a scientist has conducted the investigation (rather than a student) it is more likely that it has been correctly completed with replicates and control variables so avoid sweeping statements such as ‘more repeats’ or ‘another factor involved’
Most important tip is to take the statement or conclusion that has been made and pull apart anything in there that hasn't been shown by the experiment and anything that has been generalised from the experiment e.g. experiment on isolated enzymes in cotton plant, conclusion says ‘plant species' as whole organism → two things that have not been shown (1. isolated enzymes does not translate to whole organism 2. cotton plant does not translate to all plant species) etc
Naming control variables:
make sure you are clear as to what you’re referring to
e.g. pH / temperature of the named solution / soil (NOT just temperature / pH)
light intensity NOT just light
concentration of minerals in soil NOT just minerals
make sure the control variables you use are not included in the question stem
never use the words amount or level ; instead use mass / volume / concentration / number of
never use the word ‘nutrient’ as a replacement for mineral
question might be constraining choice (e.g. environmental variables; variables using in filter paper dics)
What do control variables ensure?
results are comparable
BUT if asked to explain the use of a specific control variable, consider how results might be affected if not controlled e.g. this shows that only X has an effect on Y and not Z
answers such as ‘to allow comparison’ or ‘for a fair test’ are usually insufficient
How do you monitor variables?
regular readings should be taken with named equipment (e.g. thermometer)
if you are naming control variables as part of describing method, you must describe HOW the variable will be controlled
always be careful in case you also need to take measurement with time e.g. concentration of oxygen at regular time intervals using probe and stop clock
Use of a control:
used as a baseline to compare / see the effects of a named treatment / independent variable
control result could be subtracted from the others
Specific Maths and data skills:
most calculations have multiple steps. One early mistake will only cost you one mark if you SHOW YOUR WORKING
don’t forget to include units. Do NOT USE A SOLIDUS (/) for units. Use per or -1 etc
some questions explicitly ask for answers in standard form. Check table headings and graph axes for sneaky use of standard form
to give an appropriate number of significant figures, use the original data as a guide
be comfortable converting between units. This allows measurement of small quantities and avoids unnecessary use of standard form. Remember to take measurements from diagrams in mm; microbiologists never use cm. Be comfortable calculating diameters / radii from areas.
drawing line graphs - axes correct way around, units (could include standard form which should not be on each axis but on axes label), linear scale, ruled lines joining points with no extrapolation (point to point always accepted even why graph requests a suitable curve to be drawn)
make sure you can draw a tangent to a curve to determine the rate of reaction
when describing a dilution to make a named volume / concentration of a solution state how much of the stock solution and distilled water is required
standard deviations / error bars are there for a reason; overlap suggest differences are not significant and are due to chance. Non-overlapping error bars suggests a significant difference but don’t forget to state what the difference actually is (e.g. which is larger/ higher). Their absence may be of note if you are evaluating data.
when calculating ratios they should always be calculated as something to 1 (e.g. 1.4 to 1). DO NOT LEAVE AS A FRACTION
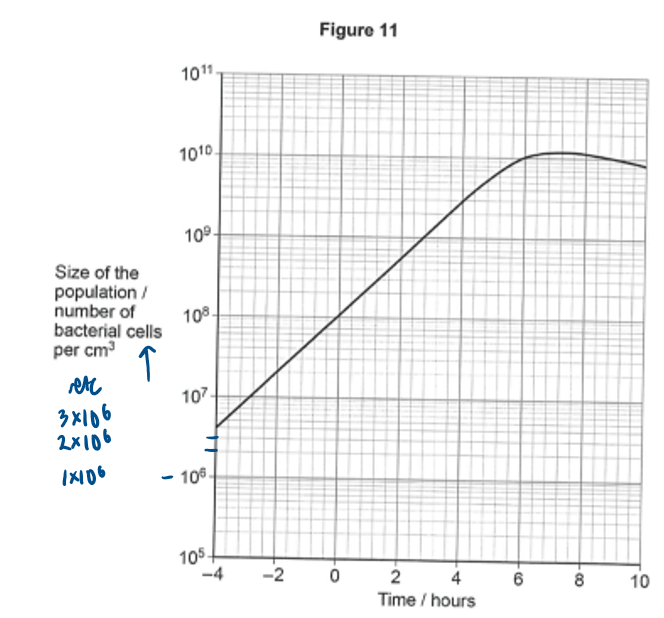
be comfortable with interpreting and converting log scales on graphs (and watch out for them). Log scales are useful when recording large range /increase / difference in a variable
calculating percentage decrease / increase is a very common question → (reference/healthy/control - value)/reference/healthy/control x 100
you need to be able to calculate percentage error (uncertainty) from given uncertainties
remember that measurement uncertainty of length when taken with ruler has already had x2 accounted for (but when doing percentage error using measurement uncertainty of ruler you must multiply by 2 as taking two readings per measurement and then x100)
assume uncertainty if not given is +-1 in the last significant digit (e.g. ‘a person secreted 1660mg of creatinine in 24 hours’ → uncertainty would be +-10mg of creatanine)
uncertainties should be added together if you have more than one uncertainty
if measurements are repeated, uncertainty can be found by finding half the range of the measured values
calculating the number of cells in an undiluted culture can be tricky; remember to check both the dilution factor and the volume of the distilled culture used. Each colony after incubation represents one cell in original inoculum
Log scales:
T-test
compare difference between 2 means
difference is significant not results
difference is significant if p value is less than 0.05
less than 0.05 probability that the observed difference is due to chance and any null hypothesis can be rejected
if asked to give a conclusion, don’t forget to state the relevance of the difference
ENSURE YOU MAKE FINAL CONCLUDING STATEMENT i.e. therefore there is a significant difference between X and X
Chi-squared
compares difference between the observed and expected values
difference is significant if the p value is less than 0.05 (or calculated value is greater than critical value)
less than 0.05 probability that the observed difference is due to chance and any null hypothesis can be rejected
if asked to give a conclusion, don’t forget to state the relevance of the difference
ENSURE YOU MAKE FINAL CONCLUDING STATEMENT i.e. therefore there is a significant difference between observed and expected X in X
How is the reliability / accuracy (of a mean) increased?
repeat readings / large sample size (representative) / random / no bias / (obvious control variables)
Means allow comparison ( to see the effect of the independent variable) and take into account anomalous results. Do NOT DISCARD ANOMALIES AS COULD BE IMPORTANT (e.g. important to note that one patient of of X many experience a severe side effect to a drug etc; despite being anomalous, it is significant!!!!
How can you improve the repeatability of an investigation/ results / data?
Achieved through replicates (NOT repeats). Replicates can increase the accuracy of the mean.
Replicates are identical but separate experimental runs performed at the same factor settings.
Repeats are multiple measurements taken within the same experimental run (or consecutive runs without resetting conditions).
Scientific drawings:
no sketching, hanging lines, crossing lines or shading
scale given (even if not asked for in question) or magnification
labels (ensure label lines don’t cross)
(when suggesting improvements marks are not awarded for suggesting the use of a sharper pencil or the inclusion of more detail)