Corporate Finance
0.0(0)
Studied by 3 people Call Kai
 Learn
Learn Practice Test
 Spaced Repetition
 Match
Match Flashcards
 Knowt Play
Card Sorting
1/196

Earn XP
Last updated 6:55 PM on 1/29/23
Name | Mastery | Learn | Test | Matching | Spaced | Call with Kai | Chat |
|---|
No analytics yet
Send a link to your students to track their progress
197 Terms
1
New cards
__seasoned equity offering__
any issuance of shares that follows IPO on stock market
2
New cards
__Pros of IPO__
1. Source of financing:
2. Strategic advantages: (publicity for company, facilitates M&A activity, management compensation using stock options)
3
New cards
Costs of IPO
1. Transparency
2. Direct costs of IPO
3. Agency problems
4
New cards
Underwriter:
firm that buys an issue of securities from a company and resells it to the public
5
New cards
Underwriting Arrangements:
1. Firm commitment: underwriters buy securities from firm and resell them to the public
2. Best Efforts Commitment: Underwriters agree to sell as much of the issue as possible but do not guarantee the same of the entire issue
3. Flotation Costs: costs incurred when a firm issues new securities to the public
6
New cards
__Spread:__
difference between public offer price and price paid by underwriter
7
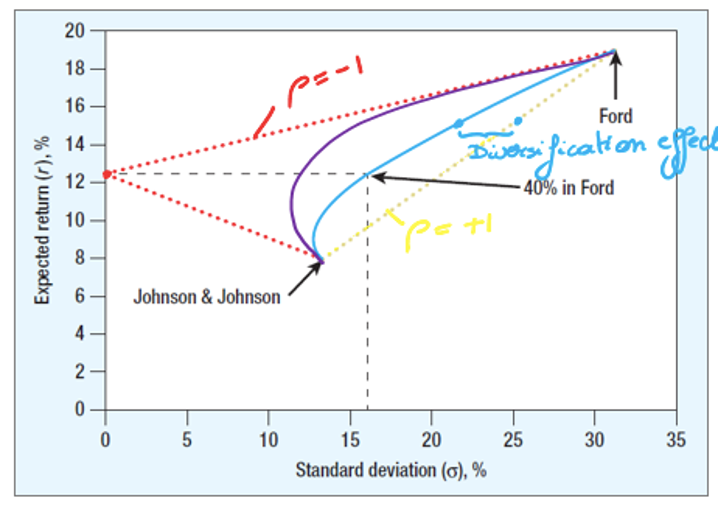
New cards
PV (dividends)
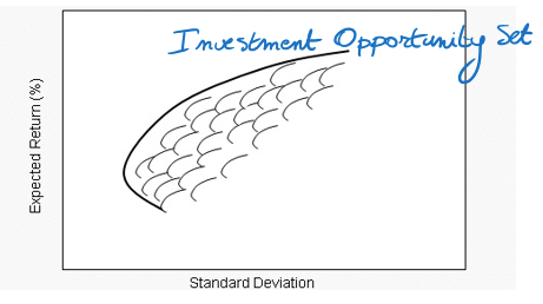
market value of equity
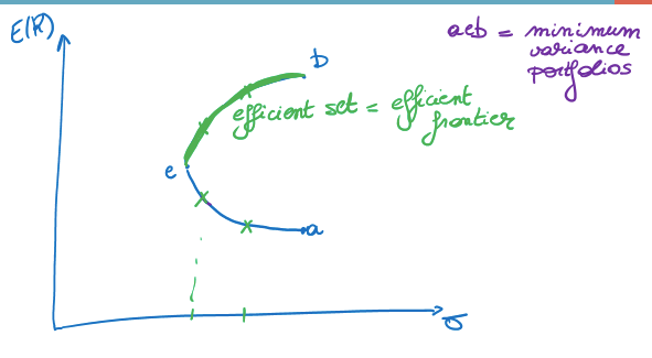
8
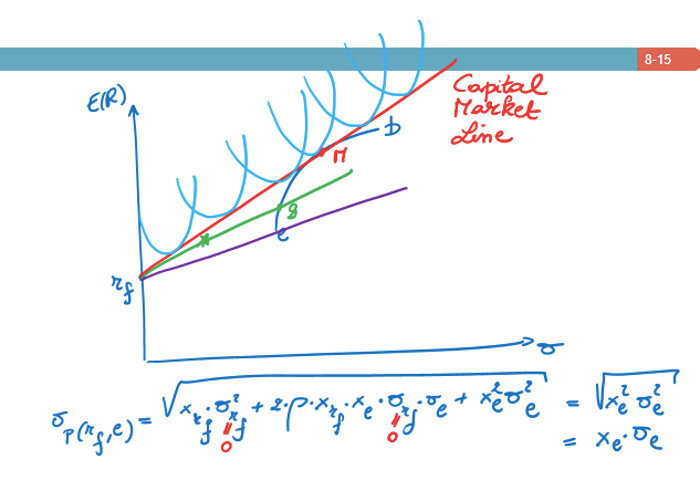
New cards
Free Cash Flows (FCFF)
Market value of firm = equity + debt
9
New cards
__Cost of capital (COC):__
a company’s calculation of the minimum return that would be necessary in order to justify undertaking a capital budgeting project
= how much a company would need in order to justify purchasing new equipment/building/etc
- based on average beta of assets
= how much a company would need in order to justify purchasing new equipment/building/etc
- based on average beta of assets
10
New cards
Random walk:
the movement of stock prices from day to day to not reflect any pattern
* generally speaking, they are skewed positive over the long term
* generally speaking, they are skewed positive over the long term
11
New cards
Efficient Market Hypothesis (EMH)
\
\
theorizes that the market is generally efficient.
* the market cannot be beaten because it incorporates all important info instead current share prices, so stocks are generally traded at fairest value
* the market cannot be beaten because it incorporates all important info instead current share prices, so stocks are generally traded at fairest value
12
New cards
Weak form (in)efficiency:
\
\
ie random walk theory - stock prices reflect all historical information, no form of technical analysis can aid investors
current prices are not effected by past events
current prices are not effected by past events
13
New cards
Semi-strong form (in)efficiency:
\
\
market prices reflect all publicly available information
public information is part of the stock’s current price, investors cannot utilize either technical or fundamental analysis to benefit themselves, HOWEVER they may benefit from information not available to the general public
public information is part of the stock’s current price, investors cannot utilize either technical or fundamental analysis to benefit themselves, HOWEVER they may benefit from information not available to the general public
14
New cards
Strong form (in)efficiency:
all information, public and not public, is completely accounted for in current stock prices and no type of information an give an investor an advantage on the market
* market is effected by past events of the market history and not just random occurrences
* market is effected by past events of the market history and not just random occurrences
15
New cards
Evidence for Efficient Market:
\
\
financial investors do not consistently beat the market
16
New cards
\
Anchoring:
\
Anchoring:
\
cognitive bias that causes us to rely too heavily on the first piece on information we are given about a topic
17
New cards
__Internal rate of return (IRR):__
\
\
= the percentage that makes your NPV = 0
= graphically if the discount rate was zero
\- Use as long as the signs are always positive, otherwise the measurement is too complicated
= graphically if the discount rate was zero
\- Use as long as the signs are always positive, otherwise the measurement is too complicated
18
New cards
Pitfalls of Internal Rate of Return:
\
\
1. Does not distinguish between lending or borrowing
2. Multiple rates of return, meaning as many solutions as there are in sign changes
3. Mutually exclusive projects: IRR sometimes ignores the magnitude of project
4. More than one opportunity cost of capital
5. Assume constant state of return (not consistent with that you expect from yield curve/term structure as they usually have an upward sloping curve)
19
New cards
PI (Profitability index)
* tool for selecting between project combinations and alternatives
* set of limited resources and projects can yield various combinations
* highest weighted average PI indicates optimal project
* set of limited resources and projects can yield various combinations
* highest weighted average PI indicates optimal project
20
New cards
__Weighted average profitability index (WAPI):__
\
\
calculates potential profit to help evaluate whether to proceed with a project
A variation of NPV, but differs as because it is a ratio, it provides no indication of the size of the actual cash flow
A variation of NPV, but differs as because it is a ratio, it provides no indication of the size of the actual cash flow
21
New cards
__Capital rationing:__
limit set on amount of funds available for investment
22
New cards
__Soft rationing:__
imposed by management
23
New cards
__Hard rationing:__
imposed by unavailability of funds in capital market
24
New cards
__Nominal rate of return:__
real interest rate without taking into account taxes and inflation
25
New cards
__Real rate of return:__
actual return, taking into account taxes and inflation
26
New cards
__Acellerated Depreciation__ leads to creation of…
tax shield = t\*depreciation
27
New cards
tax shield = t\*depreciation
= reduction In taxable income achieved through claiming allowable deductions such as donations, amortization, depreciation, etc.
= tax advantage of having depreciation
= tax advantage of having depreciation
28
New cards
__Equivalent Annual Cash flow (EAC):__
the cash flow per period with the same present value as the actual cash flow as the project
\
Use when you are comparing two projects that have different amounts of times to determine which one is more profitable (ie one is 5 years and the other is 7 years_
\
Use when you are comparing two projects that have different amounts of times to determine which one is more profitable (ie one is 5 years and the other is 7 years_
29
New cards
Risk premium:
premium, the higher the risk, the higher rate of return you can expect to earn from stocks
aka equity risk
aka equity risk
30
New cards
Equity premium (EP):
difference between returns on equity/individual stock and the risk-free rate of return,
31
New cards
Maturity premium:
compensates investors for the risk that bonds that mature many years into the future, to compensate investors for taking on more risk
* expected rates of return on longer term securities that are typically higher than rates on shorter term securities
* expected rates of return on longer term securities that are typically higher than rates on shorter term securities
32
New cards
Risk free rate (Rf):
* can be benchmarked to longer term government bonds, assuming there is zero default risk by the government
33
New cards
Market risk premium (MRP):
* the difference between the expected return on a market portfolio and the risk free
* different than market risk premium as it refers to additional return that you make on investments that are not risk free
* a higher premium implies you would invest a greater share of your portfolio into stocks
* different than market risk premium as it refers to additional return that you make on investments that are not risk free
* a higher premium implies you would invest a greater share of your portfolio into stocks
34
New cards
Variance:
measure that reflect variability in a distribution, how far the data values are dispersed from the mean = average squared deviations from the mean
35
New cards
Standard deviation:
\
\
\
\
measure that reflect variability in a distribution, square root of variance
36
New cards
Covariance:
describes the relationship of two variables whenever one variable changes
* positive covariance: both variables tend to be high or low at the same time
* negative covariance: one variable tend to be high, when the other one is low and vice versa
* positive covariance: both variables tend to be high or low at the same time
* negative covariance: one variable tend to be high, when the other one is low and vice versa
37
New cards
Correlation:
tells us the extent to which two variables are linearly related
* always between -1 and 1
* always between -1 and 1
38
New cards
Diversification effect:
by spreading your investment across different assets, the lower your risk/volatility.
* once you diversify to a certain point, you cannot decrease it anymore however it will not be risk free as there will always be market risk
* once you diversify to a certain point, you cannot decrease it anymore however it will not be risk free as there will always be market risk
39
New cards
Unique risk:
\
\
* specific company risk that can be eliminated through diversification eg. labour strikes, patent decisions, new competitors, etc.
* unlike market risk, unique risk is in your control to a degree and can be helped with diversifying
* unlike market risk, unique risk is in your control to a degree and can be helped with diversifying
40
New cards
Diversifiable Risk aka Specific Risk:
\
\
risk of losing an investment due to company or industry specific hazard, opposite to market or systematic risk eg. shortage of specific materials (ie memory chips, silicon), new legislation specific to that industry
41
New cards
Market risk:
\
\
\
\
possibility that an investor may experience losses due to factors that affect the overall performance of the market, volatility of the market as a whole
* measured by beta
* measured by beta
42
New cards
Systematic risk:
\
\
risk that is inherent to the entire market or market segment aka undiversifiable risk, meaning you cannot continue to diversify to completely remove this risk
* measured by beta
* measured by beta
43
New cards
Market portfolio:
portfolio all assets in economy (hypothetical), typically uses broad stock market index to represent the market as a whole
44
New cards
Beta:
measures how volatile an investment is compared to the overall market
45
New cards
beta > 1 means…
higher volatility: (riskier than the market)
46
New cards
beta < 1 mean….
lower volatility: (less risky than the market
47
New cards
adding lower volatility stocks to your porfolio will….
it will reduce the risk of a portfolio of your overall portfolio
48
New cards
Efficient Portfolio:
a portfolio that provides the greatest expected return for a given level of risk (ie standard dev) or, the lowest risk for a given expected return
* remember that yield curves are typically similar to normal distributions, however they have fatter tails
* rational investors want to take on the least amount of risk while still getting the highest amount of reward, meaning that you want to have the highest expected return and the lowest standard deviation
* remember that yield curves are typically similar to normal distributions, however they have fatter tails
* rational investors want to take on the least amount of risk while still getting the highest amount of reward, meaning that you want to have the highest expected return and the lowest standard deviation
49
New cards
Markowitz portfolio theory:
given a desired level of risk, an investor can optimize the expected returns of a portfolio through diversification
50
New cards
__Efficient frontier:__
set of optimal portfolios that offer the highest expected return for a defined level of risk or the lowest risk for a given level of expected return
\- each half egg shell represents the possible weighted combinations for two stocks
\- each half egg shell represents the possible weighted combinations for two stocks
51
New cards
Efficient Set
You would want to pick a portfolio that is on that line, however, you want to have both the highest expected return as possible E(R) and the lowest st dev, therefore you want to have it on the upper part E to B, where both of this criteria is met.
52
New cards
Explain this diagram
The light blue U’s represent all of the possible combinations of weighted averages you can have between risk free and riskier portfolios. Theoretically, there is an option that is completely risk free, ie the intersection of y axis on rf. However, to get a higher pay off, you will want to balance between rf and rm (as it’s the highest point on the minimum variance portfolio
53
New cards
__Capital Market Line (CML):__
represents portfolios that optimally combine risk and return, ie the risk free rate and the market portfolio of risky assets. (see red line on graph above)
\
Under CAPM, all investors will choose a position on CML as it maximizes return for a certain level of risk - reward ratio
\
Under CAPM, all investors will choose a position on CML as it maximizes return for a certain level of risk - reward ratio
54
New cards
__Sharpe ratio:__
essentially measures the slope of line of CML
\
the higher the slope, the better the asset
Generally speaking, purchase assets if Sharpe ratio is above CML, sell if they’re below CML
\
\
the higher the slope, the better the asset
Generally speaking, purchase assets if Sharpe ratio is above CML, sell if they’re below CML
\
55
New cards
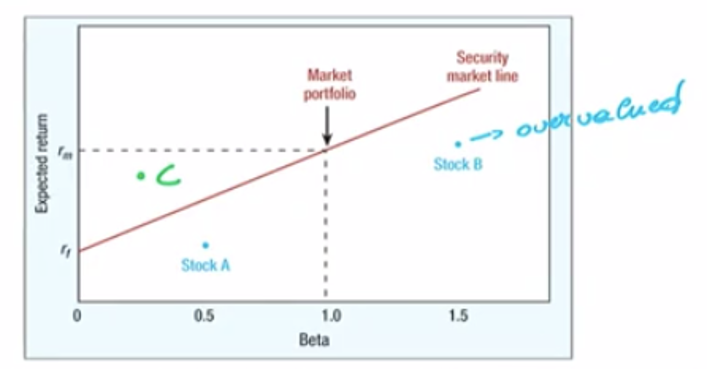
__Security Market Line (SML):__
represents the markets risks and return at a given time, and shows expected return of individual assets
ie risk to reward ratio
ie risk to reward ratio
56
New cards
Explain relationship bewteen beta and expected return
if your beta is higher (more volatile), then there is a linear relationship between Beta and the expected return… the higher the beta, the higher the expected return
57
New cards
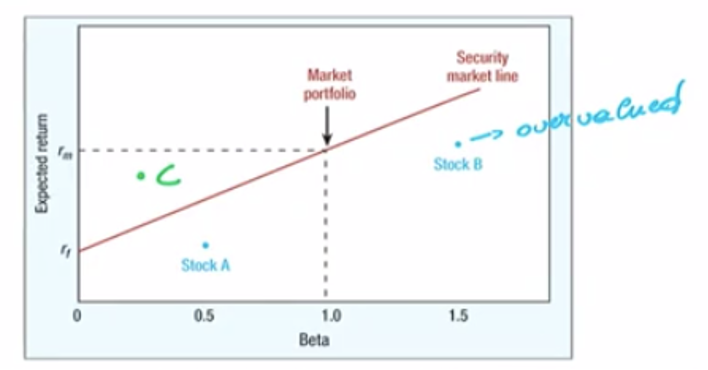
Explain this graph
Stock B is undervalued because it’s under SML, and it is higher risk because it’s beta is higher than one. It’s expected return is too low, so sell it. Once people begin to sell it, it will drive down the price and correct itself in terms of equilibrium.
Stock A is undervalued because it’s under SML, it’s relatively low risk as it’s below beta but that means it’s not very profitable.
Stock C is undervalued, you get a higher return that expected therefore people will buy it and eventually drive up the price and reach equilibrium.
Stock A is undervalued because it’s under SML, it’s relatively low risk as it’s below beta but that means it’s not very profitable.
Stock C is undervalued, you get a higher return that expected therefore people will buy it and eventually drive up the price and reach equilibrium.
58
New cards
Growth stocks:
companies with potential to outperform the overall market over time because of their future potential.
59
New cards
Value stocks:
\
\
companies currently trading below what they are really worth and will thus provide a superior return.
60
New cards
What does value and growth stocks say about CAPM?
Conclusion: value stocks outperform growth stocks meaning that value stocks should have some sort of risk that is not included in CAPM…
61
New cards
__Real assets__
assets used to produce goods and services
62
New cards
__Financial assets__
financial claims to the income generated by the firms’ real assets
63
New cards
equity
residual claim
64
New cards
Investment decision
purchase of real assets
65
New cards
Financial decision
sale of financial assets
66
New cards
Capital structure:
choice between debt and equity financing
67
New cards
Investment Decision / Capital budgeting decision / CAPEX
decision to invest in tangible or intangible assets
68
New cards
__Hurdle rate/Cost of capital__:
minimum acceptable rate of return on investment
ie. the hurdle you need to jump over in order for people to invest
\
ie. the hurdle you need to jump over in order for people to invest
\
69
New cards
Opportunity cost of capital:
investing in a project eliminates other opportunities to use invested cash
70
New cards
Agency problem:
= represent the conflict of interest between management and owners
= agents have the power to make decisions on behalf of the principal but both have different incentives and agent generally has more information
= managers are agents for stockholders and are tempted to act in their own interests rather than maximizing value
= agents have the power to make decisions on behalf of the principal but both have different incentives and agent generally has more information
= managers are agents for stockholders and are tempted to act in their own interests rather than maximizing value
71
New cards
Agency problem I:
Dispersed ownership: conflict between shareholders and management
* more prevalent in UK, USA
* more prevalent in UK, USA
72
New cards
* Agency problem II:
\
\
* Concentrated ownership: conflict between majority and minority shareholders, differing nature of corporate governance
* more prevalent in Asia, Europe
* more prevalent in Asia, Europe
73
New cards
Corporate governance:
the system in which companies are directed/controlled, checks and balances within the organization, the rules, practices and processes used to run a company
* establishes company direction and business integrity, promotes financial viability and builds trust with investors and community
* establishes company direction and business integrity, promotes financial viability and builds trust with investors and community
74
New cards
Solutions for Agency Problems:
\
\
1. Corporate governance codes:
2. Stock options:
3. Board of directors: could consist of executive and/or non-executive members, make sure the board of directors is not too big, have HR member on panel or an executive that does not have majority of stock, etc.
4. Monitoring
5. Market for corporate control: mergers and acquisitions?
6. Shareholder pressure
75
New cards
__Present value:__
value today of a future cash flow
76
New cards
__Future value:__
amount to which an investment will grow after earning interest
77
New cards
Perpetuity:
financial concept where a cash flow is theoretically received forever
78
New cards
__PVAF:__
present value of $1 a year for each of the t years
\
Useful when determining whether to take a lump sum payment now, or to accept an annuity payment in future periods
\
Useful when determining whether to take a lump sum payment now, or to accept an annuity payment in future periods
79
New cards
__Perpetuity with constant growth rate__
\
\
eg. constant growth in dividends could signal to investors that all is going well with the firm
__Note:__ these formulas can be used to value a perpetuity at any point in time
*only use this formula if the growth rate is lower than the rate r – meaning, you must be dividing by a positive number.*
__Note:__ these formulas can be used to value a perpetuity at any point in time
*only use this formula if the growth rate is lower than the rate r – meaning, you must be dividing by a positive number.*
80
New cards
__Effective Annual Interest Rate (EAR):__
\
\
annualized interest rate using compound interest
= (1 + monthly interest rate)^12 -1
= (1 + monthly interest rate)^12 -1
81
New cards
APR
monthly interest rate x 12
82
New cards
__Annual Percentage Rate (APR):__
annualized interest rate using simple interest
83
New cards
__Bond:__
security that obligates issuer to make specified payments to the bondholder
84
New cards
__Face Value:__
par price/principal value, payment at the maturity of the blond
85
New cards
__Coupon:__
\
\
interest payments made to bondholder
86
New cards
__Coupon rate:__
annual interest payment, as a percentage of face value
87
New cards
Interest rate risk:
\
\
the exposure of a bank’s current and future earnings and capital to adverse changes in the market
\
Can be caused by decline in an interest rate of an asset, therefore long-term bonds tend to be more price sensitive than short term bonds.
Inverse relationship between price and yield that is not linear (compound interest)
\
Can be caused by decline in an interest rate of an asset, therefore long-term bonds tend to be more price sensitive than short term bonds.
Inverse relationship between price and yield that is not linear (compound interest)
88
New cards
Duration:
= measurement of weighted average time before having cash flow
\
* the higher a bond's duration, the more its value will fall as interest rates rise, because when rates go up, bond values fall and vice versa.
\
\
* the higher a bond's duration, the more its value will fall as interest rates rise, because when rates go up, bond values fall and vice versa.
\
89
New cards
General Rules of Duration:
\- duration is shorter than maturity for all bonds (except zero coupon bonds)
\- duration positively related to bond volatility (%)
\- central measure of the interest rate sensitivity of a bond
\- only good approximation for small interest rate changes
\- duration positively related to bond volatility (%)
\- central measure of the interest rate sensitivity of a bond
\- only good approximation for small interest rate changes
90
New cards
__Modified duration/volatility:__
= measures price sensitivity to interest rates, ie percentage change in price in terms of yield
91
New cards
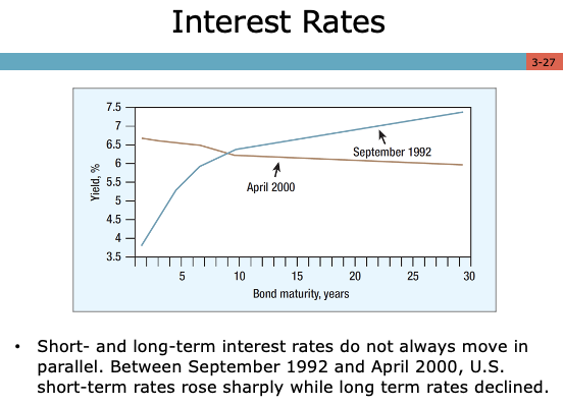
Explain Yield Curve/Term Structure with Interest Rates Graph
Shows YTM based on the prices on the bond market.
“Normal” = upward sloping yield curve
ie. Long term interest rates are higher than short term interest rates
This is because short term and long term interest rates do not always move parallell
“Normal” = upward sloping yield curve
ie. Long term interest rates are higher than short term interest rates
This is because short term and long term interest rates do not always move parallell
92
New cards
Term structure
\
\
same thing as yield curve, refers to the relationship between short term and long term interest rates
93
New cards
__Spot rate:__
\
\
actual interest rate today (t=0)
“On the spot”
“On the spot”
94
New cards
__Forward rate:__
\
\
interest rate, fixed today, on a loan made in the future at a fixed time
95
New cards
__Future rate:__
\
\
spot rate that is expected in the future
96
New cards
__Yield curve:__
\
\
shows the yield on bonds over different times to maturity
Note: Short term and long term interest rates do not always move in parallel
Note: Short term and long term interest rates do not always move in parallel
97
New cards
__Yield to maturity (YTM):__
IR on an interest bearing instrument
\- positive slope suggests future economic upswing, downward slope suggests recession
\- positive slope suggests future economic upswing, downward slope suggests recession
98
New cards
What acts as a __leading indicator__ of real economic activity?
YTM
99
New cards
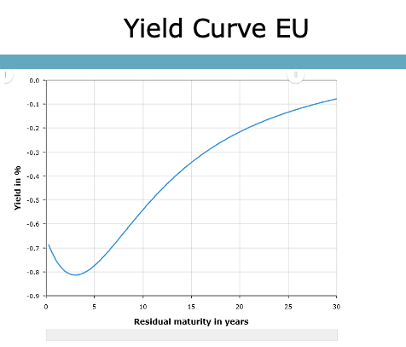
Explain this graph
The EU yield curve rates are negative, meaning that gov’ts are able to, on average, borrow at negative interest rates
Meaning that they receive interest instead of paying interest. \[exceptional circumstance\]
100
New cards
__Expectations Theory:__
yields on financial assets of different maturities are related primarily by market expectations of future yields
Meaning, that the long interest rate is the average of expected future short term interest rates.
Meaning, that the long interest rate is the average of expected future short term interest rates.