ABL
1/25
There's no tags or description
Looks like no tags are added yet.
Name | Mastery | Learn | Test | Matching | Spaced | Call with Kai |
|---|
No analytics yet
Send a link to your students to track their progress
26 Terms
horizontal homogeneity
reynold averaging
mixed assumption - BL is a slab where PT is vertically well mixed.
neglect 4: subsidence, molecular diffusion, radiative heating, diabatic heating
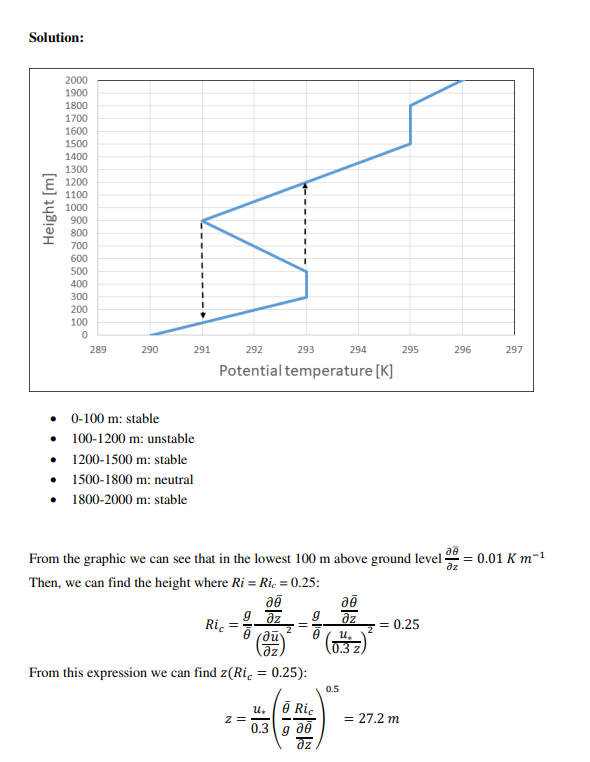
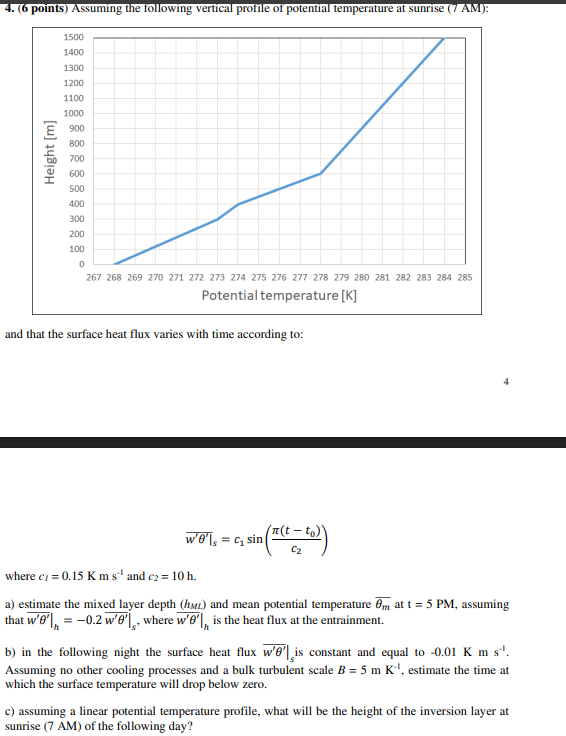
Describe how the vertical profile of potential temperature in the stable boundary layer can vary depending on the different cooling mechanisms involved.
The PT profile in the SBL is primarily a surface-based inversion driven by radiative cooling, where increased turbulent mixing, due to higher wind speeds, smooths the gradient and deepens the inversion, while calm conditions result in a sharper, shallower, and more intense inversion near the surface.
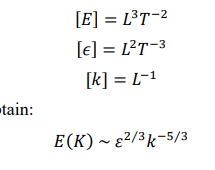
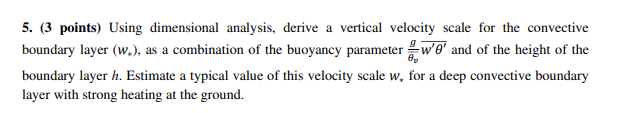
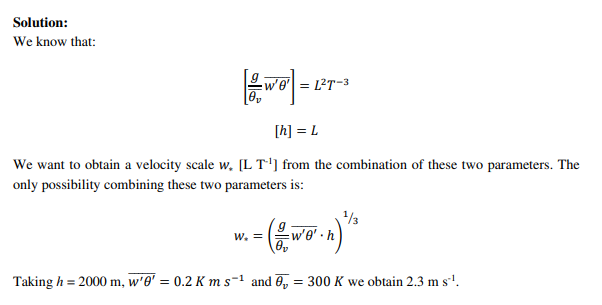
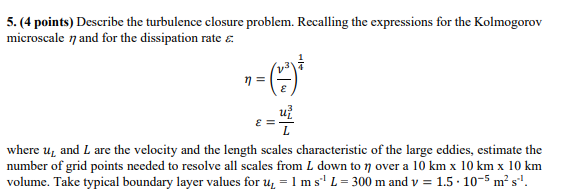
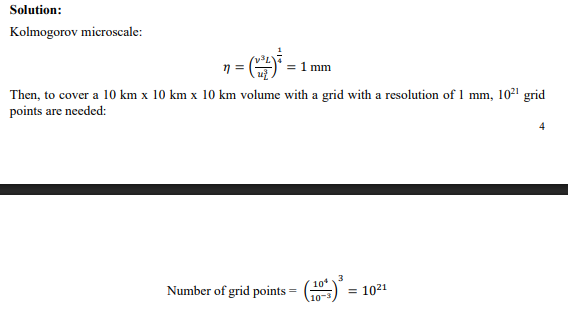
What is the inertial subrange? How can the Kolmogorov -5/3 law be derived from dimensional analysis?
The inertial subrange is a range of eddy scales where energy is transferred from large to small eddies without production or dissipation, and the -5/3 law is derived by using dimensional analysis to relate the energy spectrum solely to the energy dissipation rate ($\varepsilon$) and the wavenumber ($k$).
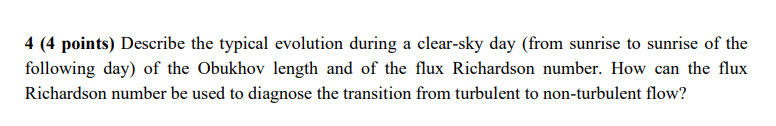
The Obukhov length and flux Ri shift from negative during turbulent unstable day to positive during stable night. turbulence cease when flux Ri reaches critical threshold of 0.25
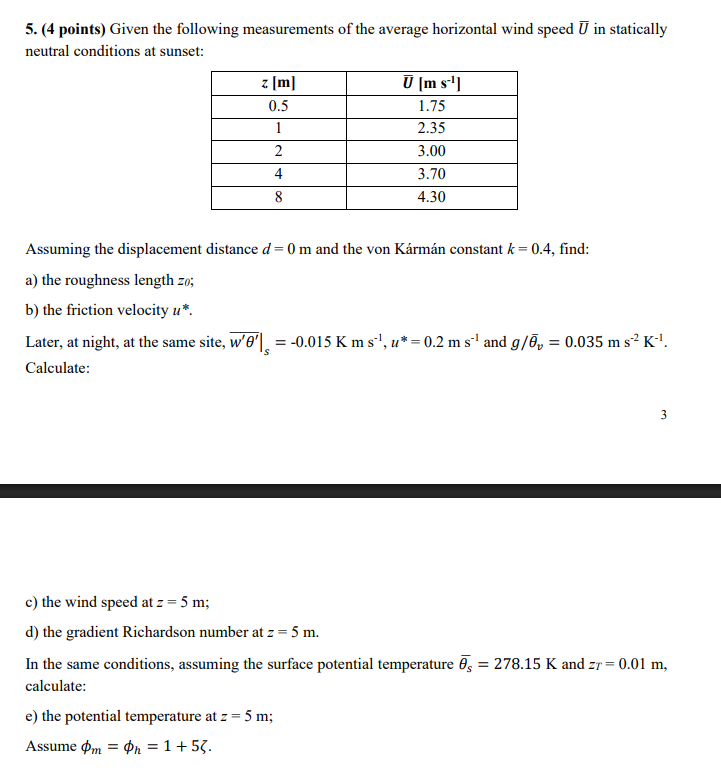
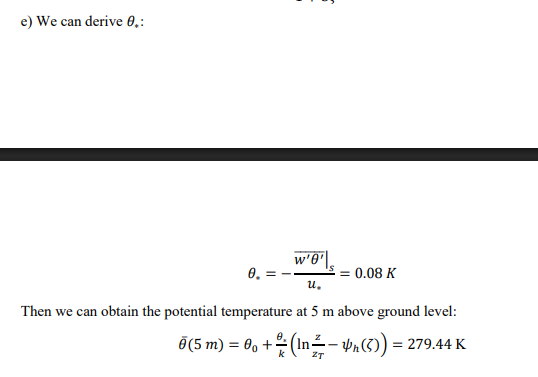
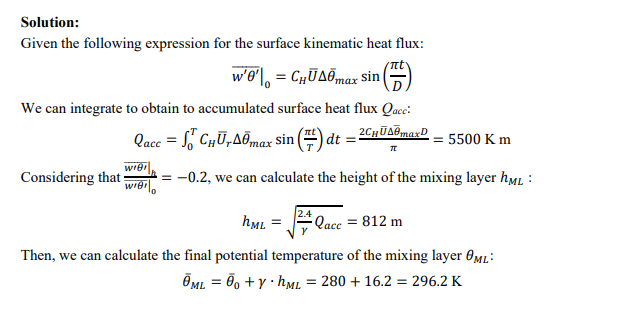
and part e) = 279.44 K

Transitional length scale where energy transfer from large eddies start to be significantly influenced by viscous dissipation, effectively bridging the inertial subrange and dissipation range.
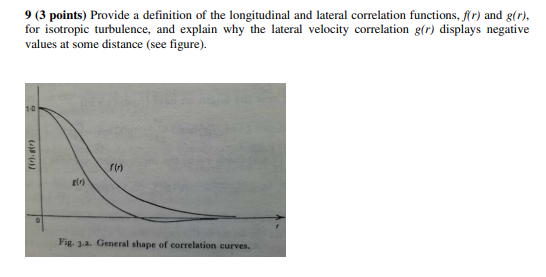
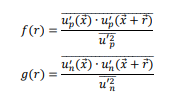
Longitudinal - correlation between velocity flux at 2 points separated by distance r, velocty parallel to separation vector.
Lateral … - velocity measured perpendicular to separation vector. negative dip in g® is direct consequence of continuity equation for incompressible fluids. Positive velocity fluctuation compensates return flow to satisfy mass balance. drops below zero before decaying to zero at larger distances where flow becomes decorrelated.
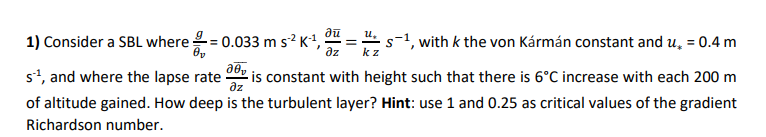
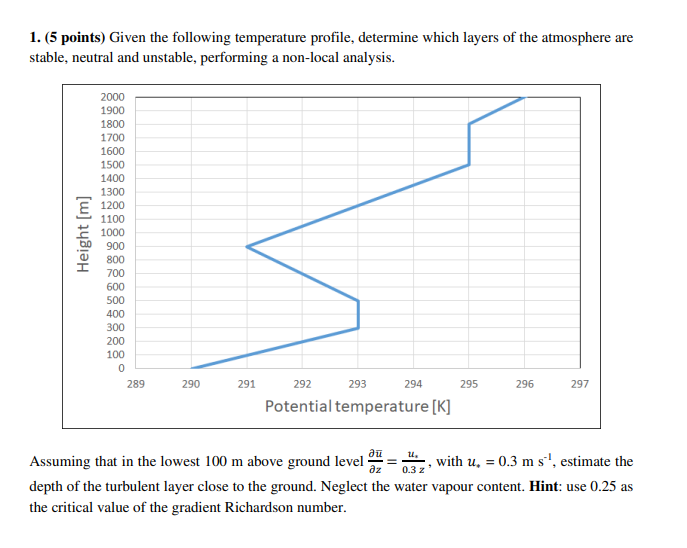
z = 31.8 m (Ric = 1), z = 15.9 (Ric = 0.25)
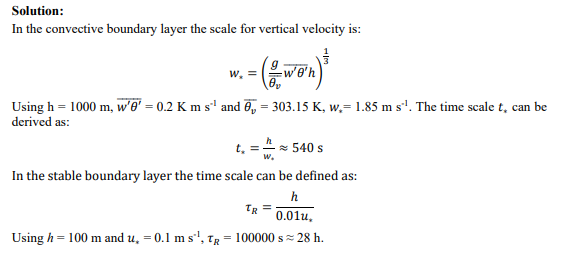
Derive typical values of the time scales of turbulence in the convective and in the stable boundary layer, highlighting their differences and providing a physical explanation.
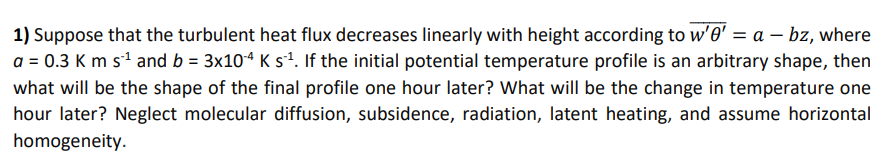
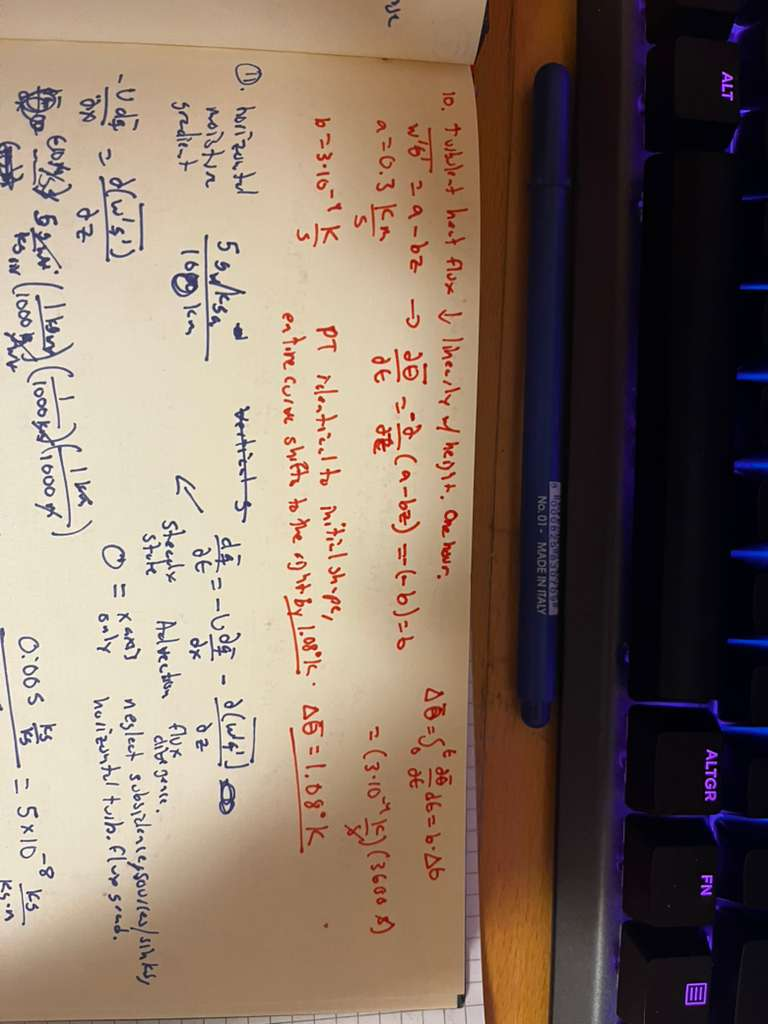
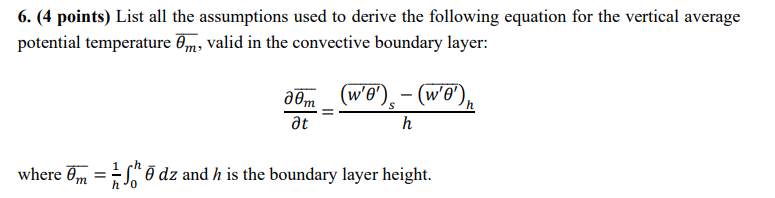
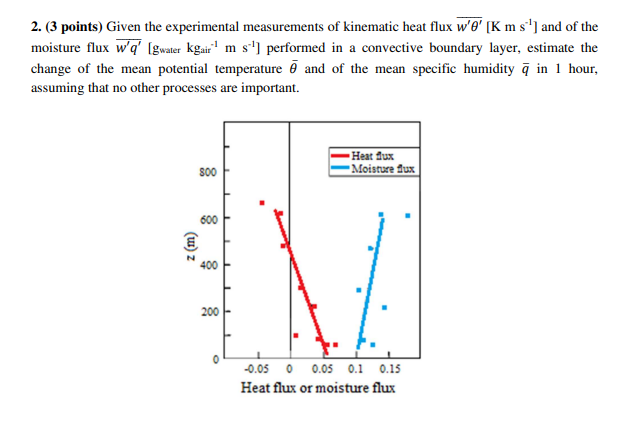
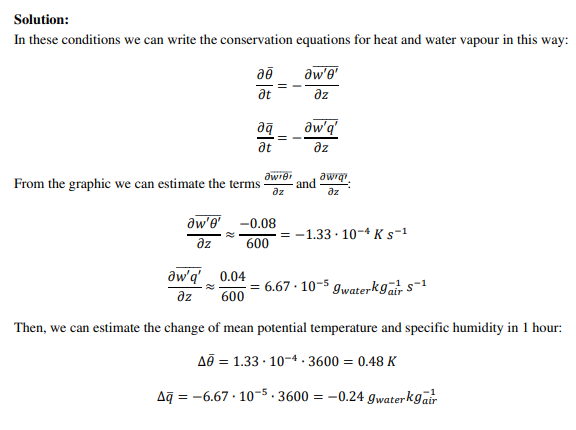
Draw and describe the typical vertical profiles of the turbulent fluxes of heat, moisture and momentum in the convective boundary layer and highlight their effect on the temporal evolution of the respective mean variables.
In the CBL, turbulent heat and moisture fluxes typically decrease linearly from + surface values to - values at the EZ, which drives the warming and moistening of the BL over time. Meanwhile, the vertical momentum flux is generally weak and roughly uniform throughout the ML, maintaining a relatively constant mean wind speed with height.