integ: psych assessment (realibilty)
1/119
There's no tags or description
Looks like no tags are added yet.
Name | Mastery | Learn | Test | Matching | Spaced | Call with Kai |
|---|
No analytics yet
Send a link to your students to track their progress
120 Terms
Reliability
consistency in results regardless of how many or who takes the assessment
Synonym for dependability or consistency
Refers to something that produces similar results
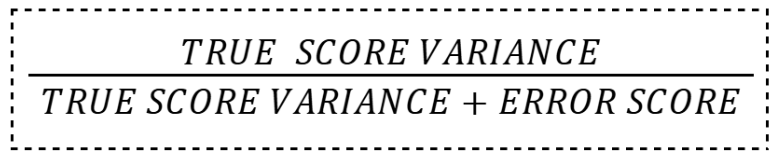
proportion of total variance attributed to true variance
Precedes validity; without this a test cannot be valid
Rasch Model
each item on the test is assumed to have an equivalent relationship with the construct being measured by the test
checks whether a test question matches a person’s ability level.
ex: Student Ability
Anna = very skilled in math
Ben = average
Carla = beginner
Question Difficulty
Question 1 = easy
Question 10 = difficult
According to the Rasch Model:
Anna will likely answer both easy and difficult questions correctly
Carla may only answer easy questions correctly
Observer differences
when different observers record the same behavior
even though they have the same instructions, different judges observing the same event may record different numbers
assessed using kappa statistic
Time sampling
same test given at different points in time may produce different scores, even if given to the same test takers
assessed using test-retest method
transient error
source of error attributable to variations in the testtaker’s feelings, moods, or mental state over time
Methodological Error
when mistakes come from the way the test or research is designed and conducted.
examples are interviewers not being trained properly
wording in the questionnaire may have been ambiguous
items may have somehow been biased to favor one or another
error variance
variance from irrelevant, random sources
caused by mistakes, random factors, or outside influences — not the person’s real ability or trait.
The student is actually good at math, but:
the room is noisy
they did not sleep well
-they felt nervous
true variance
variance from true differences of the test takers on the construct being measured
reflects a person’s real ability, trait, or characteristic — not mistakes or random factors.
ex: Student A is actually better in math than Student B. Their different scores reflect real ability.
Reliability Coefficient
statistic that quantifies reliability, ranging from 0 to 1
reliable
The greater the proportion of the total variance attributed to true variance, the more what the test
Perfect Reliability
1.0
may indicate redundancy / homogeneity
Excellent Reliability
≥ 0.9
minimum for clinical settings
Charles Spearman
pioneered reliability assessment.
Worked out most of the basics of contemporary reliability theory and published his work in a 1904 article entitled “The Proof and Measurement of Association between Two Things.”
Abraham De Moivre
basic notion of sampling error
Karl Pearson
developed the product moment correlation
Good Reliability
≥ 0.8 < 0.9
Acceptable Reliability
≥ 0.7 < 0.8
minimum for psychometric tests
Questionable Reliability
≥ 0.6 < 0.7
acceptable for research
Poor Reliability
≥ 0.5 < 0.6
Unacceptable Reliability
< 0.5
No Reliability
0.0
Goals of Reliability
Estimate errors (anything unaccounted for) in psychological measurement
Devise techniques to improve testing so errors are reduced
reliability
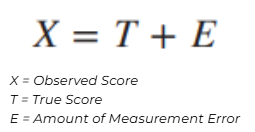
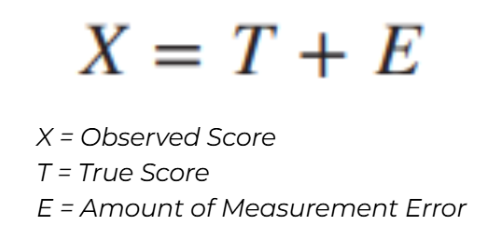
True Score
measurement of a quantity if there were no measurement error at all
Can never be observed directly
It’s approximate can be identified by averaging measurements
Tied to the measurement instrument used
Long-term average of many measurements free of carryover effects
true score
person’s real score or actual level on a trait or ability, free from measurement error.
without any mistakes or outside influences affecting the result.
Factors that influence accuracy
Time lapses between measurements
Act of measurement
Carryover Effects
measurement processes that alter what is measured
when a person’s experience in one condition or test affects their performance in the next condition or test.
Practice Effects
test itself provides an opportunity to learn and practice the ability being measured (increase of score due to test taker)
when a person’s test performance improves because they have already taken the test before.
Test Sophistication
increase of score due to the test
person’s familiarity, experience, or skill in taking tests.
being “good at taking tests” because of experience with testing situations.
already knows:
how tests work,
how questions are usually asked,
and strategies for answering them.
test sophistication
Two students have the same intelligence level.
Student A rarely takes standardized tests.
Student B often takes entrance exams and online practice tests.
Student B may score higher because they:
know time-management strategies,
are comfortable with multiple-choice questions,
and feel less anxious.
Fatigue Effects
repeated testing reduces overall mental energy or motivation to perform on a test
when a person’s performance becomes worse because they are physically or mentally tired during testing.
reliable tests
give scores that closely approximate true scores
valid tests
give scores that closely approximate construct scores
Construct Score
person’s standing on a theoretical variable independent of any particular measurement
tells how much of a certain psychological trait a person has based on test results.
concept of reliability
Variance
useful in describing sources of test score variability; the standard deviation squared
shows how spread out or different scores are from the average (mean).
whether scores are very similar to each other, or very spread apart.
Bias
degree to which a measure predictably overestimates or underestimates a quantity
anything in a test, assessment, or situation that causes results to be unfair, inaccurate, or systematically favor one group over another.
Measurement Error
inherent uncertainty associated with any measurement, even after care has been taken to minimize preventable mistakes
when a test score is affected by factors unrelated to the person’s true ability or trait.
Ex. a ruler may be accurate in some areas but not all
A student normally performs well in math.
But during the test:
they are tired,
cannot concentrate,
and score lower than usual.
The lower score is partly caused by
Error
refers to the component of the observed test score that does not have to do with the test taker's ability
anything that causes a test score to differ from a person’s true score.
anything that makes a test score imperfect or inaccurate.
Random Error
source of error in measuring a targeted variable caused by unpredictable fluctuations and inconsistencies of other variables in the measurement process
has no consistent pattern and can increase or decrease a score in any direction.
Affects precision
Also called “noise:”
Ex. physical events that occur during a test
Systematic Error
source of error in measuring a variable that is typically constant or proportionate to what is presumed to be the true value of the variable being measured
Affects accuracy
Either consistently inflate scores or consistently deflate scores
consistent and repeatable error that affects test scores in the same direction (either making scores too high or too low).
random error
A student takes two similar tests on different days:
Day 1: feeling happy → scores higher
Day 2: feeling tired → scores lower
A participant is taking a memory test. During one session:
a loud noise suddenly occurs,
they lose focus for a few seconds,
and miss a few items.
On a multiple-choice test:
a person guesses several answers,
some guesses are correct by chance,
others are wrong.
systematic error
A math test uses word problems based on city experiences (e.g., subway systems, traffic in big cities).
Students from rural areas may consistently score lower—not because they are less skilled, but because the content is unfamiliar.
If instructions are unclear every time the test is given:
many participants misunderstand questions,
and consistently lose points.
A teacher believes certain students are “weak.”: As a result:
they mark those students more strictly every time,
regardless of actual performance.
Item Sampling
refer to variation among items within a test as well as to variation among items between tests
Also called content sampling
Extent to which a testtaker’s score is affected by the content sampled on a test and by the way the content is sampled
when a test only uses a small set of questions to represent a much larger skill or trait.
Test Administration
Testtaker’s reactions to error variance that occur during test administration are the source of one kind of error variance
giving, conducting, and managing a psychological test in a standardized way so that results are fair, accurate, and consistent.
how the test is given, under what conditions, and who follows the instructions.
Test Environment
room temperature, level of lighting, and amount of ventilation and noise
Testtaker Variables
emotional problems, physical discomfort, lack of sleep, and the effects of drugs or medication
Examiner-Related Variables
examiner’s physical appearance and demeanor
Test Scoring and Interpretation
Technical glitches in computer scoring may contaminate data
Element of subjectivity in scoring
Test Scoring
where responses are turned into numerical values.
counting the results
test interpretation
understanding what those scores mean in terms of ability, traits, or behavior.
explaining what the results mean
test-retest
stability of a measure by correlating pairs of scores from the same people on 2 different administrations
Source of error is time sampling
Ideal time is 2-4 weeks
Appropriate when evaluating the reliability of a test that purports to measure something that is relatively stable over time (ex. Personality trait)
↑ interval between tests = ↓ correlation / reliability
test designed for various use

Coefficient of Stability
estimate of test-retest reliability when the interval between testing is > 6 months
how stable or consistent a test score is across time.
alternate forms
evaluates the correlation between 2 different forms of a test
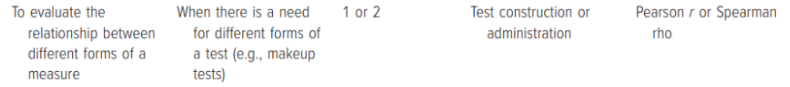
Coefficient of Equivalence
estimate of alternate-forms or parallel-forms reliability
a measure of how similar scores are when a person takes two different but equivalent versions of the same test.
if two versions of a test give similar scores for the same people.
Parallel Forms Reliability
for each form of the test, the means and the variances of observed test scores are equal
Means of scores obtained correlate equally with the true score
Alternate Forms Reliability
different versions of a test that have been constructed so as to be parallel
Typically designed to be equivalent with respect to variables such as content and level of difficulty
Can be time-consuming and expensive
Ex. Army Alpha and Army Beta
Immediate Form
administered at the same time
Delayed Form
interval between both administrations
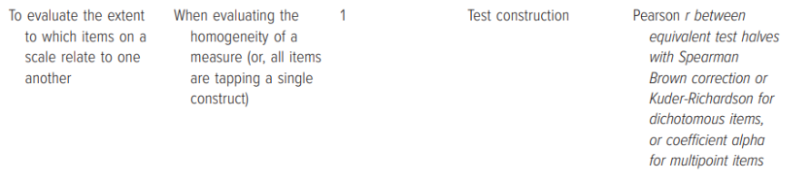
internal consistency
test designed for single administration onl
inter-scorer
degree of agreement or consistency between two or more scorers with regard to a particular measure
Also called scorer reliability, judge reliability, observer reliability, and inter-scorer reliability
Often used when coding nonverbal behavior
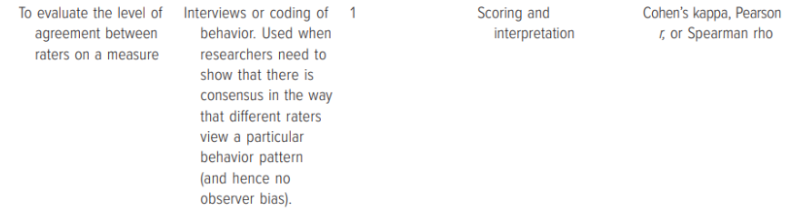
Coefficient of Inter-Scorer Reliability
degree of consistency among scorers in the scoring of a test
Kappa Statistics
used for nominal data
used to check how much agreement exists between two raters or judges, beyond what would happen just by chance.
Cohen’s Kappa
used to measure the level of agreement between two raters or judges only
Fleiss Kappa
determine the level of agreement between two or more raters
Kendall’s W
used for rankings / ordinal data in interrater reliability
Perfect Agreement
in COHEN’S KAPPA RANGES, 1.0
Near Perfect Agreement
in COHEN’S KAPPA RANGES, 0.81 - 0.99
Substantial Agreement
in COHEN’S KAPPA RANGES, 0.61 - 0.80
Moderate Agreement
in COHEN’S KAPPA RANGES, 0.41 - 0.60
Fair Agreement
in COHEN’S KAPPA RANGES, 0.21 - 0.40
Slight Agreement
in COHEN’S KAPPA RANGES, 0.10 - 0.20
No Agreement
in COHEN’S KAPPA RANGES, 0.0
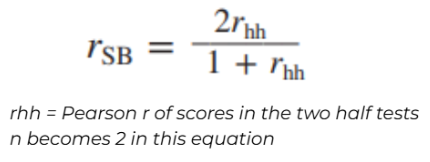
Split-Half Reliability
method of internal consistency that correlates 2 pairs of scores obtained from equivalent halves of a single test administered once
Appropriate when evaluating psychological variables that are more state-like than trait-like
Odd-Even Reliability
assigning odd-numbered items to one half of the test and even-numbered items to the other half
Spearman–Brown Formula
used to estimate internal consistency reliability from a correlation between two halves of a test
Can also be used to estimate the effect of shortening the test on the test’s reliability
↑ length = ↑ reliability
could also be used to determine the number of items needed to attain a desired level of reliability
can help estimate how many items will have to be added in order to bring a test to an acceptable level of reliability
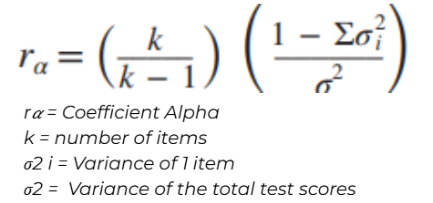
Coefficient Alpha
Also called cronbach’s alpha
Measure non-dichotomous items
May range in value from 0 to 1 only
Helps answer questions about how similar sets of data are
Accurately measures internal consistency when multiple loadings are equal (ex. Likert scale)
KR-20
dichotomous items with varying levels of difficulty
where test items are highly homogeneous, KR-20 and split-half reliability estimates will be similar
KR-21
dichotomous items with uniform level of difficulty
Average Proportional Distance
measure used to evaluate internal consistency of a test that focuses on the degree of differences that exists between item scores
Not connected to the number of items on a measure
way of measuring how much scores differ from each other on average, in proportion to a reference value (usually the mean or total score).
how far scores are from each other
spearman-brown formula (half-test)
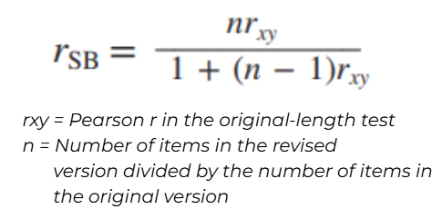
Spearman-Brown Formula (whole test)
Coefficient Alpha
Excellent Consistency
𝜶 ≥ 0.9
Good Consistency
0.9 > 𝜶 ≥ 0.8
Acceptable Consistency
0.8 > 𝜶 ≥ 0.7
Questionable Consistency
0.7 > 𝜶 ≥ 0.6
Poor Consistency
0.6 > 𝜶 ≥ 0.5
Unacceptable
0.5 > 𝜶
Homogenous
uniform items; measures only 1 factor; high internal consistency
↑ internal consistency ≠ homogeneity
Items must be positively correlated
Heterogenous
measures > 1 factor, low in internal consistency
Dynamic
a trait, state, or ability presumed to be ever-changing as a function of situational and cognitive experiences (ex. anxiety)
Static
a trait, state, or ability presumed to be relatively unchanging (ex. intelligence
Restriction
resulting correlation coefficient tends to be lower
Inflation
resulting correlation coefficient tends to be higher
Speed Tests
contains items of uniform level of difficulty and within a time limit
Should be based on performance from two independent testing periods using one of the following
Test-retest reliability
Alternate-forms reliability,
Split-half reliability from two separately timed half tests
If a split-half procedure is used, then the obtained reliability coefficient is for a half test and should be adjusted using the Spearman–Brown formula
Power Tests
difficult items, time limit is long enough to allow test takers to attempt all items
Criterion-Referenced Tests
designed to provide an indication of where a testtaker stands with respect to some variable or criterion
Classical Test Theory (CTT)
true score model of measurement
how test scores are made up of true score + error.
every observed test score is not perfect, but a combination of:
the person’s real ability, and
random measurement error.
In favor of longer tests
Most widely used and accepted model in the psychometric literature
Much simpler to understand than IRT