MARK 5343 Exam 2
1/82
There's no tags or description
Looks like no tags are added yet.
Name | Mastery | Learn | Test | Matching | Spaced | Call with Kai |
|---|
No analytics yet
Send a link to your students to track their progress
83 Terms
Logistic Regression
Makes probabilistic predictions of whether you are a 1 or a 0
Logistic regression – what is different here regarding the DV? the IVs?
DV: Binary, dummy coded, nonmetric Y that is predicted
IV: Predictors that create a variate called Z
What are odds ratios?

What are log odds ratios?
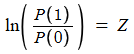
What is the variate in logistic regression considered to be
Z
ln(P1/P0)
a logit
What does it mean when Z is positive
Increased P(1) (probability of event 1)
What does it mean when Z is negative
Increased P(0) (probability of event 0)
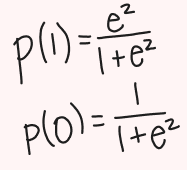
We turn the variate into P(1) and P(0)… how?
ez over 1 + ez = P(1)
1 - P(1) = P(0)
Determines strongest alignment to DV
Null model
Specifies in advance the P(1) and P(0) based on the observed DV proportions. Then, we introduce X material and hopefully improve over the null.
ln(P1/P0) = Z + 0(X)
Model only has the intercept and no predictors
Parameter estimation to get the best bs is Iterative
Model produced probability of being “what you are”
Likelihood function (L)
The joint probability based on the model for the entire sample (Multiplication of actual probabilities)
Maximizes L to find the best b’s
L = 1 if probabilities are perfect
Log likelihood function (LL)
Sum of the log of each probability
Model fit diagnostic that has meatier numbers than L and should be minimized
LL = Ln(.8) + Ln(.45) + Ln(.9)
Can use to compute pseudo R 2
-2LL
Makes LL useable in Chi-squared test of significance
Produces x2 statistic that follows a chi-squared distribution. The closer this is to 0, the better
We want the proposed model’s to be lower than the null’s
-2LL difference (Likelihood Ratio Test)
Difference from null model to test whether the proposed model’s estimation is significantly better than the null model
-2(LLnull - LLproposed)
Can also use to compare two models
Logistic output pieces that parallel multiple regression output pieces, including if stepwise
Variate: Z vs. Y-hat
Model Fit: L, LL, pseudo R2 vs. R2
b’s P-Value: Wald vs. t-statistic
Comparable X’s Impact: EXP(b) vs. Standardized coefficients (beta)
Equation: B vs. Unstandardized B
Variance Explained: pseudo R2 vs. R2
Other Model Fit: F test vs. Chi-square test of -2LL difference
Pseudo R-square (use Nagelkerke)
Model fit test that determines how much variability a model can explain of its outcome (explanatory power)
Want this number to be close to 1
Ex. 64% of the variance in Y is explained by the predictors
Significance of individual variables in logistic regression
Wald test statistic
Sign and size of bs and the impact on P(1)
A 1 unit increase in the predictor variable results in b increase/decrease in the Y/log-odds
Can assess directionality of relationship
Exp(b)
Can compare IVs relative impacts on P(1)
1 = no change in the odds
exp(b) - 1 = % change in odds
What model fit test is distinct for a categorical DV
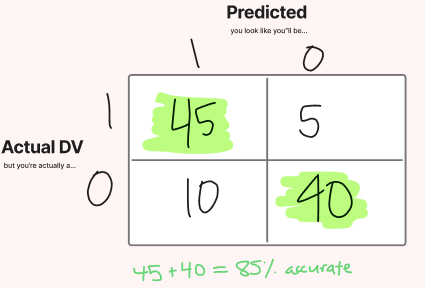
Classification Matrix
Understanding prediction accuracy in the classification matrix
correct prediction freq + correct prediction freq = % accuracy at prediction
look at the diagonal
What are the two benchmarks for classification accuracy?
Cpro and Cmax
Cmax
The larger percentage between percent positive and percent negative in a classification matrix
Cpro
percent positive2 + (percent negative)2
How to compute Cpro and Cmax criteria for judging classification (1.25 x Cpro, 1.25 x Cmax)
Cmax:
If
Cpro:
Cpro - square actual proportions and add together, the chance standard to beat by 25%
Cmax – assign everyone to largest category, percent accuracy doing that? Beat by 25%
Logistic Regression validation with a hold-out/split sample
Two group discriminant Analysis – nature of DV and IVs
Discriminant analysis big picture idea
Find best bs that make groups as separate / discriminated as possible
How many discriminant functions in relation to number of groups?
Read outputs from running in SPSS, direct (simultaneous) or stepwise
Know differences in coefficient types: unstandardized, standardized, loading/structure
Which two are most used for variable “importance”?
Discriminant analysis statistical test of overall model fit
Classification accuracy (another test of model fit/strength, higher percentages better)
How do I judge quality of classification accuracy with Cpro and Cmax? (same as logistic)
Discriminant analysis validation with a hold-out/split sample
Validation via the “one-at-a-time left out” method (labeled cross-validated in SPSS)
Three + groups discriminant analysis – nature of DV and IVs
How many discriminant functions in relation to number of groups 3+?
Tests of significance for each function
Types of coefficients for each function
Outputs for direct or stepwise estimation, SPSS, 2D plots
What is the potency index?
Use of potency index for variable “importance” – one number for each IV even if multiple functions
Classification matrix and accuracy interpretation (know what it looks like for 3+ groups)
Map with Centroids (green, blue, red, people from slides, pink x boxes are centroids)
What is conjoint, what does it allow you to do?
Ratings-based full profile method (previous textbook chapter)
Defining attributes and levels
Use of fractional factorial designs to build profiles [the design… the X side predicting ratings]
Concepts of total utility (rating) and part-worth utilities (bs)
Addition of other profiles for “validation” - hold out profiles
Addition of other profiles for simulation (see what would happen in a market with certain offerings)
Respondent task = ratings task (vs. choice task)
Effect coding (vs. dummy coding) the design matrix
Multivariate statistical technique used to estimate part-worths (regression)
The “nice” property of effects coded estimates (sum to 0)
Determine fit at individual level, statistics from the chapter (Multiple R, Tau nonparametric)
Deletion of cases with bad fit (estimation or hold out) and/or illogical part-worth patterns
Restating part worth utilities (book process – lowest level of each attribute 0)
Rescaling part worth utilities (book process – each attribute brought 100 to the table)
Computing attribute importance (High minus low for each attribute, over sum of all hi minus low, easy if low within each attribute was made 0, now just high for each attribute over the sum of all highs)
Ability to “Segment” people based on individual-level information
Use of simulation profiles to simulate market share (book uses 2 existing products, 1 new)
Get total utility for each product configuration in the simulation
Use values to compute discrete predicted choice (maximum utility rule)
Or use values to compute probabilistic predicted choice (BTL, or Logit Choice rule)
Core understanding of leap from ratings to “Choice-Based” (with HB estimation):
Choice sets
Choice alternatives
Probabilistic prediction within each choice set
HB estimation - borrowing from upper model
Individual part-worth utilities
Averaging over every nth draw from last set of draws (e.g., every 10th draw from last 1000 gives 100 values to average)
Uses of individual-level utility estimates as before
Very high level understanding of history/development: Ratings Based
Very high level understanding of history/development: Choice Based – aggregate logit model, one equation for everyone
Very high level understanding of history/development: Latent class – segments and estimates one logit model per segment (a way to represent respondent heterogeneity)
Very high level understanding of history/development: CBC-HB… individual level heterogeneity, one model (part worth utilities) per participant
Relative variable importance: Regression, Logistic, 2 group discriminant, 3 group discriminant, conjoint