ALL notes cards theory / defs
1/80
Earn XP
Description and Tags
Name | Mastery | Learn | Test | Matching | Spaced | Call with Kai | Chat |
|---|
No analytics yet
Send a link to your students to track their progress
81 Terms
Free trade, trade protection, exports, imports
Absence of gov intervention in international trade
Gov intervention in international trade
Disadvantages: trade wars, prices, income distribution (apart from subsidies), worsening export competitiveness, inflation
Benefits: infant, security, health safety env standards, developing country to diversify
Also: but sus,. Dumping, BoP, revenue, protection jobs domestically
GS produced domestically and sold in another country
GS produced in another country and bought for domestic use
Firm
Organisation that employs FOP to produce and sell g/s
Industry
Group of 1+ firms producing identical or similar g/s
Sum of all forms making same product(market supply)
Allocative efficiency
Producing the quantity and combination of goods most wanted by society , when economy allocated resources so that society gets maximised benefits from consumption
Barriers to entry
EoS
Natural monopoly
Branding
Legal
patents
Licences
Copyrights
Tariffs
Essential resource control (debeers diamonds 50%) eg
Aggressive tactics
Why MR below demand (and price) and MR relation to D
Because price changes when extra revenue for each unit changes
Price change from $6-$7
But this new price is also on other units in addition to lost units
//
Demand curve is inelastic when MR is negative — eg if when price falls the revenue falls
Natural monopoly
One large firm with EoS so large that Can supply entire market at lower AC than two or more smaller firms
Market power
Extent a firm in industry is able to control price at product sold
Oligopoly and monopoly
Few large firms producing similar goods services with high barriers of entry (differentiated or not)
One large firm producing unique product with no close substitutes with very high barriers to entry
Marginal revenue
Change in revenue from selling one extra unit of output
Explicit implicit and economic costs
when firm uses resources it doesn’t own
Sacrificed income from use of self owned resources by a firm
Total of above
MC = MP theory
marginal product peak = marginal cost peak
more workers = lower MC up to a point
After : more workers= higher MC due to law of diminishing marginal returns
Only in short run because fixed
EoS types and DEOS
specialisation of labour
Management specialisation
Bulk putting of inputs (FOP)
Financing
Spread of costs eg marketing over larger output
does
coordinating and monitoring
Communication
Motivation
Profit maximisation , normal absnoar profit
MC=MR
Normal— revenue enough to keep business running , covering explicit and implicit costs (total profit equals total cost) and since entrepreneurs costs is counted, the owner still gets payed
Crowding out
increased government spending and borrowing reduces private sector investment. It happens because high government deficits increase competition for funds, raising interest rates and making it more expensive for businesses to borrow and invest
Keynesian multiplier effect , MPC, MPS, MPT, MPM
Change in RGDP/ initial change in speeding
MPC: MP to consume: fraction of additional income that households spend on consumption of domestically produced GS
MPS:fraction of additional income that households save
MPT: fraction of additional income that is taxed
MPM: fraction of additional income spent on imports
K=1/MPW = 1/(sumMPS MPT MPM)= 1/(1-MPC)
Sum MPC MPS MPT MPM = 1
Perfect compeition , monopolistic
Large number of small price taking firms no barriers to entry and identical products
Allocatively efficient P=MC, no loss
Canadas wheat market - homogenous product, many farmers take prices
Produce at P=MC, no over/under consumption + esp good because climate means limited availible land so being used efficiently
However, real world not completely true→ gov subsidies, causing overproduction common in can farming
Lower prices→help stay competitive globally + price sensitive bulk import markets like Bangladesh, otherwise switch to alts (RUS)- exports — but still price taker in end
Output higher (vs mC)→ benefit import developing countries, self sufficient security → but limited labour during peak seasons
Many piece making firms , differentiated products and no barriers to entry
– MC price > MC long run,
+ product variety
Differentiation in mC US trainer brands — diffferentiation and non price compeitition,
Innpovavtve technology, brand image, etc, brand deals advertising, →benefit consumers with better q products + unique
But depend on differentiation ability→bottled water also mC but limited variety
EOS: small PC firms can’t achieve EOS→lower avg costs in MC, lower prices and higher profits for shareholders : NIKE
Afford efficient tech automation, reduced AP→purshasing EOS< but IRL Nike prices are not low- strong branding allow price making
Autonomous vs induced spending
Autonomous:
consumption investment gov spending net exports
Multiplier effect only initiated by change in. Spending that is not caused by income change
Multiplier effect strength depends on level of spare capacity
Supply side policies
Fiscal and monetary
reduce ST fluctuations in business cycle — stabilisation policies
Monetary:
carried out by CB of each country aiming to change interest rates in order to influence AD
fiscal:
government spending and taxation changes to influence AD

Roles of central bank
banker to the government
Banker to commercial banks
Regulator of commercial banks
Monetary policy
Independence — long term interests of economy , policies may be politically unpopular
Monetary policy goals
low and stable inflation rate
Low unemployment
Reduce business cycle fluctuations
Promote stable economic environment external balance
Determination of rate of interest
risk of loan
Length of time
Size
Degree of monopoly power of lender
Supply of meant fixed
Demand downward sloping
Creation of money
money multiplier
1/ required reserve ratio
Methods
Open market operations : buying and selling of pre existing gov bonds in bond market
Minimum reserve requirements : if requirements lower—then excess reserves increase and able to lend more
Changes in bank min lending rate : can lend to commercial banks, and when do so charges interest rates— minimum lending rate — so affects cost of borrowing for banks and thus how much money people borrow
Quantitative easing : buying bonds in open market but larger scale — more types of financial assets : central bank buys huge Q from commercial and to pay , creates reserve electronically for commercial banks— end up with more reserver to make loans ?? Bro what
Gov budget / revenue
Current (eg day to day spending like wages and salaries of gov employees)
Capital (eg public investment— building roads)
Transfer payments (payment to vul groups for redistribution income)
Revenue
Tax
Sales of public goods
Sale of gov owned property or enterprises (privatisation)
Monetary vs fiscal
budget deficit FP
FP time lags
IR changes more easily reversed
MP less political influence and resistance
Political constraints FP
IR small adjustment iccrements
FP crowding out
Monetary policy strengths
incremental, reversible, flexible, shorter time lag
Central bank independence , limited political constraints, budget deficit debt none
Weaknesses:
ineffective in recession: can’t do negative IR, consumer and producer confidence, banks fearful of lending
Conflict between objectives , inflationary, problematic stagflation or cost push
Fiscal strengths
help deep recessions, target sectors of economy , directly affect AD, deal with escalating inflation, potential output
Automatic stabiisees (like progressive income taxes, unemployment benefits)
weaknesses:
time lags , Political constraints, Sustainable debt ,
tax cuts less effective in AD , fine tune economy inability, inflationary risk, cost push or stagflation unable to fix
Crowding out
Equity vs equality and income inequality
Fairness and just
Vs
State of being equal with respect to smtn
measure of how unevenly income is distributed throughout a population
Inequality indicators Lorenz curve :gini coefficient / wealth comparison
Lorenz curve
percentage of population and percentage of income cumulative
Gini
= area between diagonal and Lorenz curve / area under diagonal
Wealth coefficient / inequality is usually much larger than gini bc income = wealth but at higher proportion due to more opportunity to acquire wealth with additional income
Poverty types definitions
Absolute : income not sufficient to meet basic human needs (family or person)
With international poverty line at <1.90 dollars a day — extreme poverty and periodically adjusted for inflation
relative: compares income of individual or households in society with median income — inequality association
Causes of poverty / inequality
Opportunities inequality (birth lottery)
Human capital levels differ
Resource ownership
Discrimination
Unequal power and status
Gov tax and benefits
Technological change
Globalisation (demand usually for skilled rather than not)
Market based supply side
Pay in certain occupation increase s
Unemployment
Geography
Age
Impact of income and wealth inequality
Economic negative growth (MPC)
MPC of wealthy vs not
Influence over policies for own benefit rather than community
Lower merit G provision
Demand for local GS
Credit can’t bc no collateral
Political instability
Low living standards
access to health and education, mortality rates, preventable diseases, social problems
Social political stability
polarised societies and extremism
Crime
Health , happiness , education
Policies to reduce income and wealth inequality
taxation — provide fund for go. Spending welfare, merit etc
Direct and indirect
Proportional progressive and regressive
Non taxation
Investment human capital
Transfer payments : payment made by gov to individuals for purpose of redistribution income away from certain groups to others
Targeting GS spending
Universal basic income
Policies reduce discrimination
Gov intervention— min wage and price controls
PPC
Shows combination of maximum output that can be produced by an economy with fixed resources and technology provided there is full employment
(actually full employment not like the natural rate)
Consequences of economic growth
SOL
Environment
Inequality
Sustainable level of debt: gov debt and costs
National debt also known as
amount of money gov owes to lenders outside of government
Costs:
debt servicing
Credit rating
Future tax and spending
Private investment
Economic growth
Debt trap
Income inequality
Unemployment , labour force
People of working age who are actively looking for a job but are not employed
Employed + unemployed (still seeking work!)
Measuring unemployment difficulties
hidden unemployment — underestimation —
people may give up looking so aren’t counted any more , or
underemployed (looking for job that matches skills but can’t find)
Also: Working part time but want full time
retraining programmes
Early retirement
Overestimation
- underground economy — unregistered business and work
Regional and population differences
Unemployment consequences
loss of real GDP output
Social
Income/ tax revenue
Unemployment benefit costs
Personal
Income inequality
Skills lost over time
Types of unemployment
Structural (natural)
changes in location of industries ,
Labour market rigidities
Demand for certain skills
Frictional (natural)
Workers recently fired and looking for new jobs ,
Waiting to start a new job
Quit job to find another
Redundancy due to employer bankruptcy
Cyclical
Recessionary gap , low AD — less workers required
Seasonal (natural)
Demand for labour in certain industries changes on seasonal basis based on needs for skills
Natural— real gdp equals potential
Phillips curve
Trade off of inflation and employment in economies — correlation
Inflation ^ unemployment v
But : breakdown with stagflation where inflation rises while EG and employment falls — seen in 1970s
So instead can now shift up and down to account for this
aggregate demand
Total quantity of agreggate output that buyers in an economy want to buy at different possible price levels deters paribus
Causes of changes in consumption spending/investment/gov ( AD )
consumer confidence
Interest rates
Wealth
Income taxes
Level of household indebtedness
Future price level expectations
business taxes
Business confidence
Interest rates
Technology
Corporate indebtedness
Legal institutional changes
political priorities
Deliberate efforts to influence AD
National income abroad changes
Exchange rates
Trade policies or protection
AS
Total quantity of goods and services produced in an economy over a particular time period at different price levels
SR vs LR in macro
Micro : ST is period of time where FOP is fixed (only one at least)
Macro: SR = period of time where prices of resources are roughly constant or inflectible (do not change much in response to D/S)
LR = period of time when prices of all resources are flexible and change along with changes in price levels
therefore
Upward sloping because price level rise SR while resource price fixed so become more profitable to increase production
Cause of SRAS shift
wage changes
Non labour resource price
Indirect taxes
Subsidies
Supply shocks
LRAS vertical (monetarist)
?
Eliminating recessionary gap — with assumption of resource price flexibility
SR: R prices fixed — profits increase when demand increase and price increases
Supply more
LR: wages flexible— resources more expense as general price levels rise
Higher COP — so SRAS decreases
Keynesian outlook
assumes long term factor prices are sticky downwards — won’t fall during recession
As spare capacity reduces- prices spike exponentially because can increase employment without needing to increase prices to attract FOP like workers
Long term AS changes
increase in Q of FOP
Increase in quality of FOO
Technology improvements
Efficiency
Institutional changes
Wages / fixed
Price of labour —
rigid because
labour contracts
Min wage legislation
Trade unions
Effect of worker morale
GDP
total value of goods and services produced within and economy in a period of time
Circular flow of income model
Illustrates relationships that help us to understand an economy , representing the flows of money , g/s and FOP between different economic agents like households , firms, financial markets, gov and other counties
Firm→ households
food and shelter
Goods and services
Interest Rent wages profit
Household→ firms
Capital land labour enterprise (FOP)
Household→ x →firm
Financial market
savings - investment
Gov
Taxes - gov spending
Other countries
Imports - exports
National income accounting
Def: measurement of nations economic activity = aggregate output
Methods:
Expenditure method : CIGnetX
Income method : all income earned by FOP over a year
Output method : value of all final goods and S produced over time (final”” to avoid double counting)
Issues
doesn’t account for price level changes
Population
So use PPP/ capita
Trade benefits
choice
Lower prices
Leave security
Efficiency production
Allocative efficiency
Innovation, new ideas, new tech
EoS
Acquiring needed resources
ForEX source
Specialisation
Growth
Absolute advantage , comparative advantage , limitations
(Assumptions: / limits:
transport costs ignored, FoP fixed (location, mobility, and Q), full employment, free trade, homogenous products)
)
production of good through use fewer resources than another country ; more efficiently
Produce good at lower opp cost than another country
Tariffs
taxes on imported goods
Regressive , foreign producers worse off
Domestic better off ,
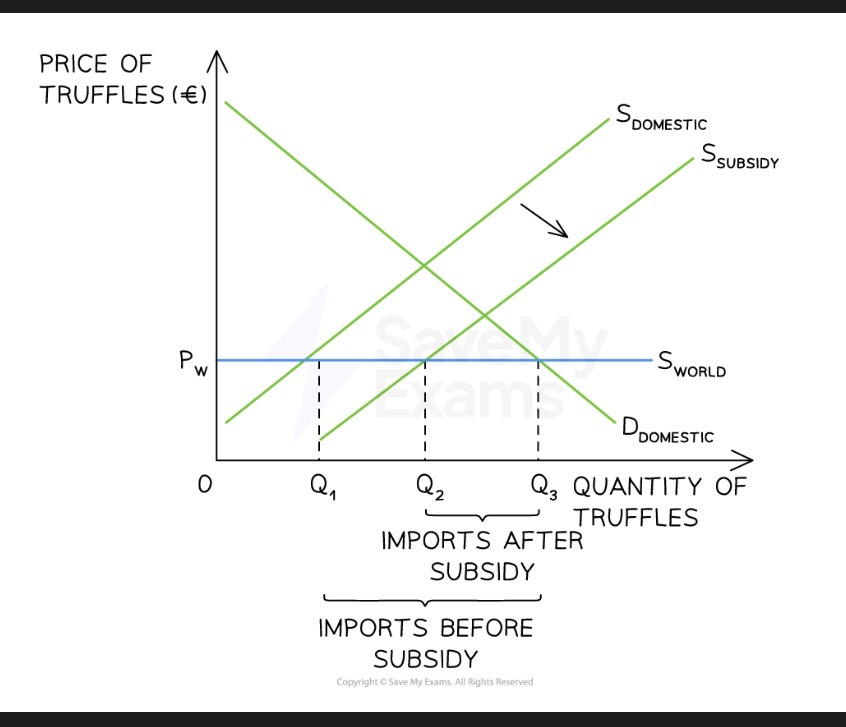
Import quotas, production subsidies , export subsidy
Legal limit to Q of G imported over particular time period
Payment by gov to firm for each unit of output produced
Protect domestic firms competing with imports — could too extreme cause surplus that is exported (bad bad for allocation)
Protect exporting firms— paid per exported goods
Producers benefit, domestic employment increases
Consumers pay higher prices, negative gov budget, taxpayers lose (pay)
Administrative barriers, trading blocs, preferential trade agreements, types of trading blocs
go through customs, inspections , package reqs, regulations standards
when group of countries agree to reduce tariffs and other trade barriers in order to free(er) trade and cooperation
1. Free trade area: mutual free trade between members , NAFTA
2. Customs union, CEFTA
FTA and common external policy
3. Common market, EU
FTA and Customs union and removal of all FOP movement barriers between members
agreement between two or more countries to lower trade barriers on particular products between them
Trade creation , diversion
customs union entry leads to production transfer of good to low cost producers from high cost
Entry to customs union causes production of good to transfer from low to high cost producers
Monetary union
common market with common currency and central bank
WTO
Organisation for liberalising trade
Objectives:
trade dispute handling
Negotiations
Agreements
Policies
Technicals assistance and trade
Bad
economically powerful agendas / interests
Coalitions
Influence
Assumes equal development apart from least developed
Exchange rate, freely floating, causes of changes
price of currency in terms of another currently (buy currency— demand, pay using currency — supply)
Exchange rates determined by market forces (d/s), no gov intervention
Causes of change:
exports
flows of remittances
Imports
Relative interest rates
Relative Inflation (imports/ex)
Investment in out
Changes in income (M/X affected)
Speculation
CB intervention using foreign currency
Affects of ex rates
Exports
+= expensive, reduce demand, imports cheaper
– = opposite
Unemployment
+= reduce AD reduce employment, compete with imports industries worse off, but reduce CPI so reduce , depend wether AD or SRAS more affected
– = AD increases , dep on near potential GDP — DPI , opposite, importing competition benefit
Economic growth
+ reduce AD bad, but SRAS increases , CPI decreases , help lower inflation good
– AD rises, CPI increases , inflation bad , export industry growth — LRAS AD AS
Forgein debt
+ easier to pay debt back
– harder to pay back
CABOP
SPICEE
tourism
+ cheaper holidays for domestic
– opposite
Depend on : business cycle stage, protecrionism, duration, extent, reliance on MX, PED, time lag
Pegged exchange rates , fixed, policies to maintain
fix current to major current like USD
Controlled by central bank intervention to maintain exchange rates
using sale and buying of forex
but reserves can run out
Policies
upward: sell own currency
Downward:
sell forex buy own,
interest rate changes,
Attract foreign investments , reduce domestic citizens withdrawing money
But could reduce economic growth , employment
borrow form abroad,
Use borrowing to sell for domestic
But interest payment on debt , increase debt
limit imports,
Trade protection reduce imports or contractionary policy — can’t afford imports
But affect growth incomes and downsides of trade barriers
impose controls on exchange
Devaluation revaluation , managed exchange rates ,
decision. By gov to lower international price of currency
Opposite
exchange rates determined by market forces but with periodic intervention to reduce short term fluctuations
Overvalued and undervalued currencies
over: value is maintained higher than market level
Imports cheaper,
Exports more expensive , Unfair competition for domestic , Worsens current account balance
Under: lower
Exports cheaper, Promote employment and EG
Unfair competitive advantages for domestic, misallocation of resources, retaliation, imports expensive
BOP
record of value of all transactions between the residents of one country and residents of all other countries in world over given period of time
Current account
Measures of flow of funds from trade in GS, plus net investment income flows and net transfers of money (aid grants and remittances)
G, S, income, current transfers
Capital account
Inflows - outflows of funds for capital transactions in NON PRODUCED NON FINANCIAL ASSETS
Financial account
FDI, portfolio, reserve assets, official borrowing
Marshall Lerner condition and j curve
Deval or depre may not change CABOP due to low PED potential
depreciation success at correcting CA deficit only if : PED X+ PED M > 1
Due to time lag mostly reaction , unresponsive in short run
Method to correct P CAD
Expenditures reducing policies
Exp switch: depreciation
Supply side to inc competitive
Exp Switching policy: trad protection
Sustainable,e development , poverty reduction → pollution
preservation of environment and economy for current and future
SDGS; 17 goals developed at UN on sustainable development n 2012
poverty cause of environment destruction due to over exploitation by the poor of scare env resources (over use of CPR)
ED vs EG
EG: increase win output (real GDP) and incomes over time, measured on per capita basis (shown on PPC or monetarist/)
ED: process that leads to improved standards of living for population as who,e — poverty, access to basic needs, gender equality, employment, inequality income
Indic ED indicators,
GDP GNI —PPP
Health
Life ex , infant mortality, maternal
Education
Literacy rate, pri school enrolment, sec
Econ Inequality
Gini coefficient, poverty line, min income, lorenz curve
Social inequality
Fertility rate, nourishment, life expectancy ineq, etc
Energy
Income spent on elec/fuel, energy use , renewable energy, pollution
Environment
Co2, species prev, ozone, water use,
Composite indicators
HDI: life expectancy, mean/exp years of schooling, GNI per cap + inequality adjusted versions
Gender equality index
HPI;
Poverty cycle

Barriers to EG
low level human capital
Infrastructure access
Appropriate technology
Inequality wealth
International market (Trade barriers)
Primary prod → price volatility due to low PES< and low YED with growth- incomes grow mean demand grow less?, p;rices don’t grow , while import secondary→also developed place tariffs on pri producing
Informal economy
Capital flight
Indebtedness
Landlocked / geography
Diseases / climate
Political social (investment )
ED/G starts : foreign aid
Foreign aid : transfer of funds or GS to developing countries with main objective to improve econ/social/poltiical — concessional (beneficial than market alone, non-commercial)
Poverty cycle
basic goods
Income distribution
Economic growth
SDGs goals
Debt trap
BUT
tied aid, Conditional , volatility and unpredictability , substitute, not reach most need, corruption,
Official development aid — political strategic, economic, humanitarian
NGO (Private aid)
Raise public awareness , expertise and advice, innovation,
BUT: small size and weakness typically, loss of independence, attract personnel away from gov , challenge to state authority,
Phases of trade liberalisation
Inward FDI as EDEG stray
benefits : local skills and tech, tax rev, industry local, unemployment , economic growth, offset current account , increase savings investment
Drawback: income not all remain, compete with domestic firms, benefit local suppliers not, environment, dependency, power to promote policy against interest local
GDP GNI def
GDP ndicator of the Value of output produced in a country in a year
GNI: income received by residents (GDP+ net income also made abroad)
Pot main differences reasons
remittances, repatriation