Representing Variation Graphically
1/26
Earn XP
Description and Tags
Didn't include calculations for spearmans coefficient n the t test.
Name | Mastery | Learn | Test | Matching | Spaced | Call with Kai |
|---|
No analytics yet
Send a link to your students to track their progress
27 Terms
When studying variation, what do scientists take measurements of?
Different characteristics within a species.
To allow reliable conclusions to be made, what do scientists need to collect?
Measurements from large numbers of the population. In order to analyse and interpret this data it can be represented graphically. This allows any patterns to be seen clearly.
What is a characteristic that can only result in certain values said to show?
Discontinuous (or discrete) variation. There can be no in-between values. Variation determined purely by genetic factors falls in this category.
What are characteristics that show discontinuous variation controlled by?
Genetic factors.
How is discontinuous variation usually represented?
A bar chart, but a pie chart may also be used.
What is a characteristic that can take any value within range said to show?
Continuous variation. There is a graduation in values from one extreme to the other of a characteristic - known as a continuum.
What are characteristics that show continuous variation controlled by?
A number of genes. They are also often influenced by environmental factors.
How is data on characteristics that show continuous variation collected?
In a frequency table. These data are then plotted onto a histogram. Normally, a curve is then drawn onto the graph to show the trend.
When continuous data are plotted onto a graph, what do they usually result in?
The production of a bell-shaped curve known as a normal distribution curve. The data is said to be normally distributed.
What are the characteristics of a normal distribution?
The mean, mode and median are the same.
The distribution has a ‘bell shape‘ which is symmetrical about the mean.
50% of values are less than the mean and 50% are greater than the mean.
Most values lie close to the mean value - the number of individuals at the extremes are low.
What is the standard deviation?
A measure of how spread out data is. The greater the standard deviation, the greater the spread of the data.
In terms of variation, what does a characteristic which has a high standard deviation indicate?
A large amount of variation.
What will you generally find when you calculate the standard deviation of data that display a normal distribution?
68% of values are within 1 standard deviation of the mean.
95% of values are within 2 standard deviations of the mean.
99.7% of values are within 3 standard deviations of the mean.
What is the equation for standard deviation?
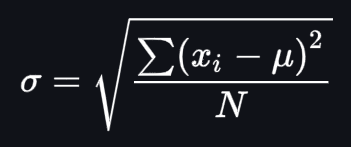
What is ∑?
The sum of.
What is X?
Value measured.
What is X ¯?
Mean value.
What is n?
Total number of values in the sample.
How do you calculate the standard deviation?
Calculate the mean value.
Subtract the mean value from each measured value.
Square each of these values.
Sum each of these values.
Divide this value by the sample size minus.
Find the square root of this value.
What other statistical tests are there?
Students t test.
Spearman’s rank correlation coefficient.
What is the students t test used to compare?
The means of two data values of two populations.
What is Spearman’s rank correlation coefficient used to consider?
The relationship between two sets of data.
If two sets of data are related what are they set to be?
Correlated.
What are the different types of correlation data can show?
No correlation.
Positive correlation.
Negative correlation.
What is no correlation?
When there is no relationship between the data.
What is positive correlation?
When as one set of data increases in value, the other set of data also increases in value.
What is negative correlation?
When as one set of data increases in value, the other set of data decreases in value.