global climate change 3rd unit
1/34
There's no tags or description
Looks like no tags are added yet.
Name | Mastery | Learn | Test | Matching | Spaced | Call with Kai |
|---|
No analytics yet
Send a link to your students to track their progress
35 Terms

What is this image showing about major river deltas?
major rivers like ganges, yangtze, pearl river, mississippi, nile and mekong have super high population density at their deltas
deltas are 1% of earths area but hold 5% of the earths population
deltas are sinking faster than sea levels are rising due to weight and messing with sediment deposits
extreme subsidence, vulnerable to extreme weather events, urbanization ruins soils
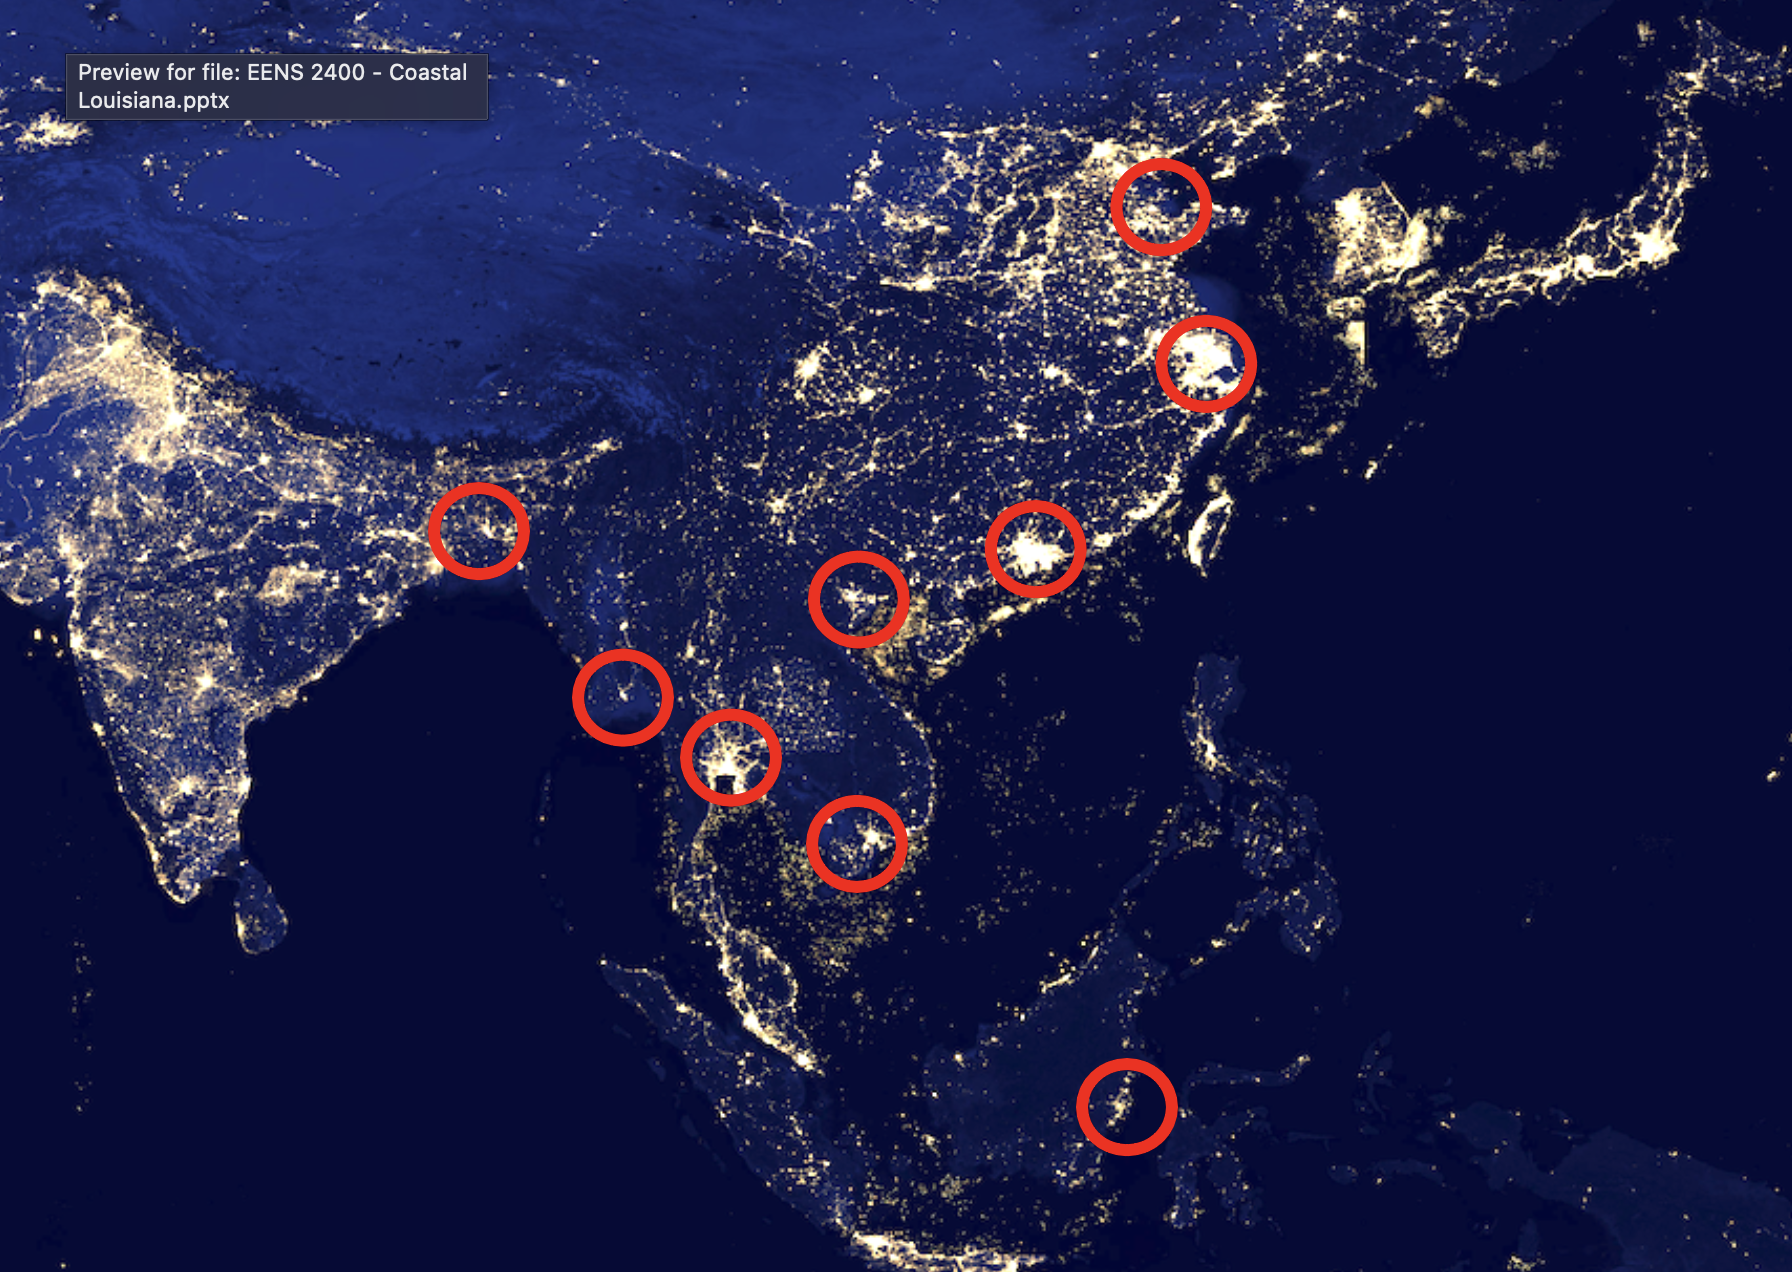
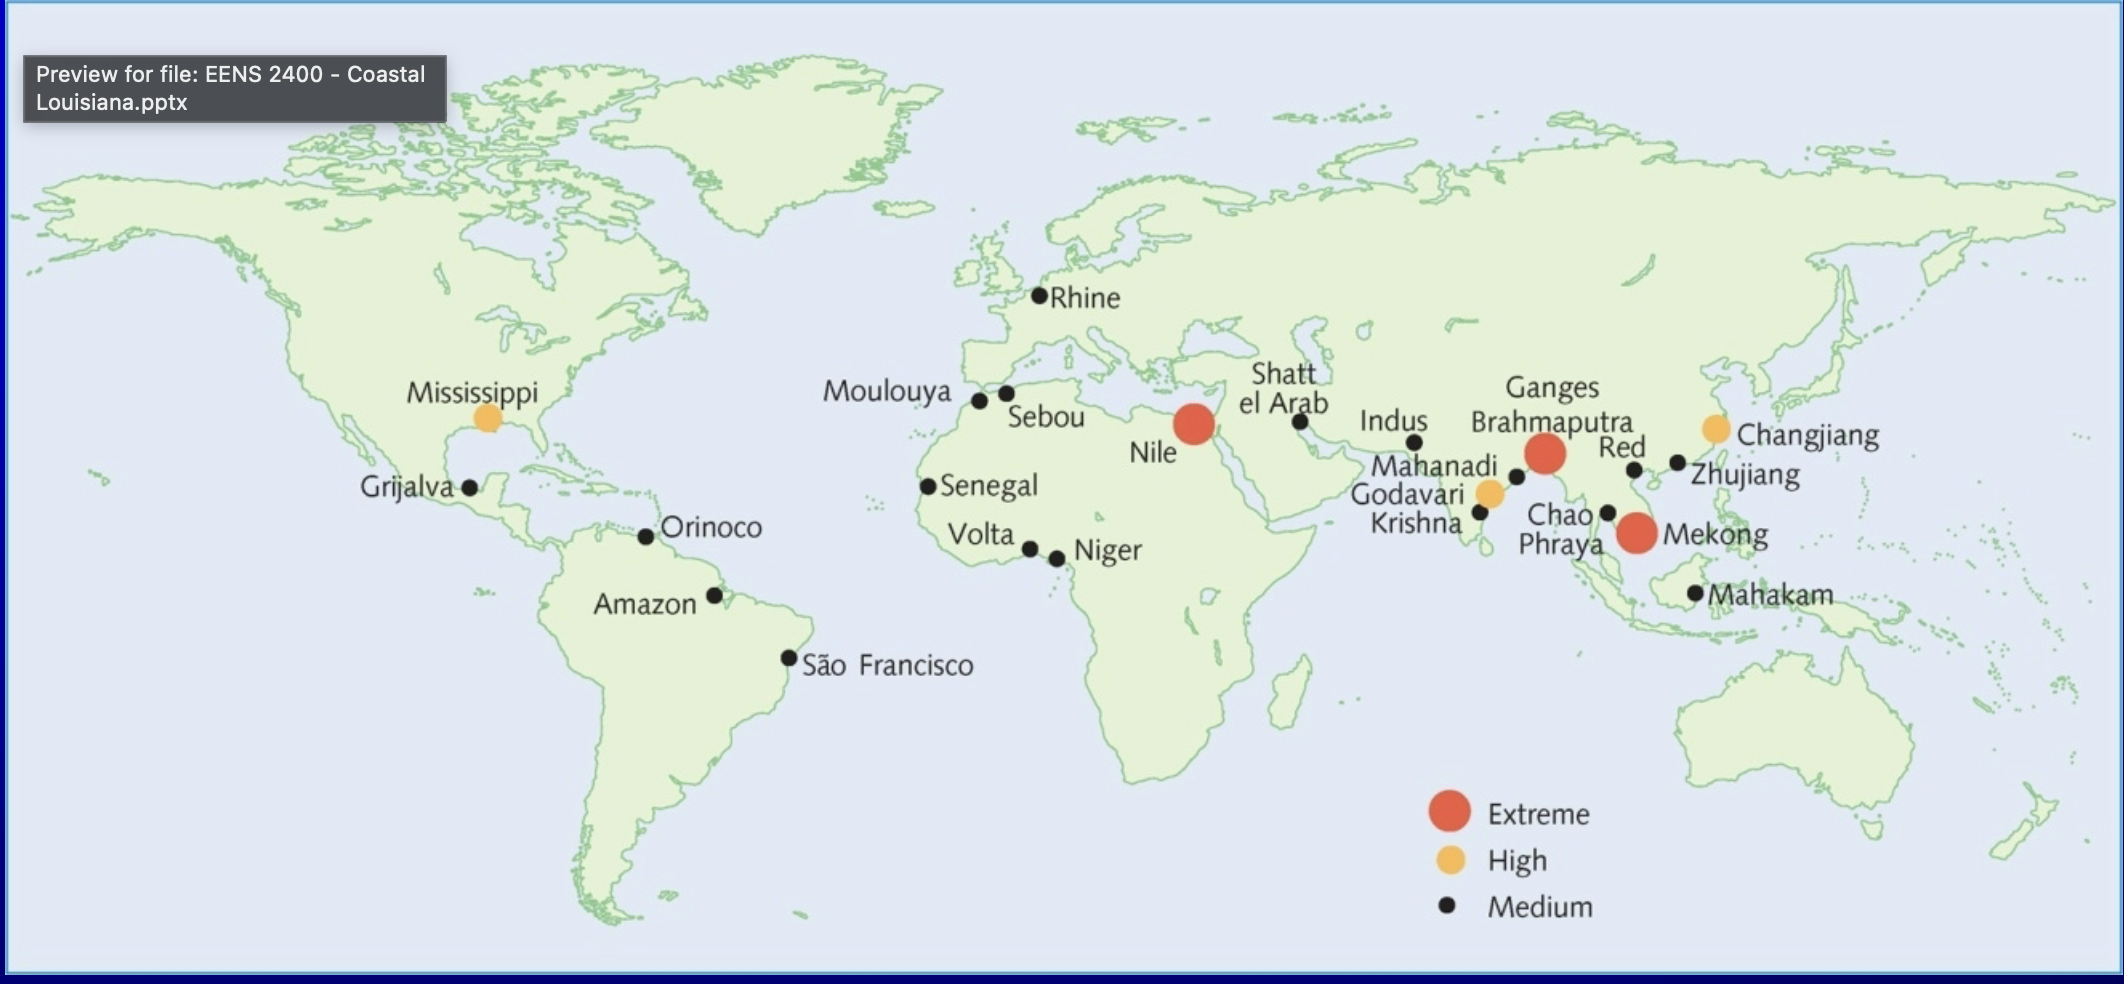
What is this showing
it is showing were the most extreme risk is for each delta, south east asia is low lying and is going to go under,
this image goes with the nightime light one, the highest populatin densisites are at deltas that are the most vulnerable

deltas
Low elevation coastal zones
So vulnerable
Accelerated sea level rise, subsidence (human induced), sediment deficit, adverse human impacts
Human induced: ground water extraction
Coastal Louisiana can be seen as the canary in the coal mine within this context, what happened here has global significance
We have lower land than other places so it is happening here

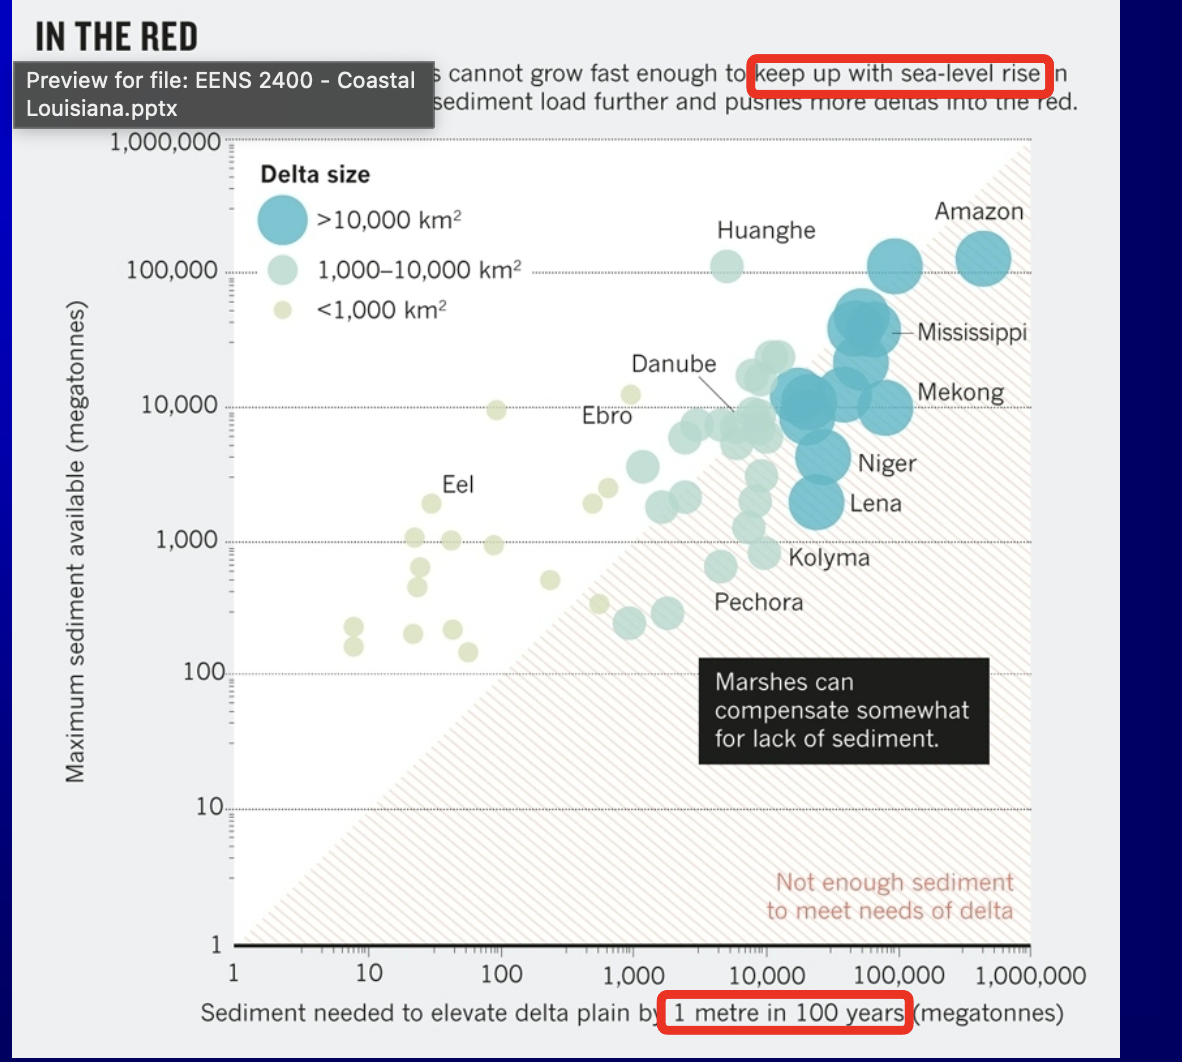
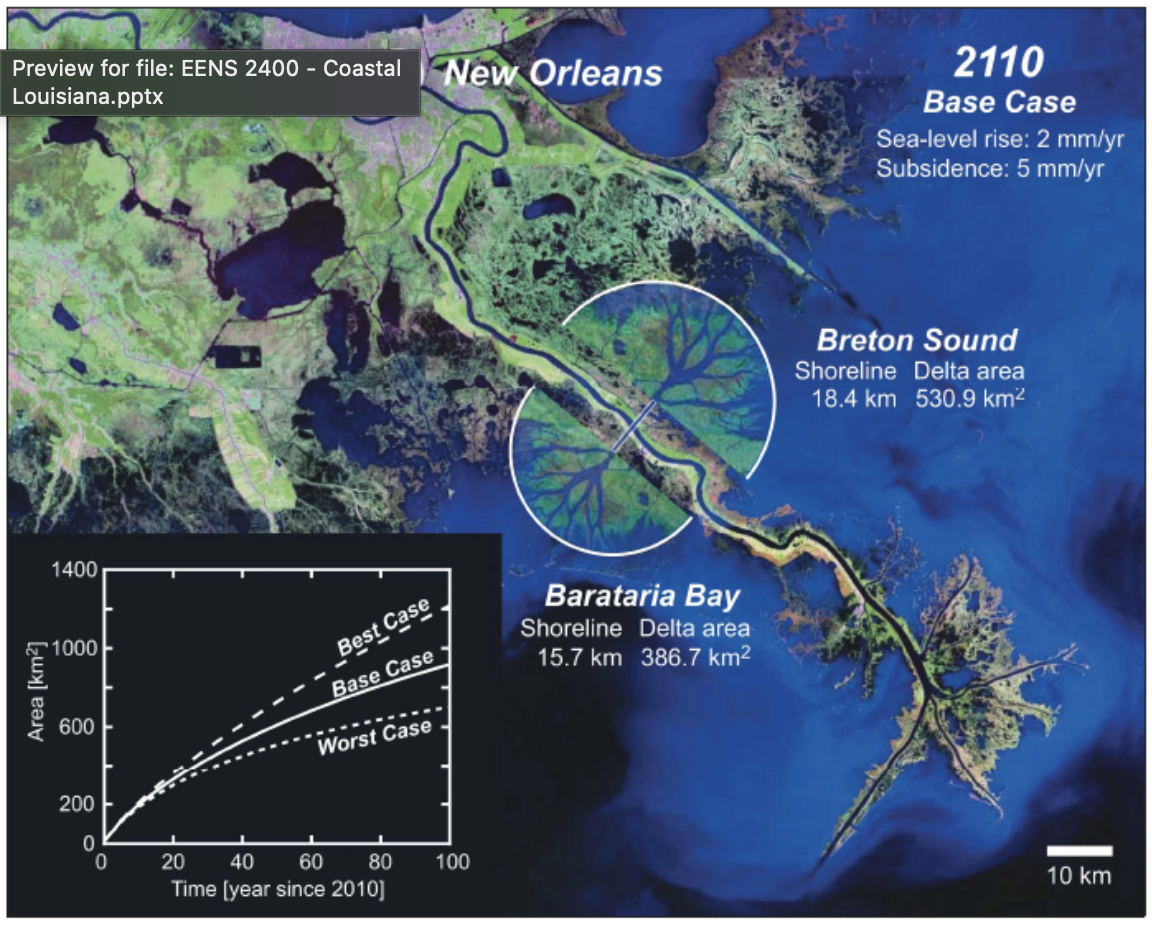
when are deltas sustainable?
Need a lot of sediment to offset delta plain loss
Circles are delta size and it maximum sediment available v sediment needed to elevate delta plain by 100 years
In any large deltas there is a deficit
If on upper left or on line its 1-1 or better so the delta is fine
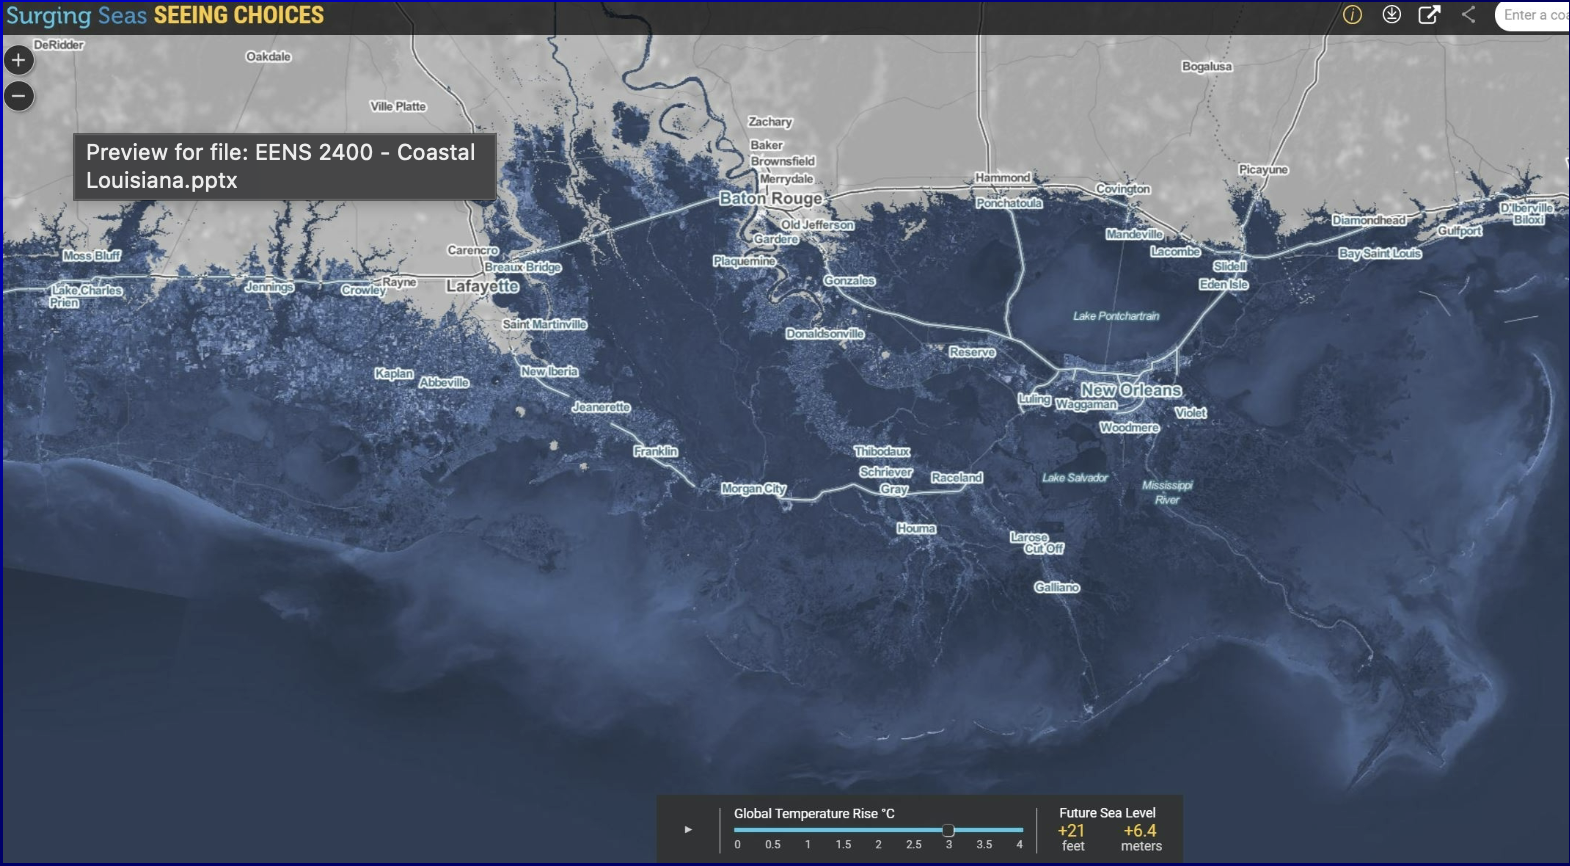
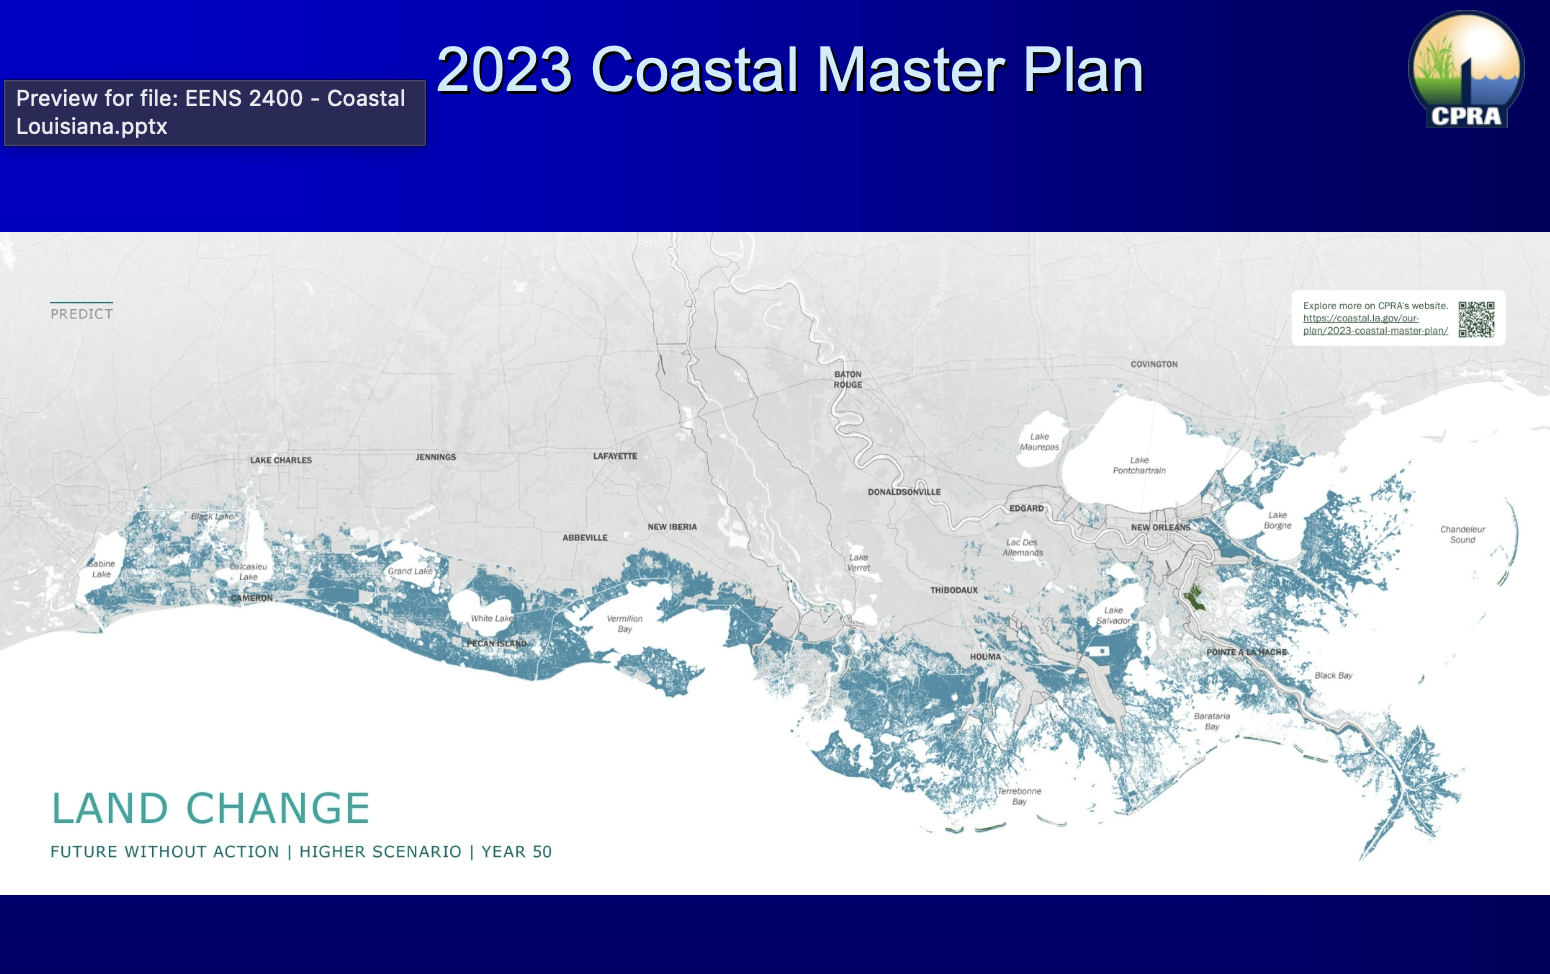
what is this showing? What is the temperature?
the prediction of sea level rise for 3 degrees celsius brings the coast line to baton rouge
we are the example


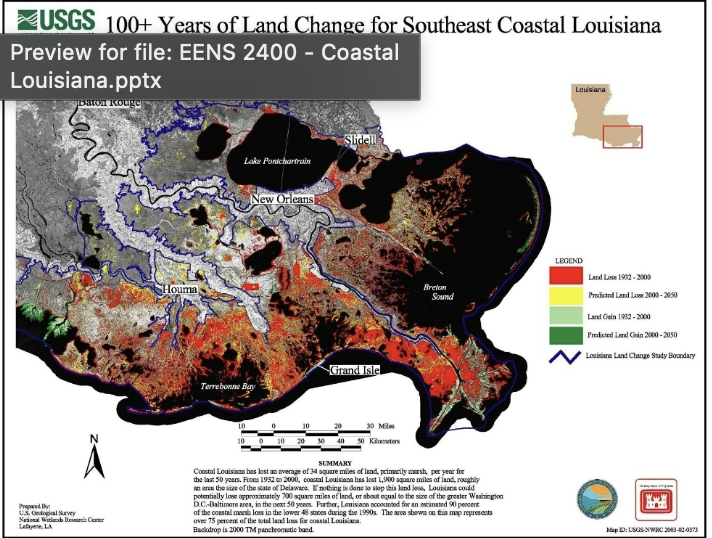
what is this showing?
over the past 100 years Current rates of loss football fields for every one hundred minutes
New delta lobes are green
yellow is predicted land loss, red is already lost, green is predicted gain
so much of it is wet land loss which ecological goods and services are valued at 200,0000 dollars ha-1 yr-1
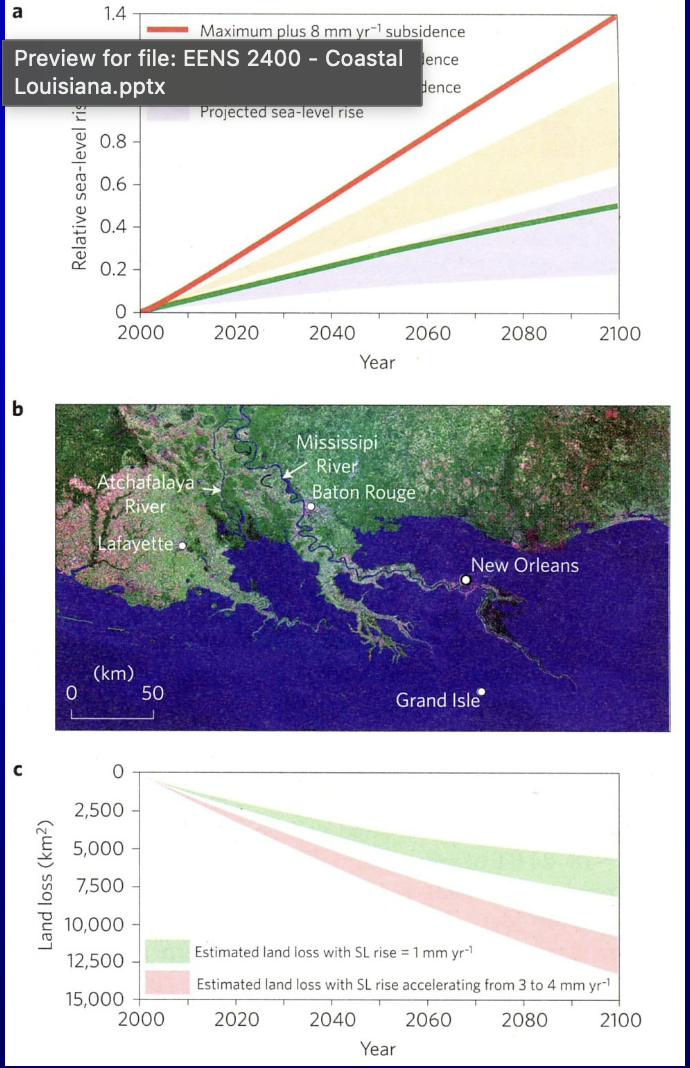
What are these projections?
a. relative sea level rise projections through 2100
maximum at red predicts 1.4 meters a year when adding 8mm/yr of subsidence
projected yellow area is with 5mm/yr
minimum is 0.5 meters at 3mm/yr
and the sea level rise without local subsidence, would be worse for louisiana
b. is regional map showing how bad it will be
c. is the potential loss of land
pink is the accelerating scnario 3-4 mm/yr loisiana will lose 15,000 km2 by 2100
stable is green 1mm/yr is still 7,500 km yr
basically LA going under

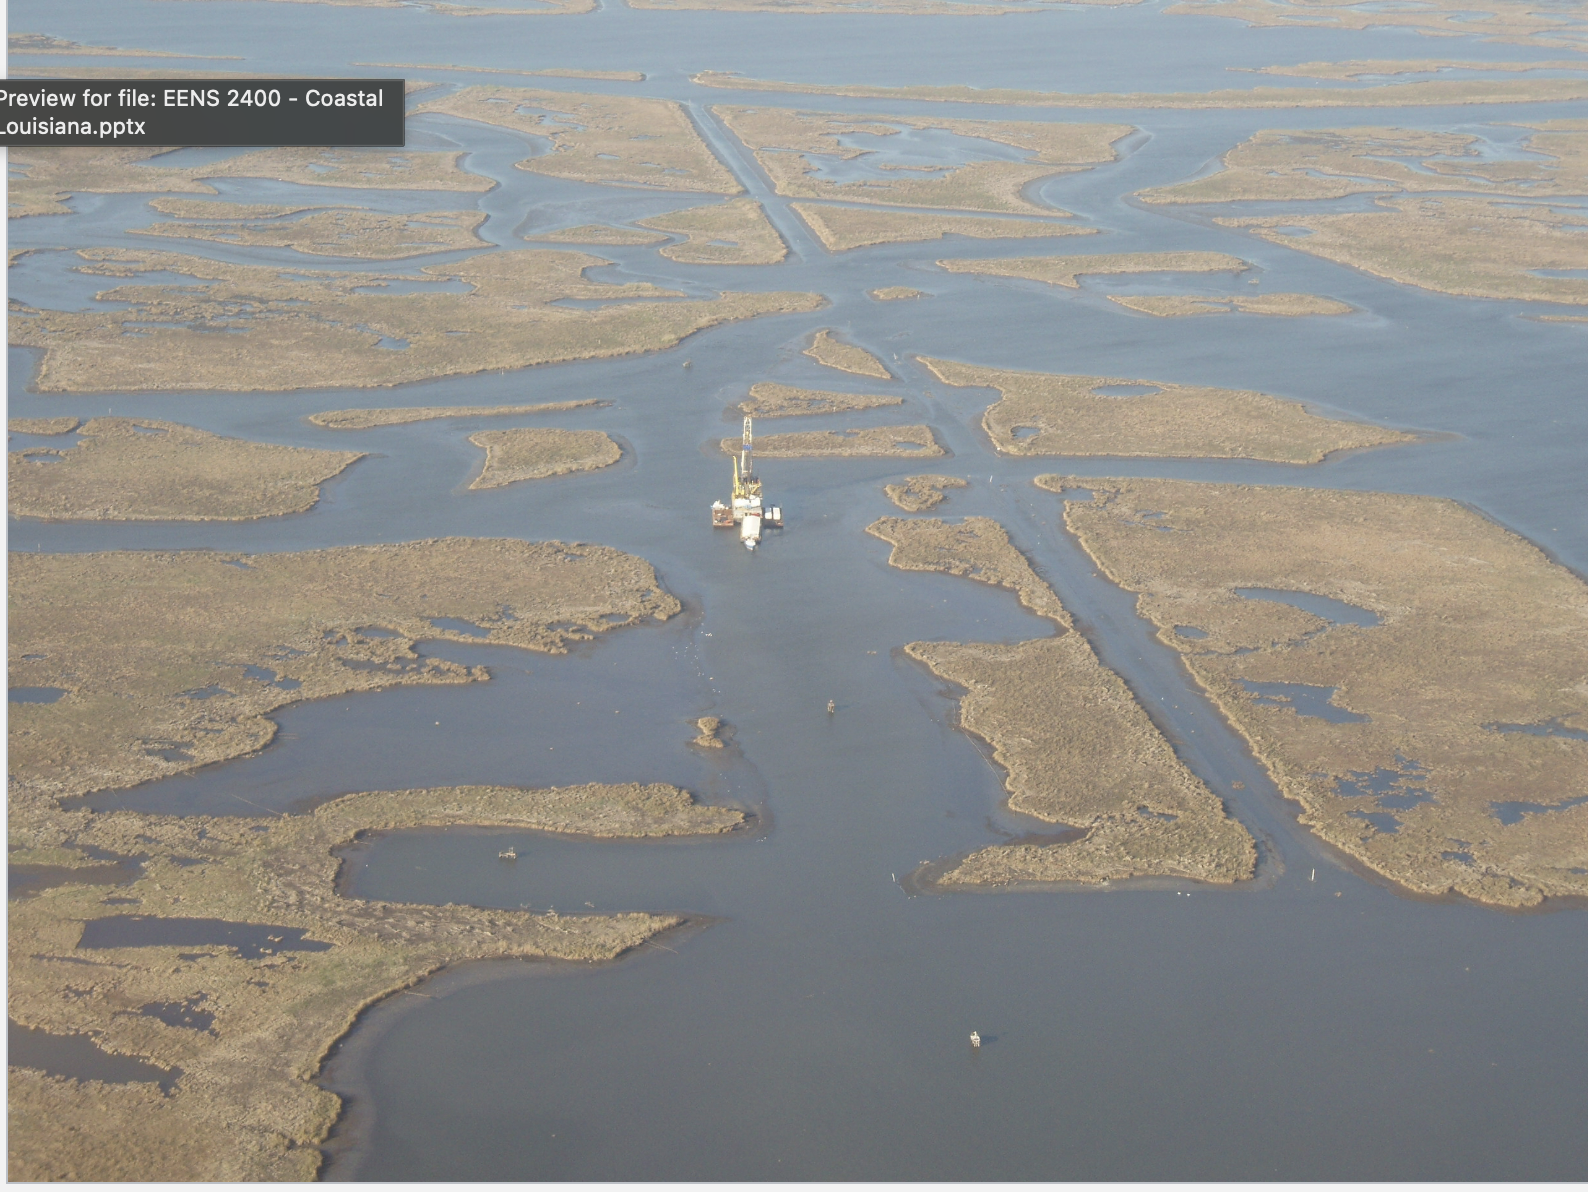
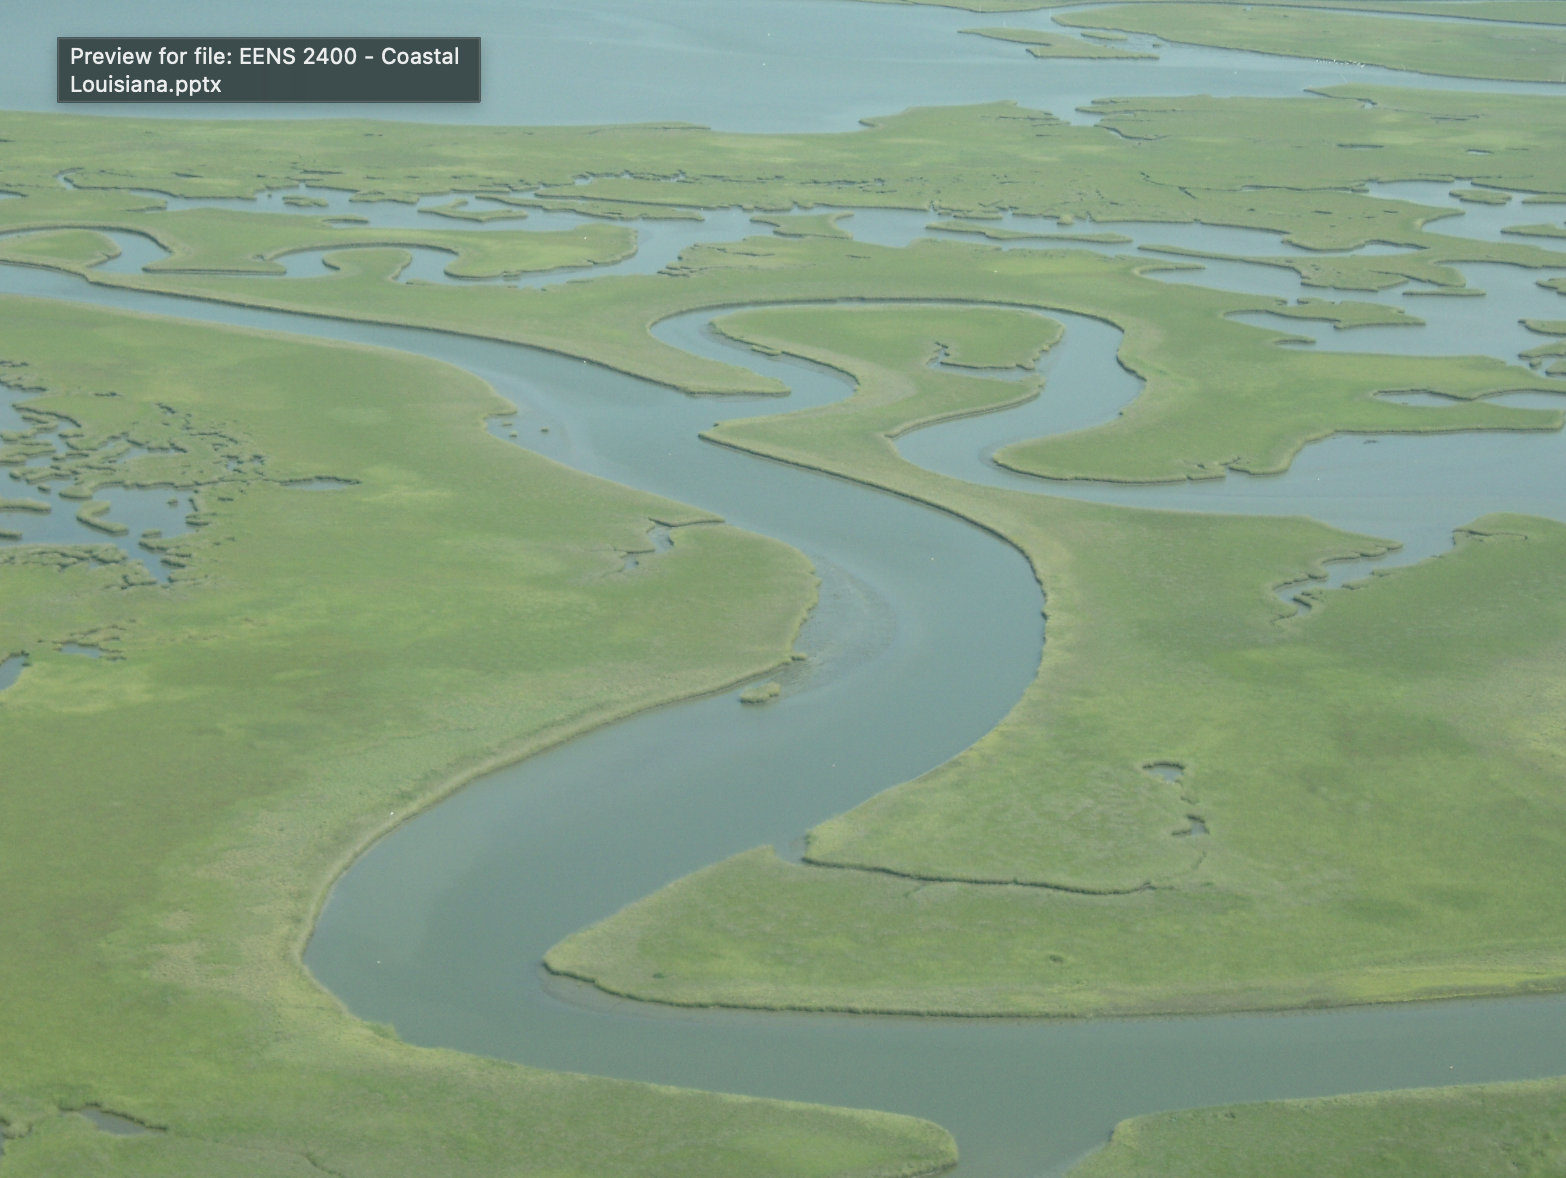
what is this showing about wetlands? non climatic cause
there is extreme wetland loss from canals dissecting delta plain
saltwater intrusion, river can’t move back and forth
Widen over time and entire areas are lost
15,000 km of canals for oil and gas and artificial levees shut down sediment deposits
45 square kilometers per year

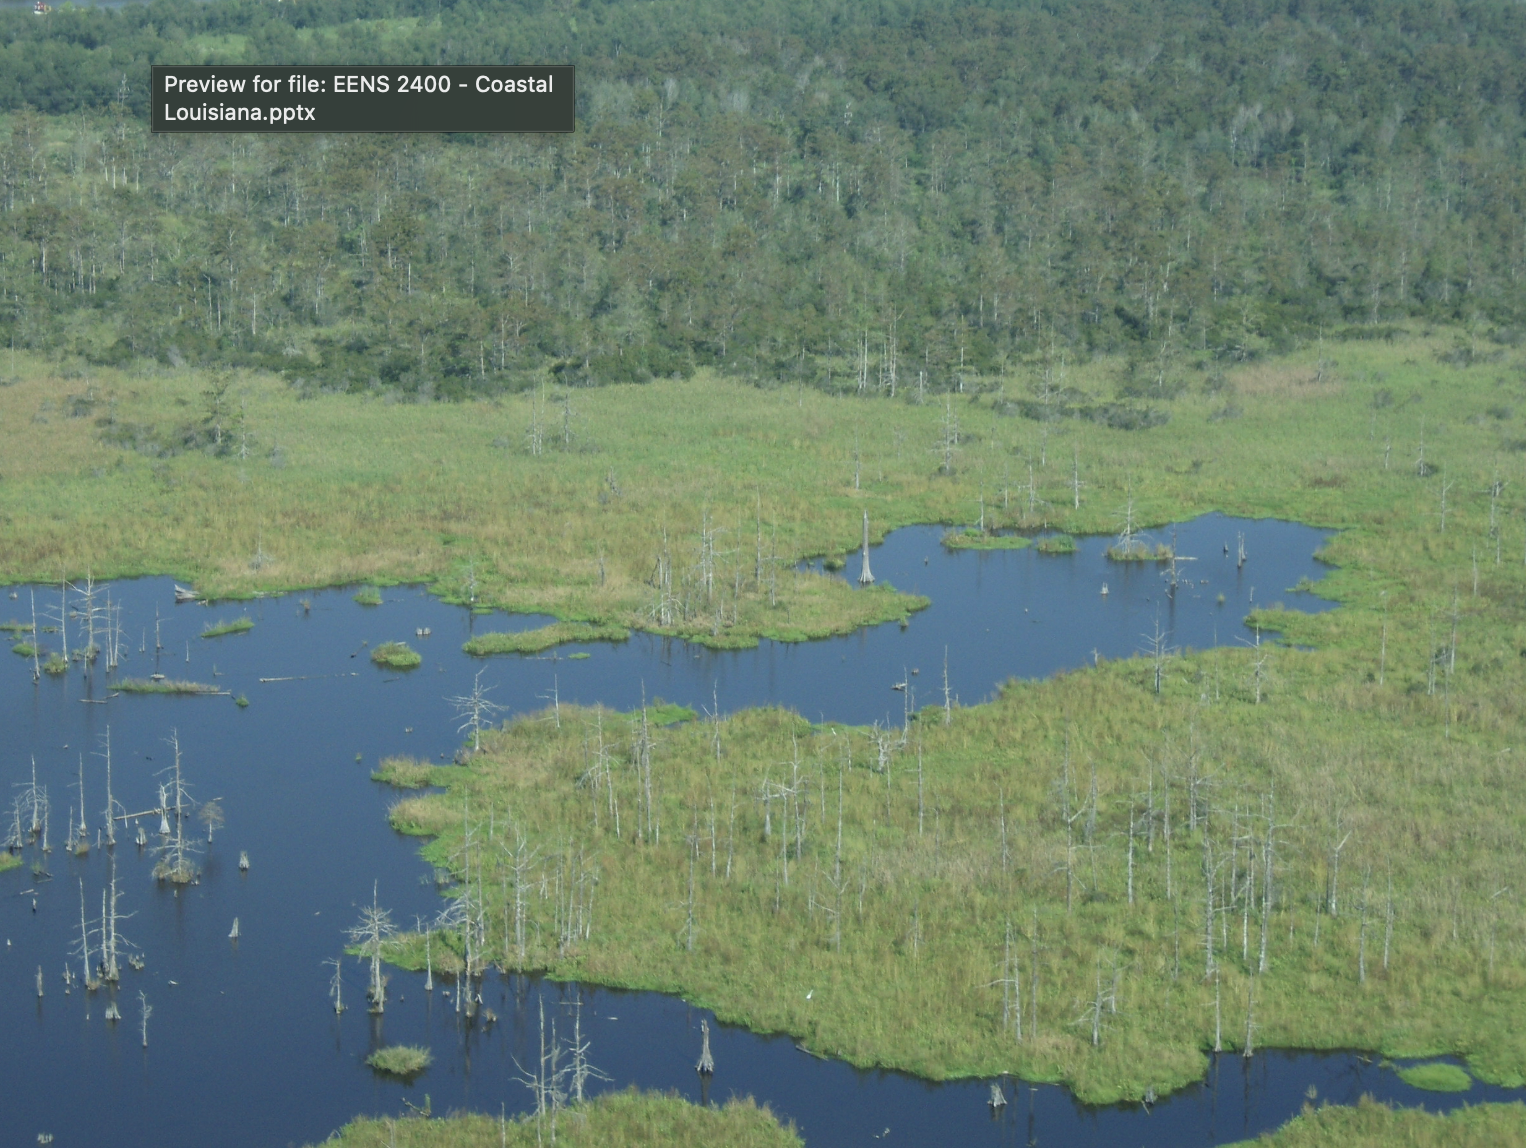
what is this showing
swamp turned to marsh
loss of carbon sequestration peat is lost, no carbon sink
can’t bounce back
much more vulnerable to storms
the front is with action, the back is without action. Coastal Master Plan does what for us?
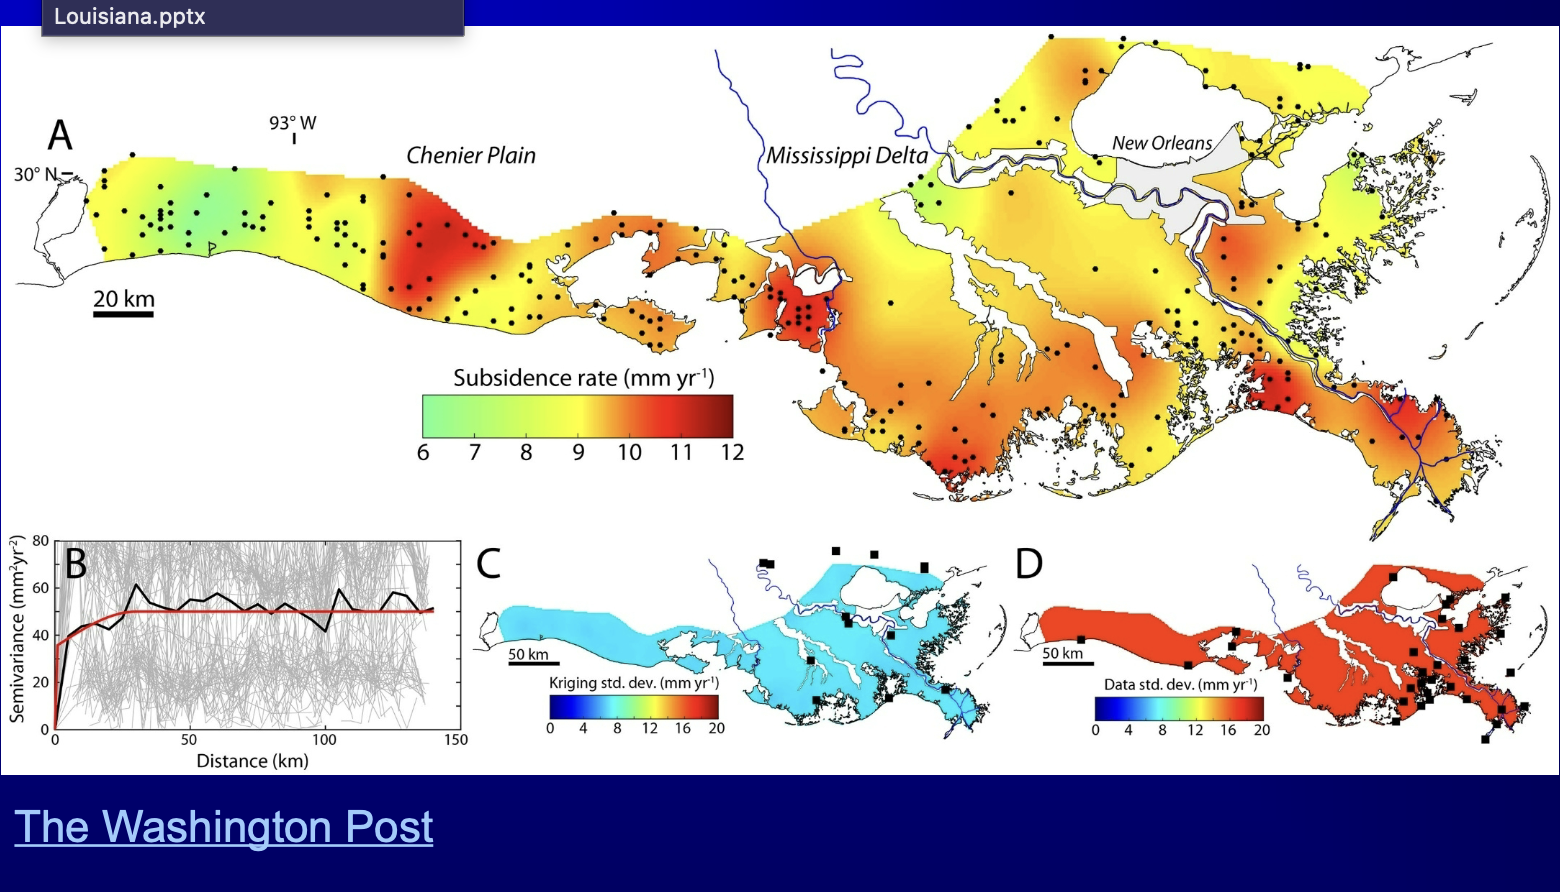
What is this new subsidence map showing us?
9 mm/yr subsidence but varies by location which is much higher than other papers
implies different parts of the shoreline need more help
levees big cause
combines gps data, and rods in sediments below surface of the water measures land elevation because looks at land motions because tide gauges have too many influences


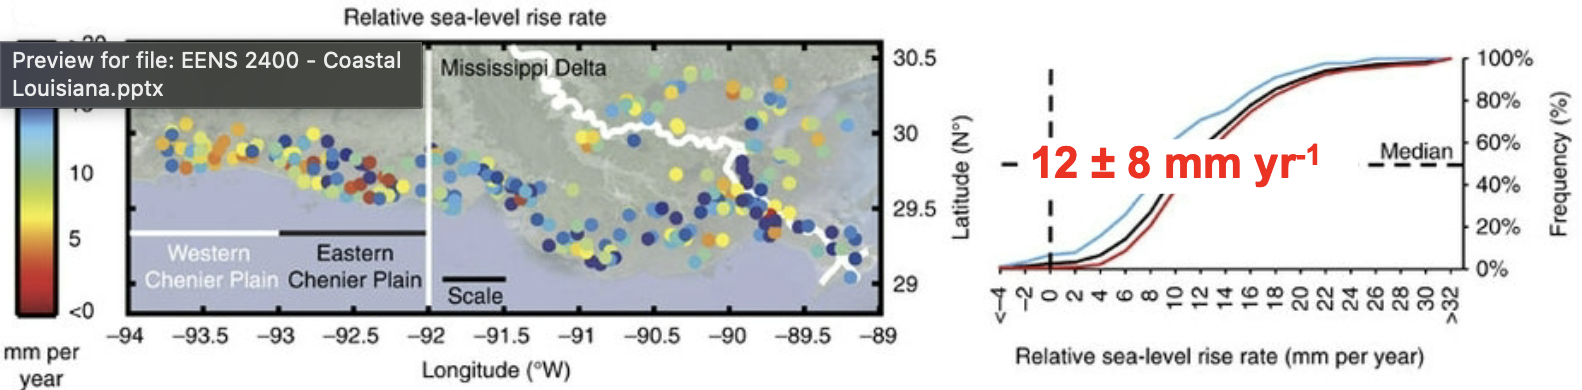
Relative sea level rise rate need what three components, what is it saying
the combination of shallow subsidence, deep subsidence (gps), and sea level rise (satellite allimetry, 2 mm/yr)
regional variance: mississippi delta has a higher rslr driven by sedment compaction and subsidence compare to chenier plain
graph on right shows that 80% of the locations that were studied have a median rslr of 9mm/yr
huge amount mississippi delta is going to experience extreme rates of 20 mm/yr way higher than global average
low tidal range in the gulf of mexico makes la really vulnerable since we are really low
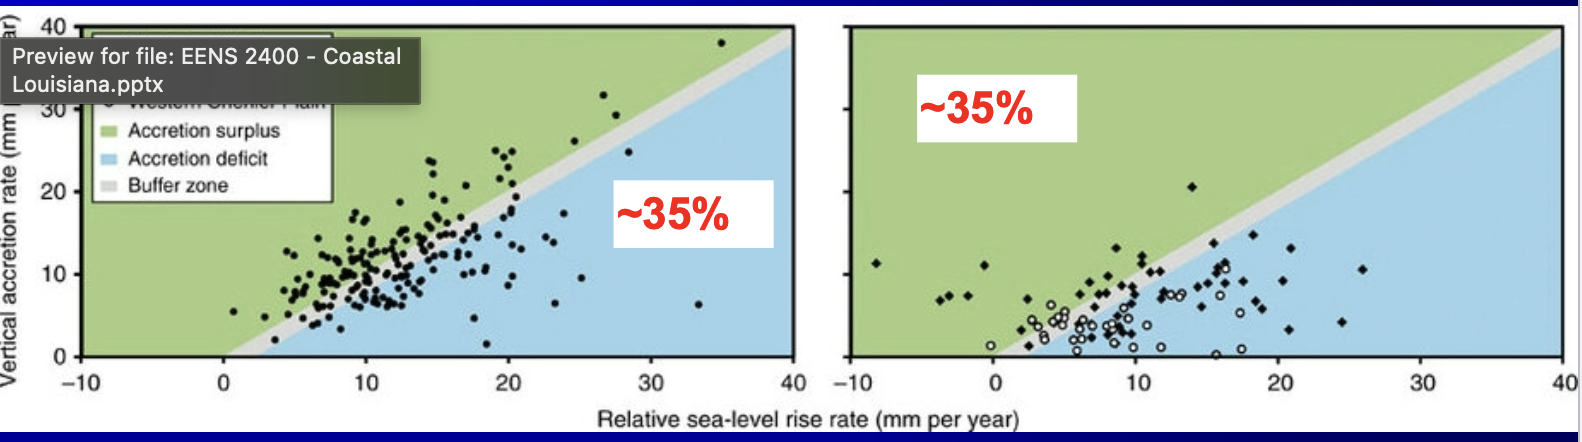
relative sea level rise ad sediment acretian (sediment build up on wetlands), vulnerability
green is ok, accretian surplus
blue bad accretan deficit
grey is the buffer zone where 1:1 accrtian matches sea level rise
35% of of the coastal ecosystem cores are in accretian deifcit
50% of mississippi in deficit, and western chenier and eastern chenier plane


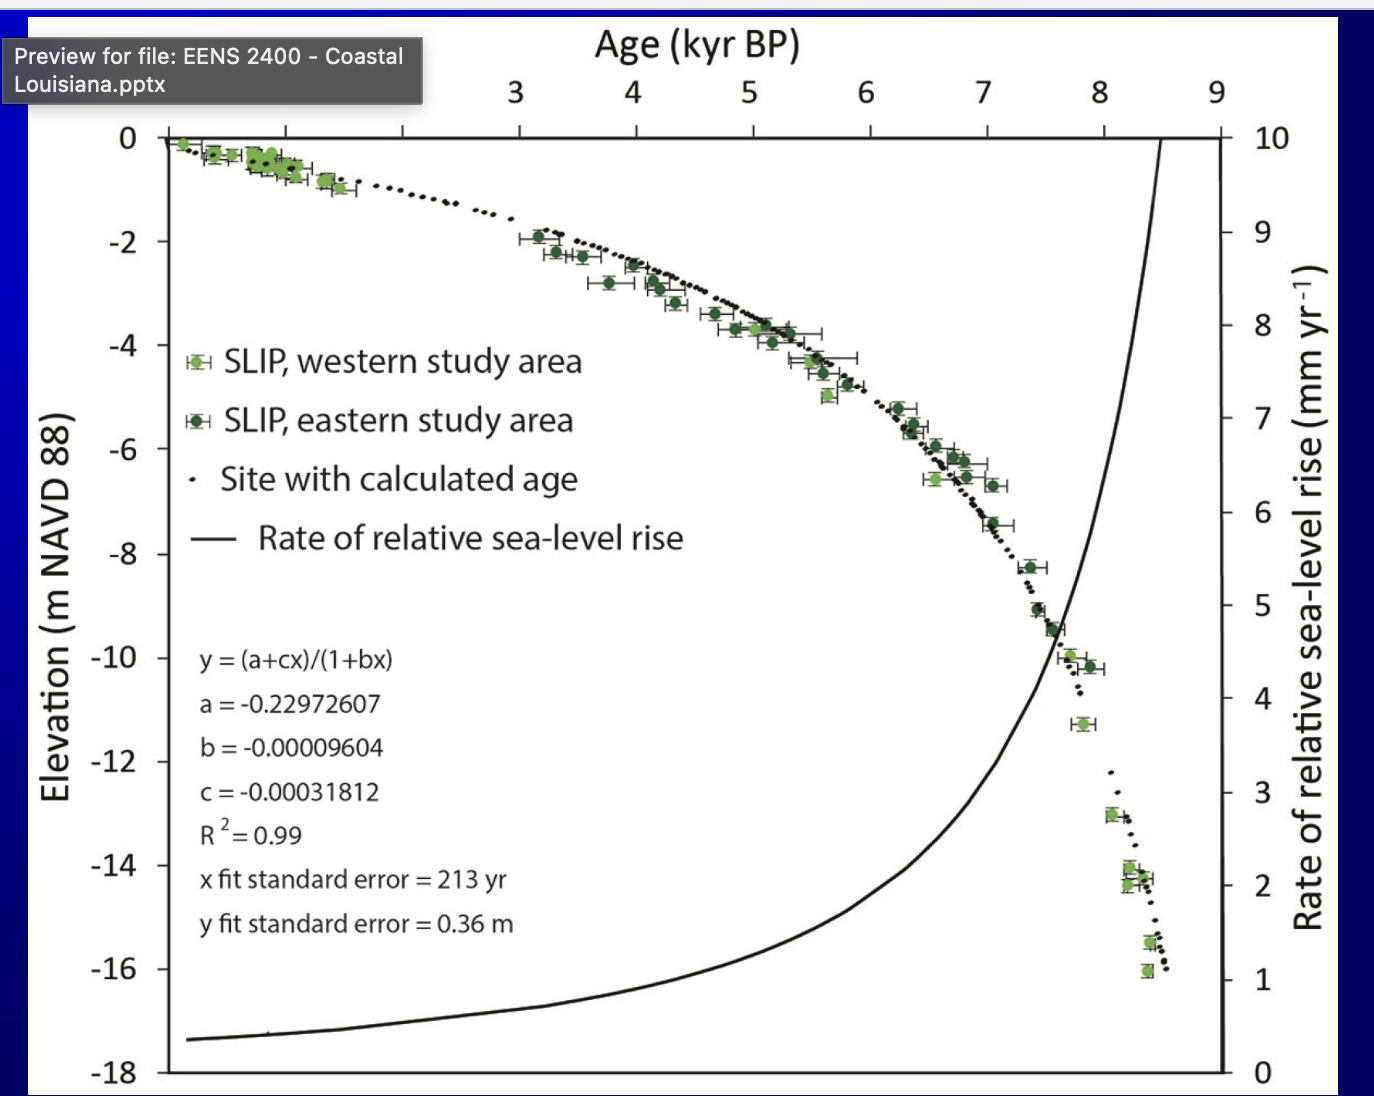
Relative sea level curve figure, three axis for the mississippi delta only
High early on and then it slowed down, because ice sheets especially great lakes dotted line
Solid line is the derivative
Then see what the marshes did and see if they could keep up, based on sediment core which abrupt marsh just flooded so it was able to persist for a little but couldn't and turned to open water so we should be scared
SLIP: sea level posistion green markers, from peat compaction free basal marsh peat
show that sea levels were much lower 8,000 years ago
tipping point done tbh

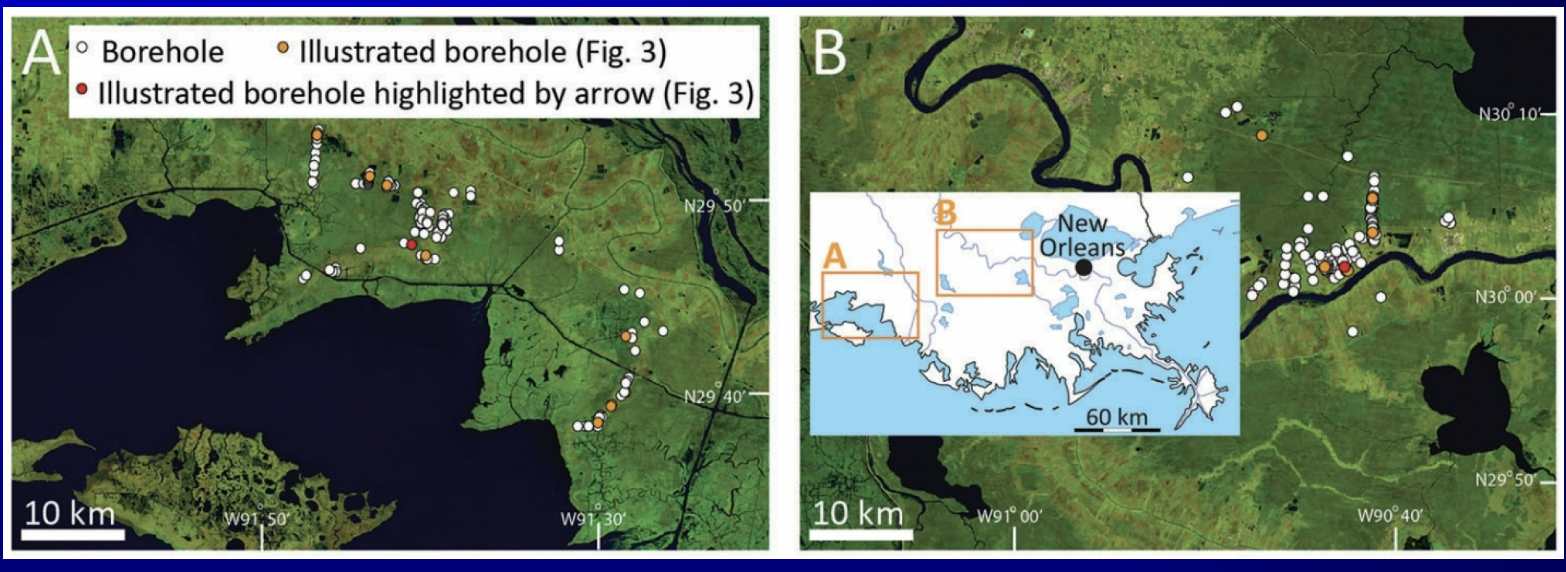
what is this?
355 boreholes for paleo-marsh analysis

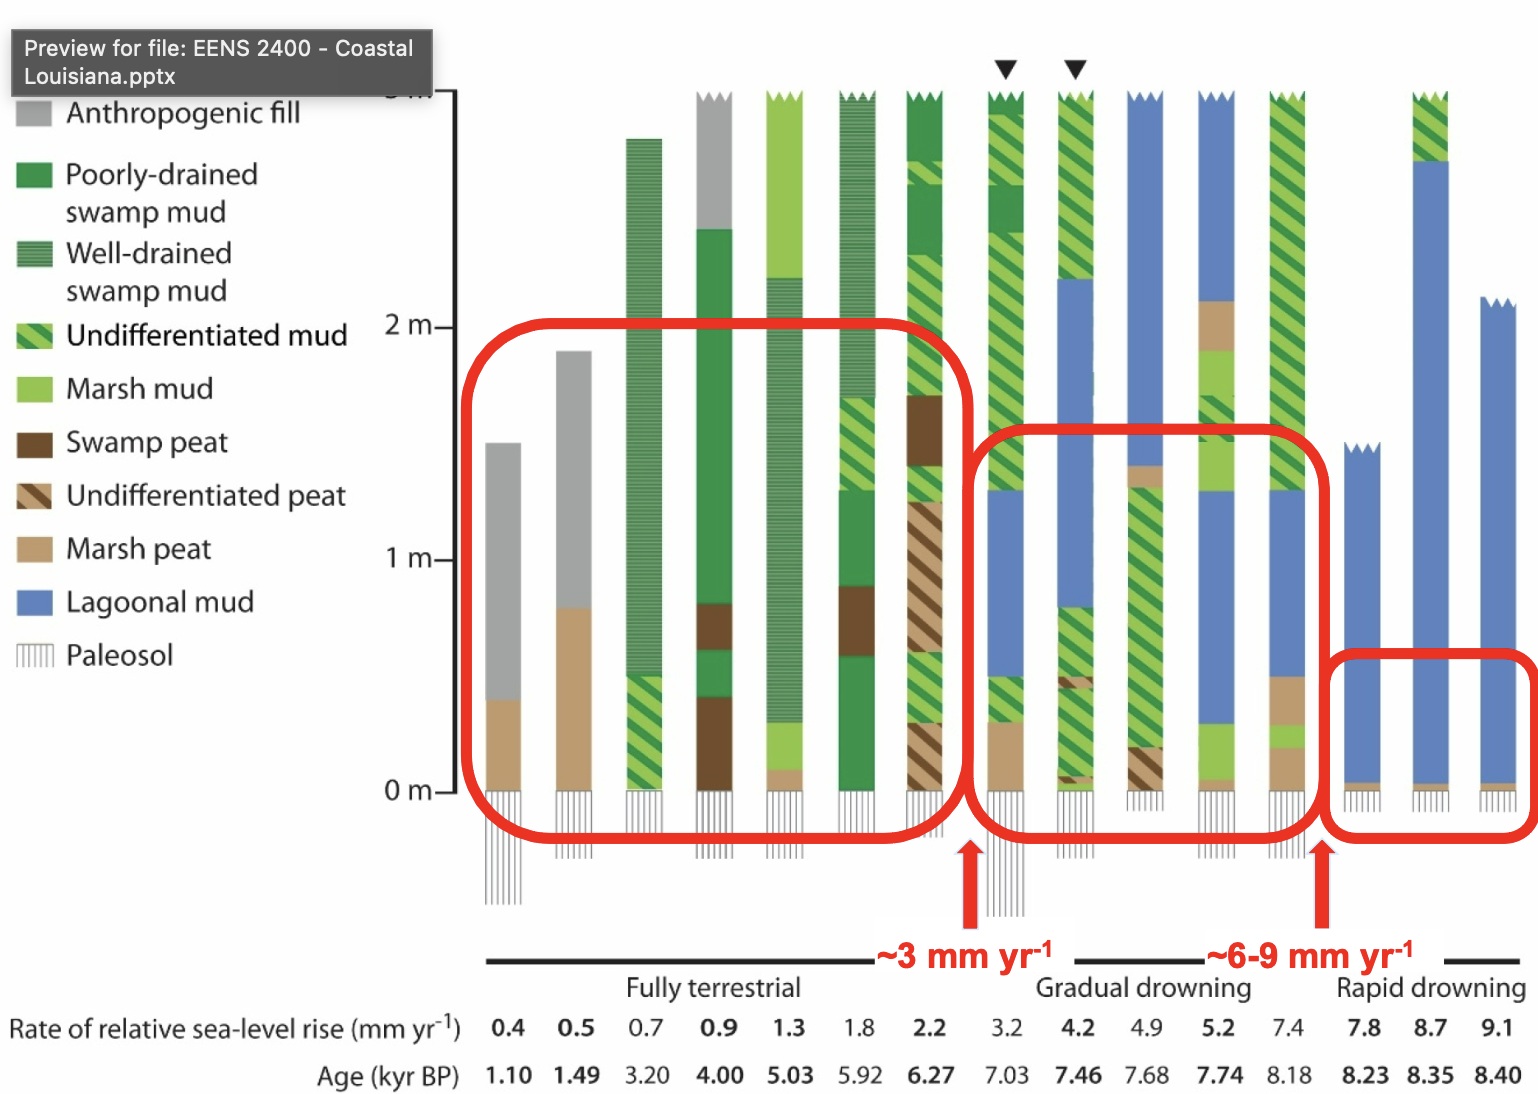
what are the 15 sedimentary logs showing RSLR
shows the transitions from a wetland paleosol to basal holocen facies
Move to right and see blue stuff showing drowning of the marshes
Takes awhile to kick in, gradual drowning
Easily going to get in to rapid drowning for us based on the cm rise waterm, terrestial plants cant keep up, total loss of coastal wetland system
Turned in to compact bars in a rectangle to show sites which remain fully terrestrial to when they drown which it is a 3mm year there is an abrupt shift, three or higher game over, right at Katrina we hit the 3mm, we've crossed the threshold
open water sediment is compact and dead compared to peat
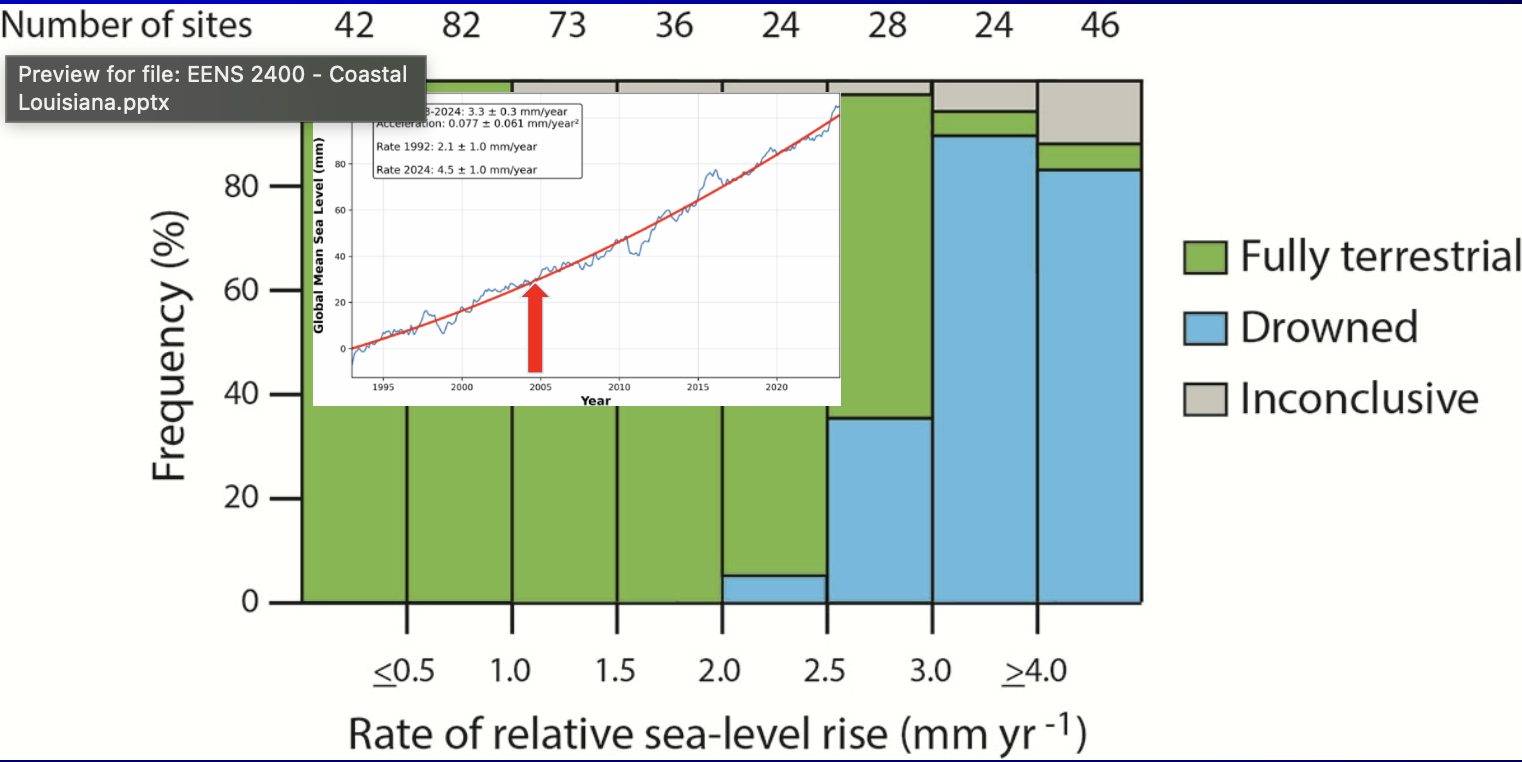
what is this showing? (threshold effect)
the threshold effect is a clear tipping point at 3.00 mm or higher where sites are drowned
compared to global sea level rise current rate is 4.5 mm/yr
non linear response of marsh to rae of sea level rise
in some cases they can keep up but not really anymore


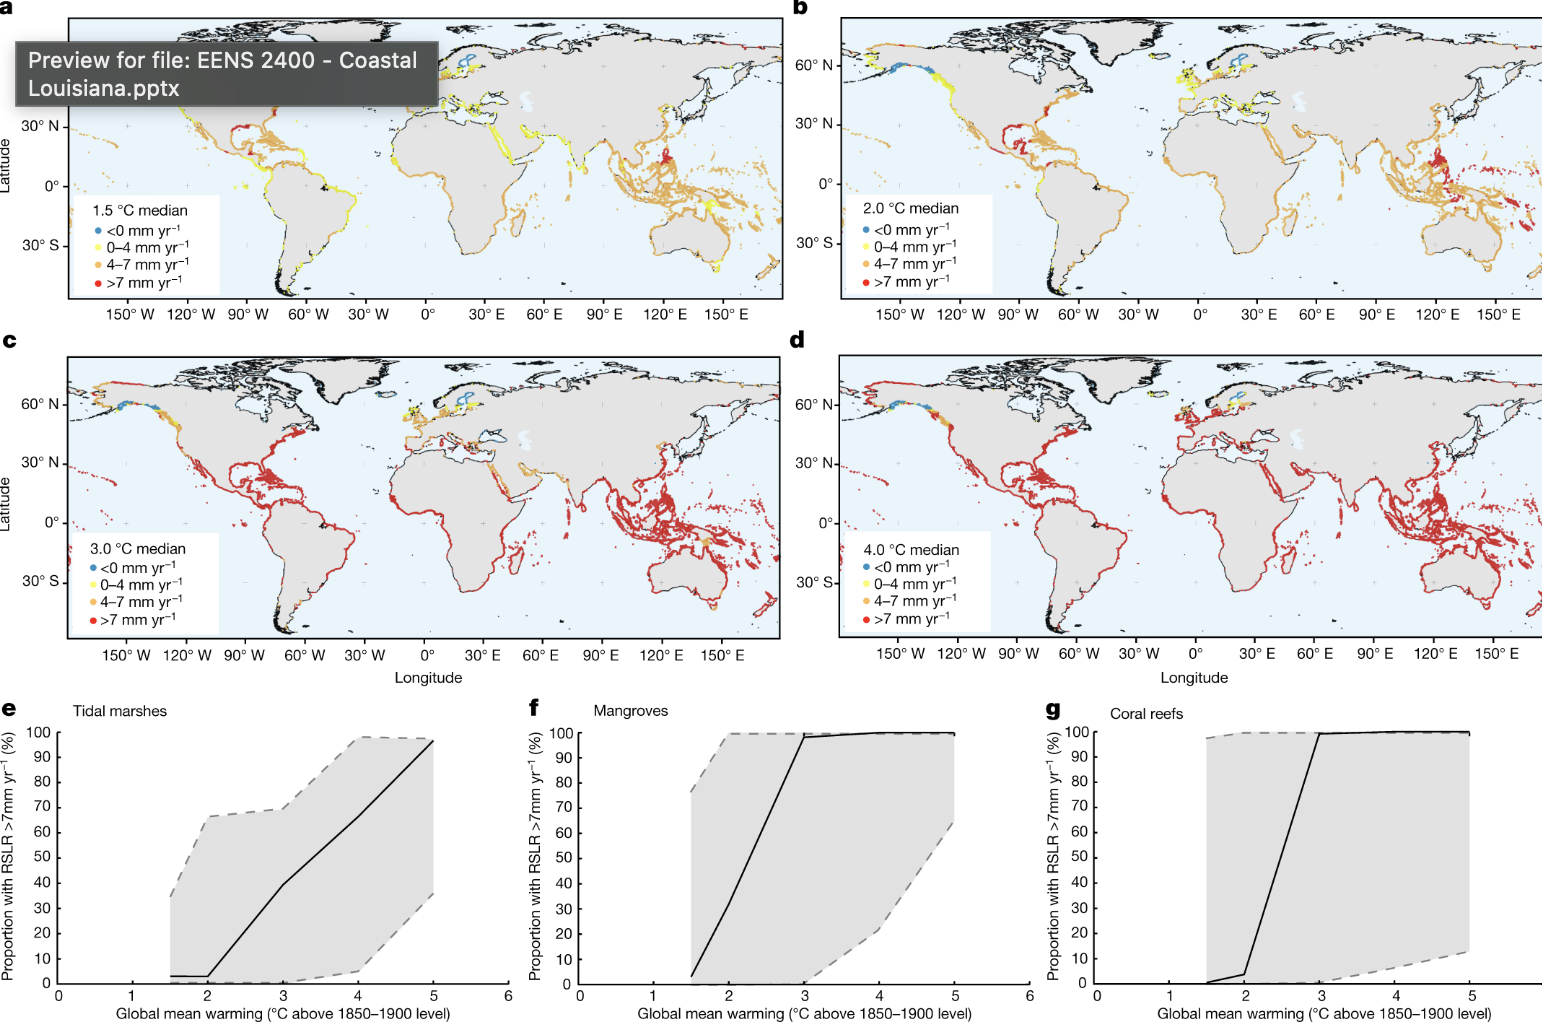
coastal ecosystem, global warming and RSLR
a-d spatial distribution of relative sea level rise rates for different global mean temperature warming scenarios 1.5c -4.0c above pre industrial
e-g proportion of coastal ecosystem tidal marshes, mangroces, corla reefs that are projected to experience rslr rate greater than 7mm yr-1 at various levles of global mean warming
global warming that exceeds 2c will lead to decline of critical coastal and marine ecosystems

what is this showing about land area changes
this was the plan for the barataria bay and breton sound levee breaches for sediment deposits
was canceled
diversions like this mimic natural delta building processes but they have to contend with accelerating sea level rise
climate impacts
never occur in isolation and must be viewed within the broader context of environmental degradation
coastal louisiana provides and excellent example of an already severely wounded landscape that now faces the onslaught of accelerated sea-level rise
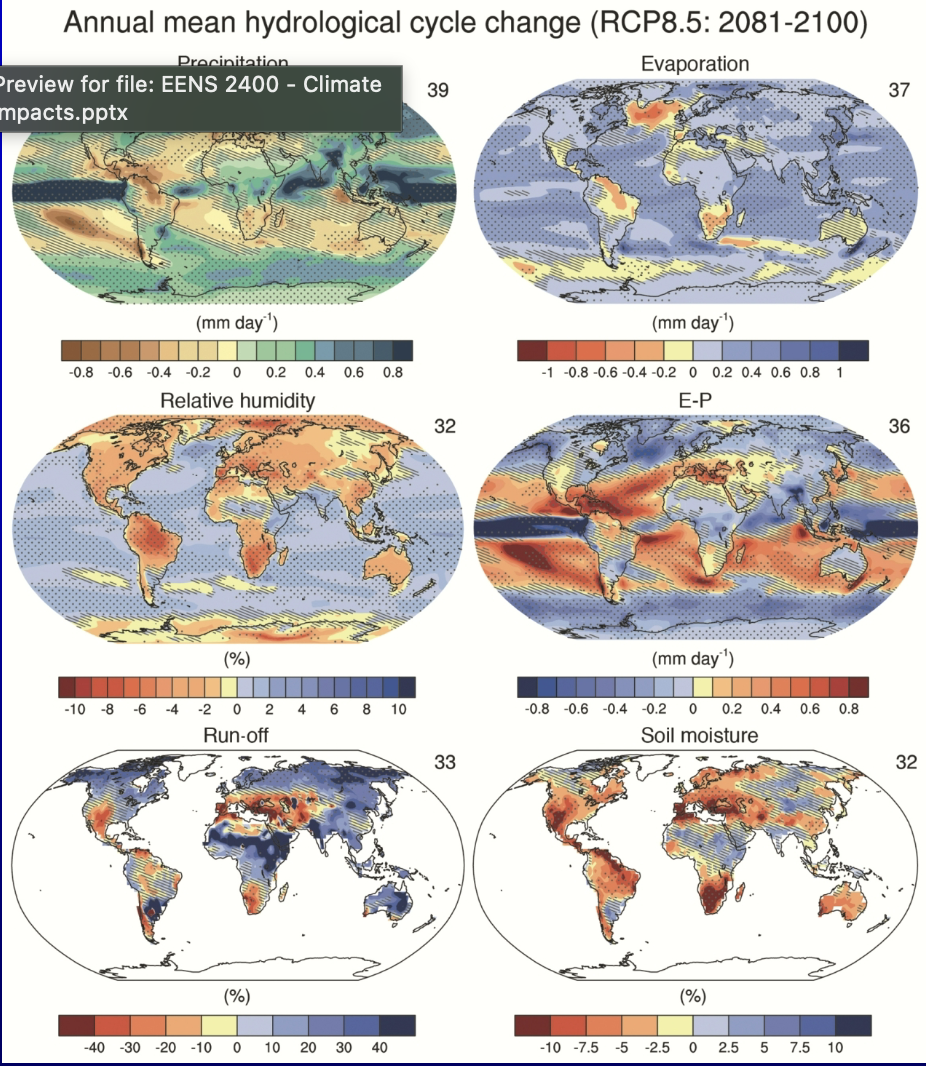
hydrological cycle changes at different rcps climate impacts
rhine river levee ex
changes to the hydrological cycle are reflected by a more intense precipitation regime in most of the world but drought in other parts
river floods are already on the rise and will continue to do so there impact is the result of a combination of hydrologic changes and increased population densities and economic activites in flood plains
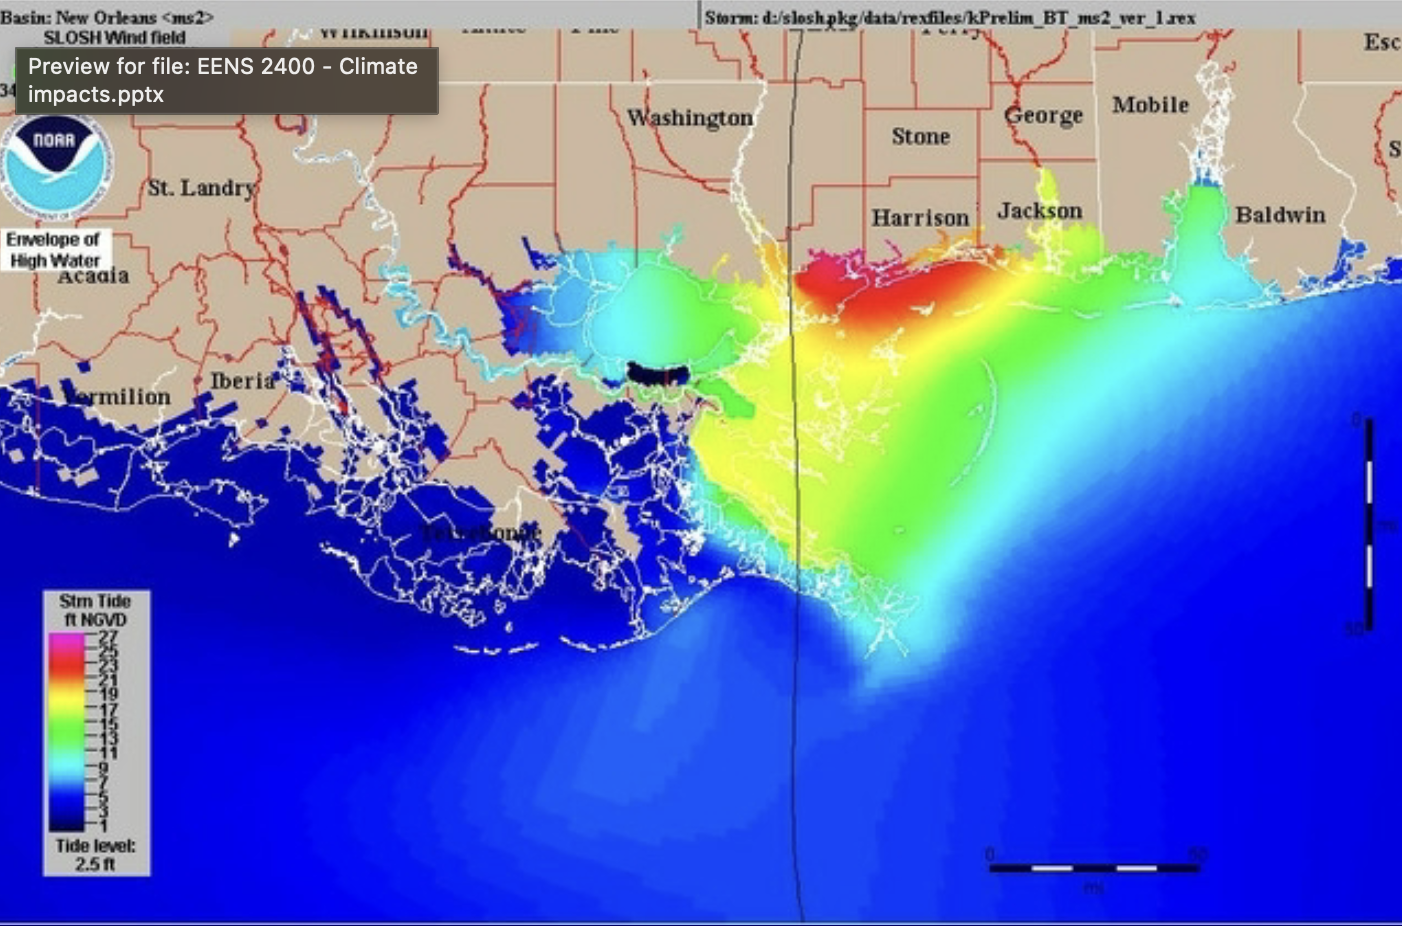
coastal storms especially tropical cyclones constitute another threat, most of the issue is from the storm surges rather than wind


hurricane katrina storm surge
harrison county hit the hardest
Tracks eye of the storm goes straight up to the right of nola
Storm surge was the highest in harrison mississippi people who stayed there did not survive
similarly when hurricane florence and harvey stalled they dumped so muc rain

Cyclone patterns
On equator no cyclones lowest latitudes
Start in africa cross the atlantic
The requirement for the storms to be strong is really warm waters
Higher latitude ferrel cell with westerlies that move in opposite direction
Why is there nothing
West coast africa upwelling makes cold water so no hurricanes
Amount might not change but their intensity is increasing
Their impact increase because rising sea levels make coastal areas vulnerable regardless of storm climate changes
Disproportional population increase in low elevation coastal zone, economic reasons global trend
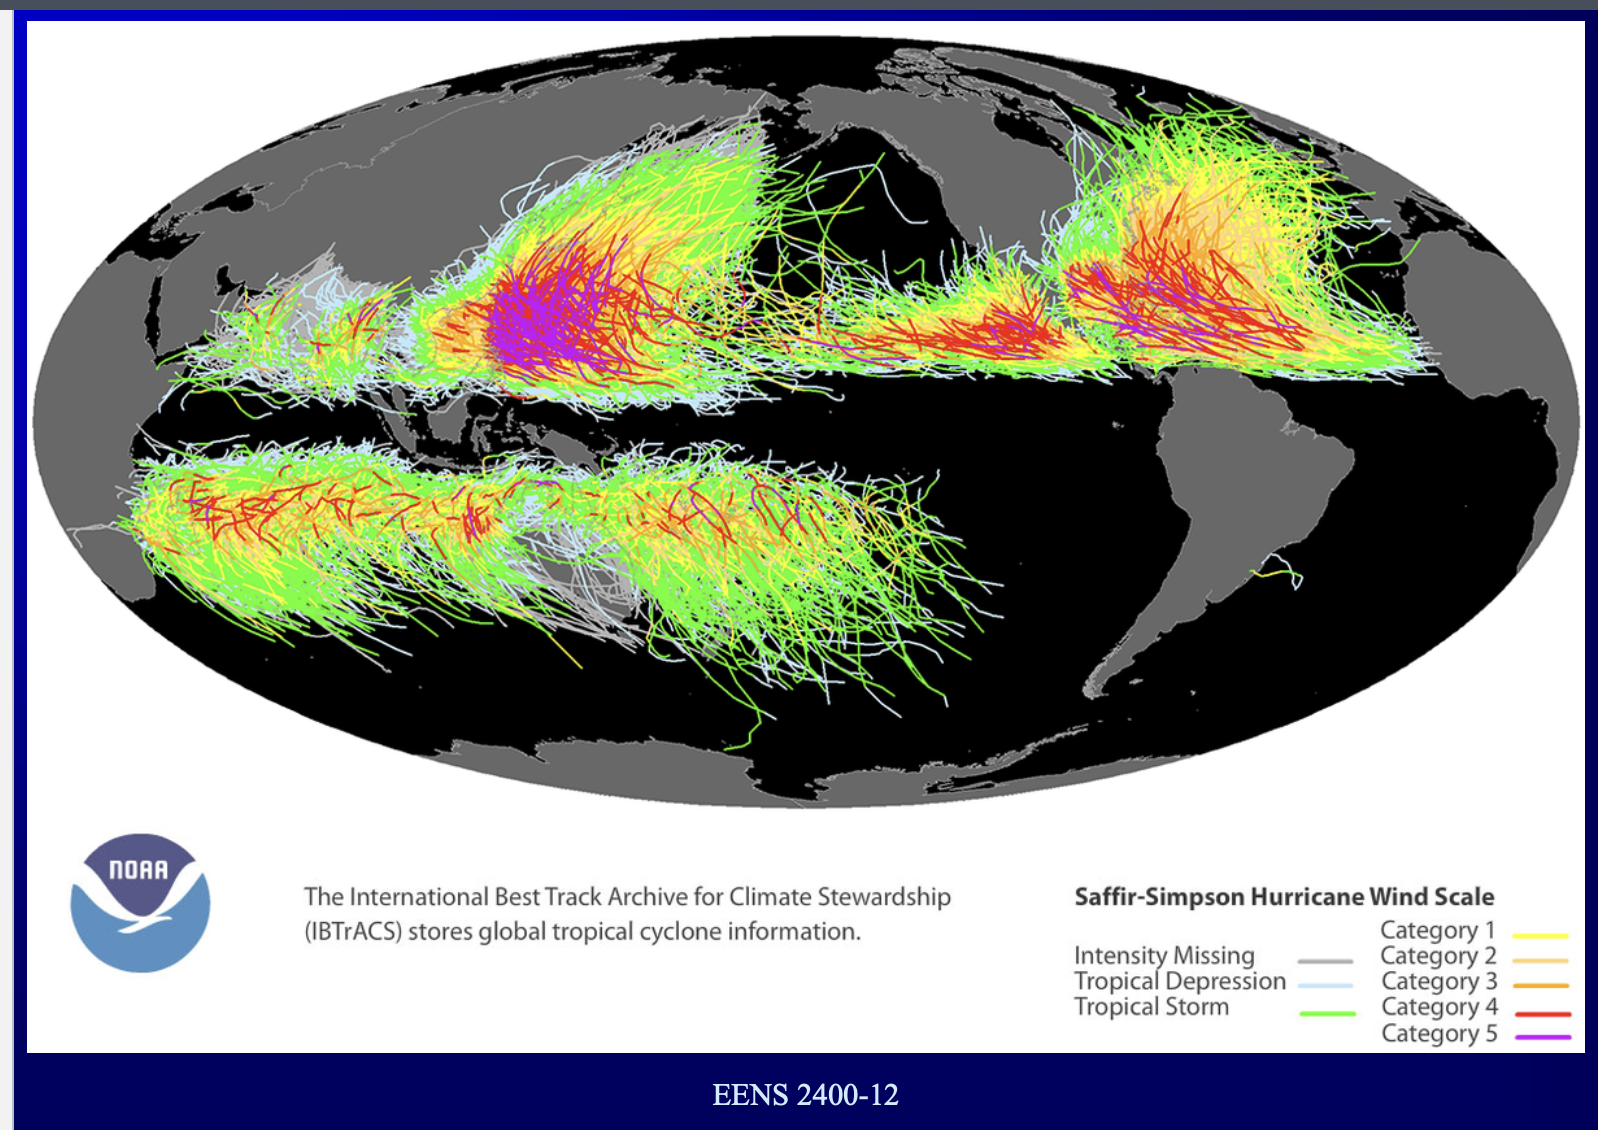
climate impacts cylcones
tropical cyclones are particularly deadly and costly there is concern how they will be in warming world
frequency may not change but intensity is
the impact of tropical cyclones increase with rising sea levels making coastal areas more vulnerable regardless if storms change
disproportional population increase in low elevation coastal zones

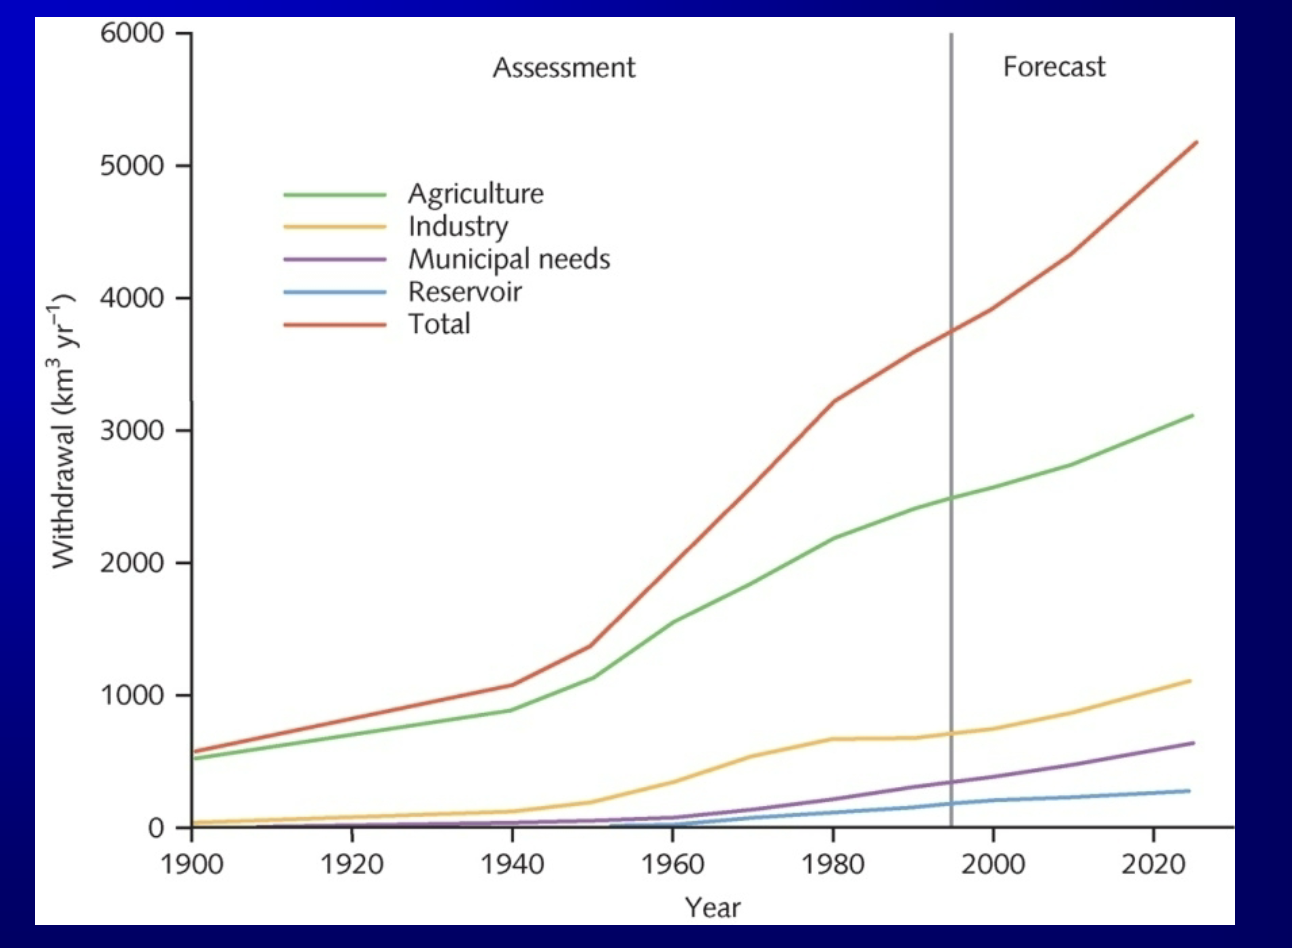
water witdrawal in cubic kilometer 1900-2000
agriculture dominant driver of global water usage, more than all other human uses combined
agricultural, municipal, industrial and resevoir storage

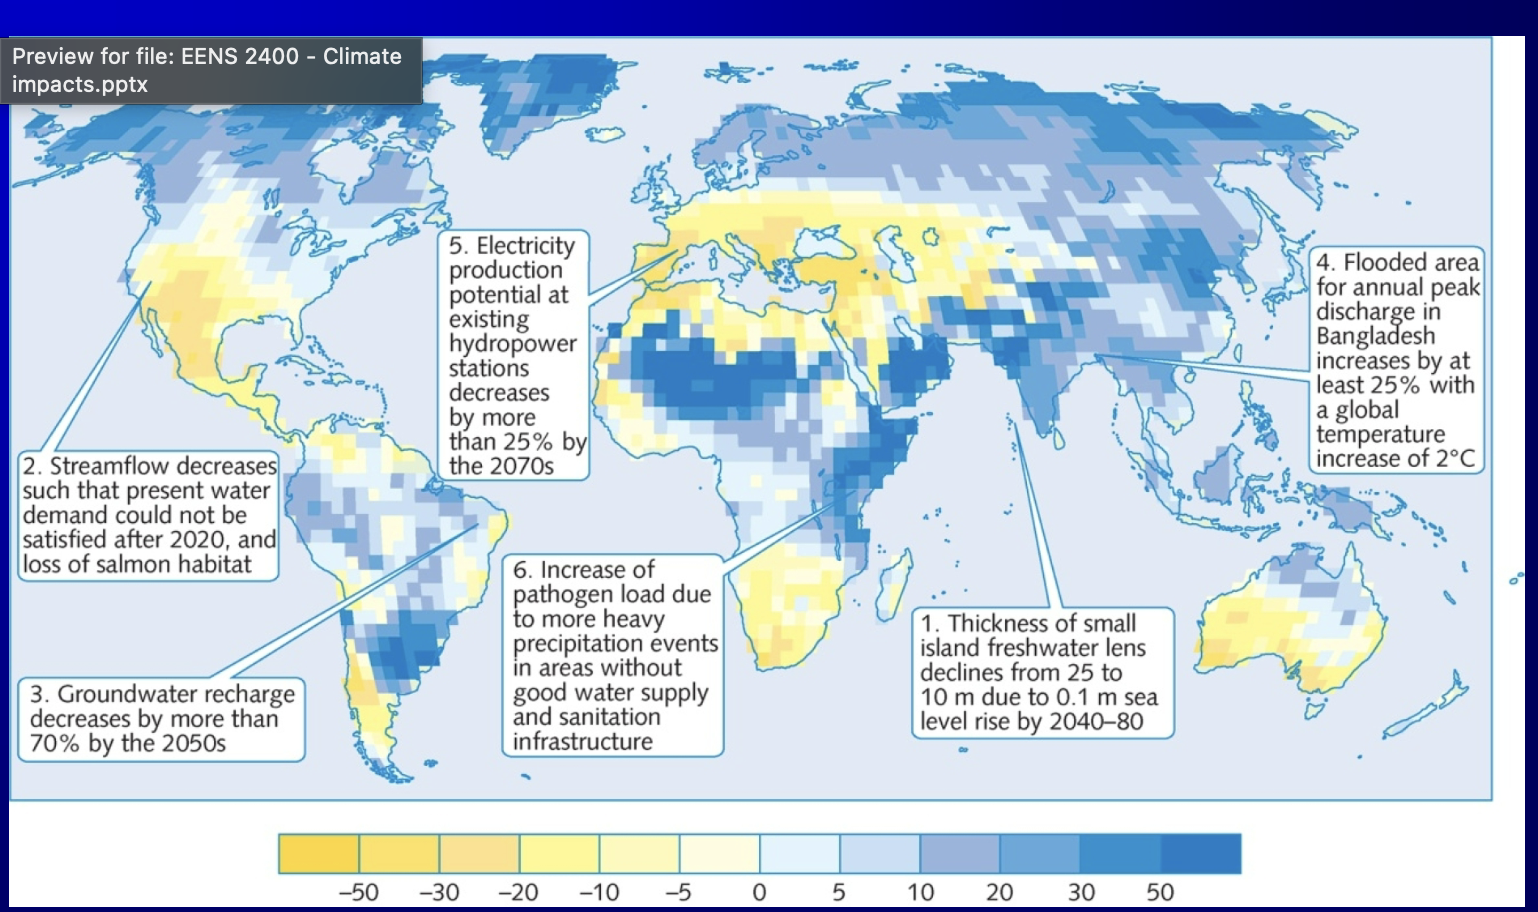
various climate change impacts on water resources and infrastructure
freshwater lens decline: in small island nations sea level rise projected to reduce the thickness of freshwater lenses significantly by 2040
water supply riss: streamflow decrease threaten water satidfaction and salmon habitats while groundwater recharge is expected to drop sharply in 2050
infrastructure and energy: hydropower potential is predicted to decrease by over 25% by 2070s and flooding in areas like bangladesh will increase 2c
pathogen risk: wil increase beaces heavy rains in areas with out good water supply and sanitation
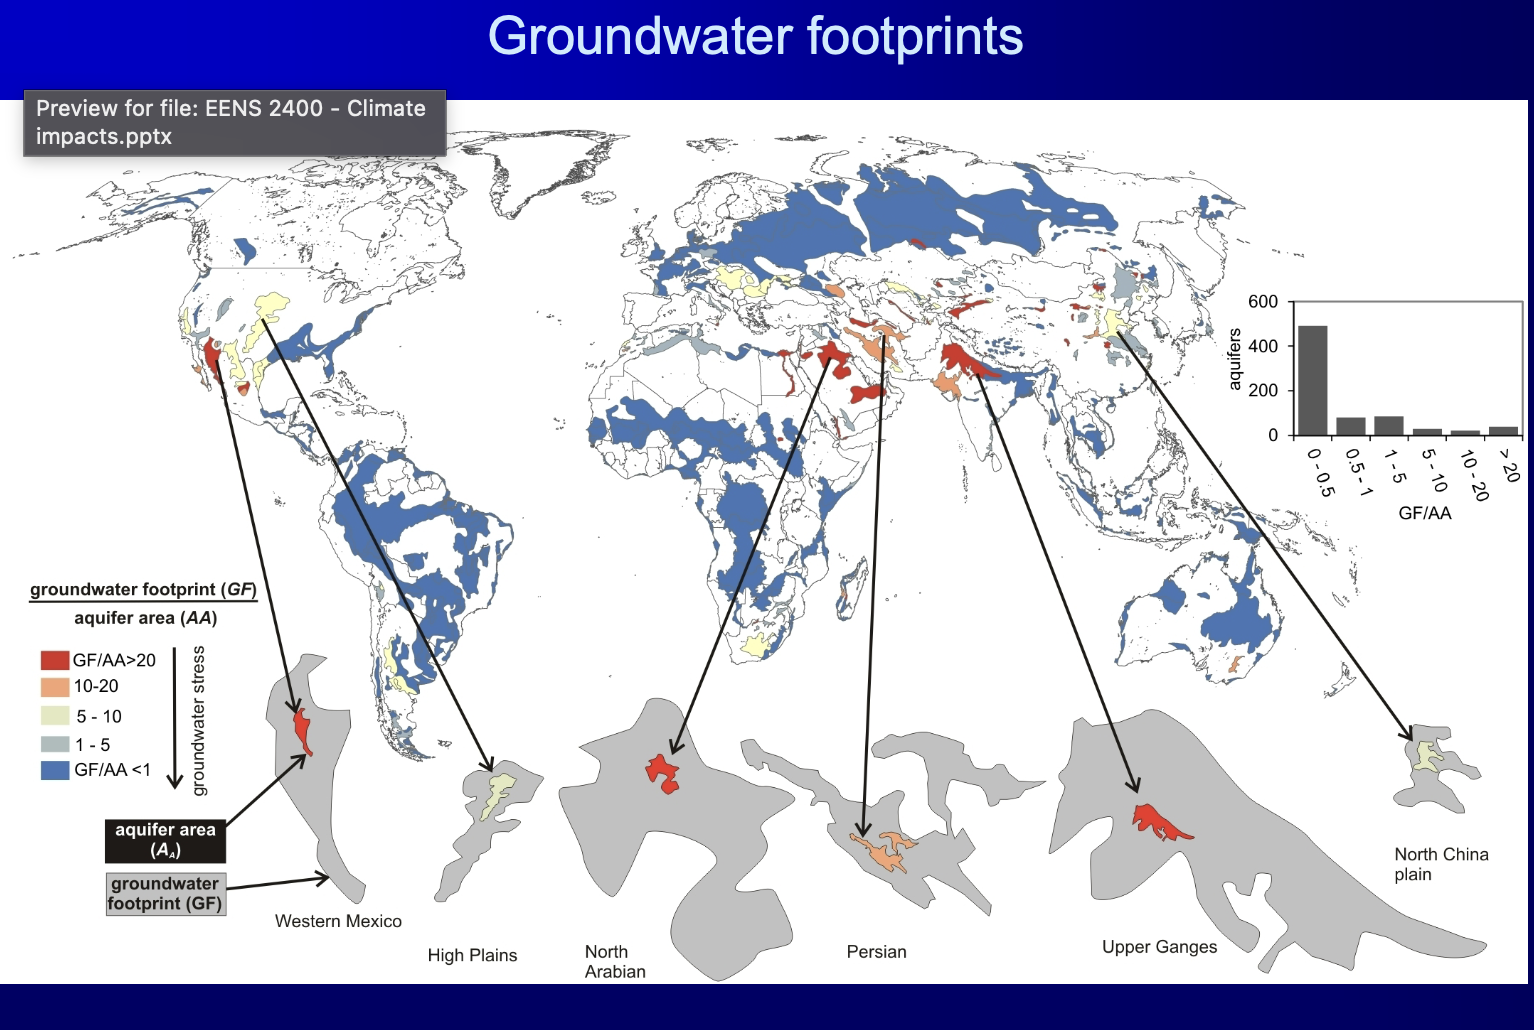
groundwater footprints
sustainability indicators where its the withdrawal of local regions groundwater compared to natural reservoir, also the area needed to dilute pollutants
usually 3.5
over exploited in upper ganges, northern china, central valley
Gf/Aa > 1 : unsustainable
Gf/Aa » 1: when people are mining water and refilled by past climatic events
but there are a lot thats not over that
increasing heavily in areas that are facing drought

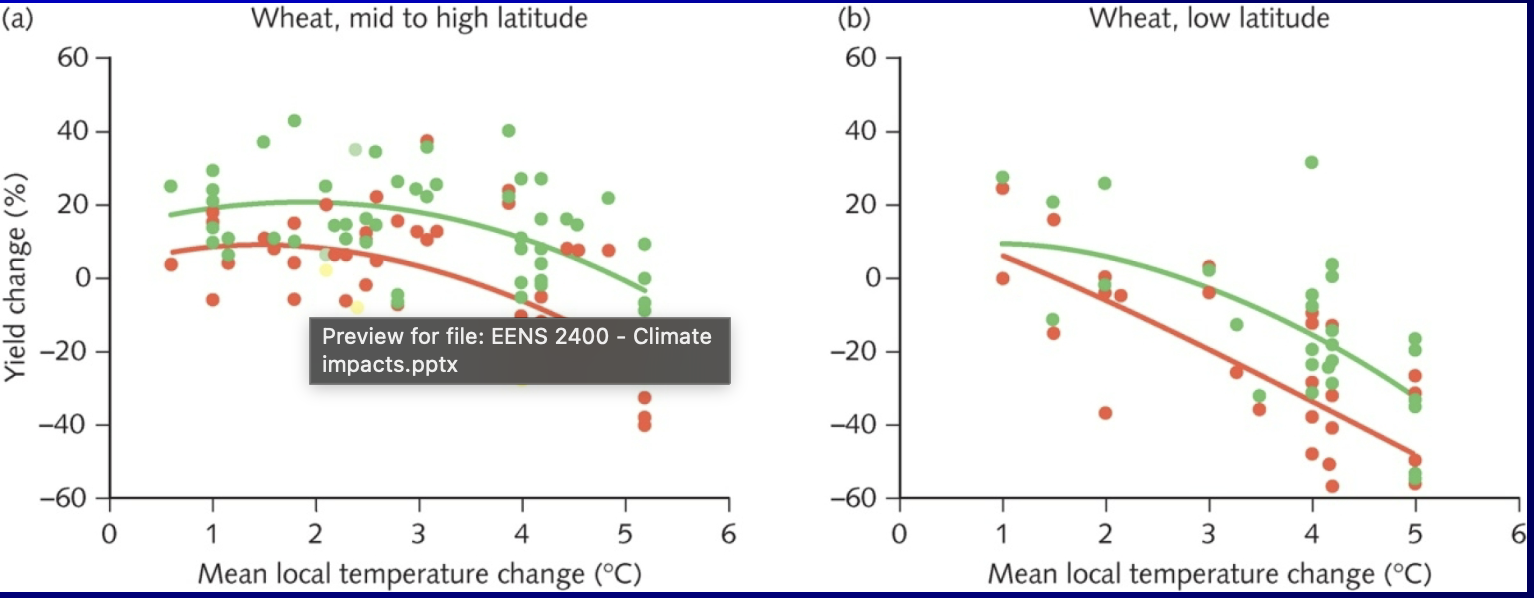
what is the effect of global climate change on food production
climate change may have some beneficial impacts in some area since precipiation may increase in some places

climate impact on biopshere
extreme and expresses itself in multiple ways
extinction occurs when habitats disappears altogether or becomes small/ fragmented to support the species concerned, 20-30% of species so far assesed are at increasingly high risk of extinction
biome migration along with the migration of individual species occurs both latitudinally and altitudinally it is often hampered by other human-caused barriers
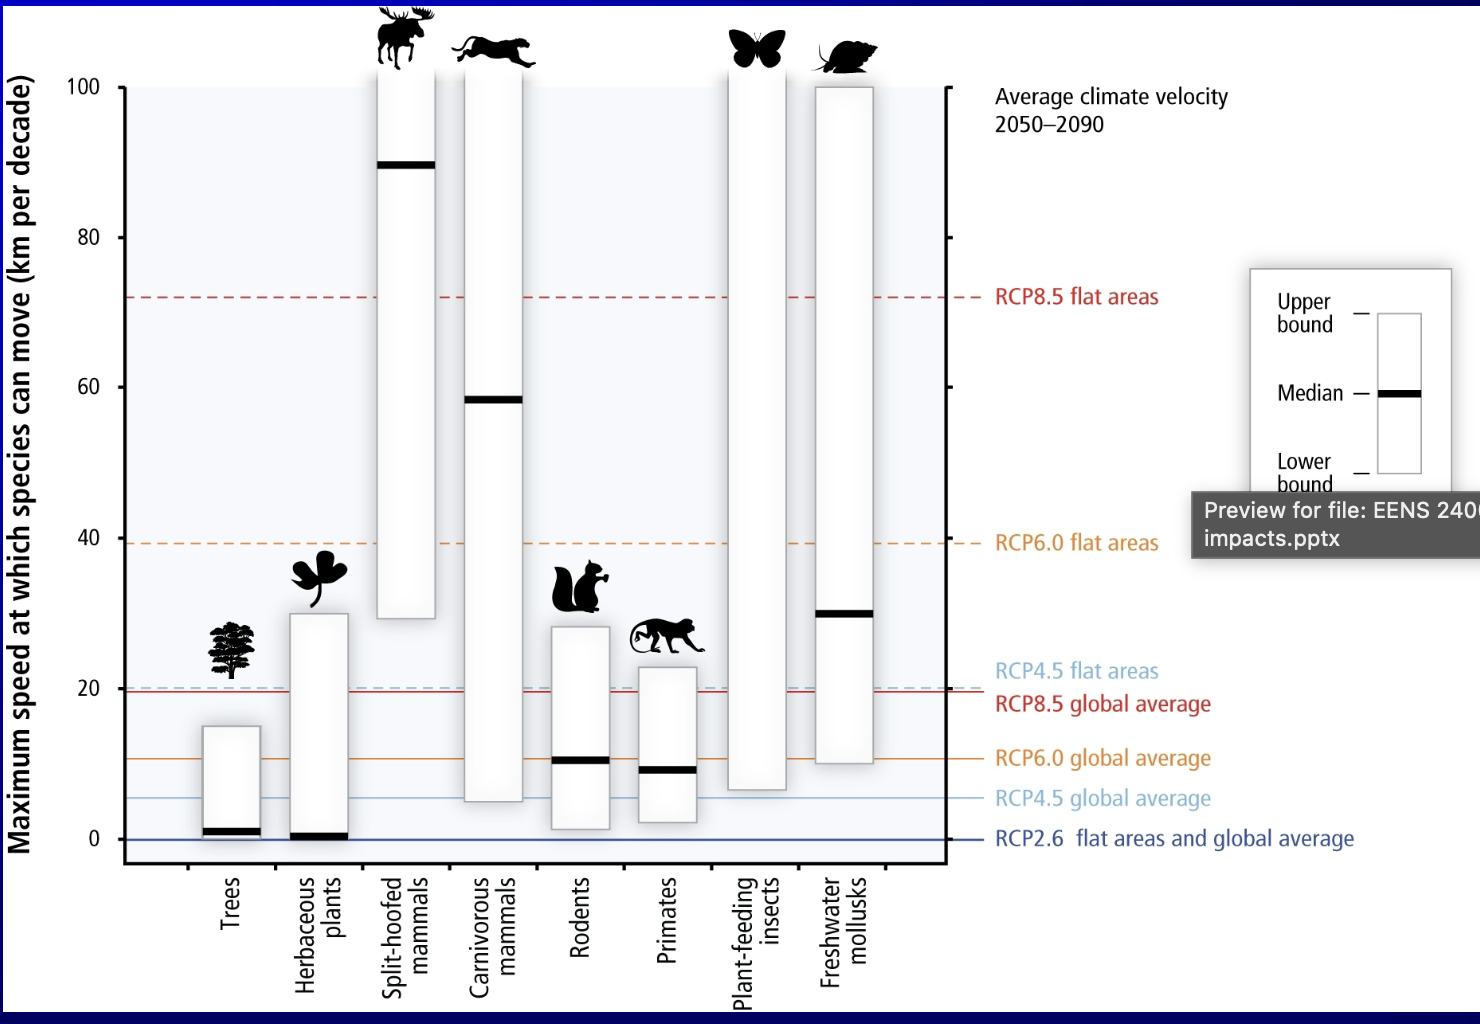
species vulnerability graph, species with movement speed falling below a specific climate velocity line are unlikely to keep up with warming without human intervention
trees and herbaceous plants are lowest movement making them vulnerable to even moderate climate change
split hoofed and carnivorous mammals show the highest mobility with many capable of exceeding 100 km/decade
rcp8.5 is way higher than any animal can keep up with

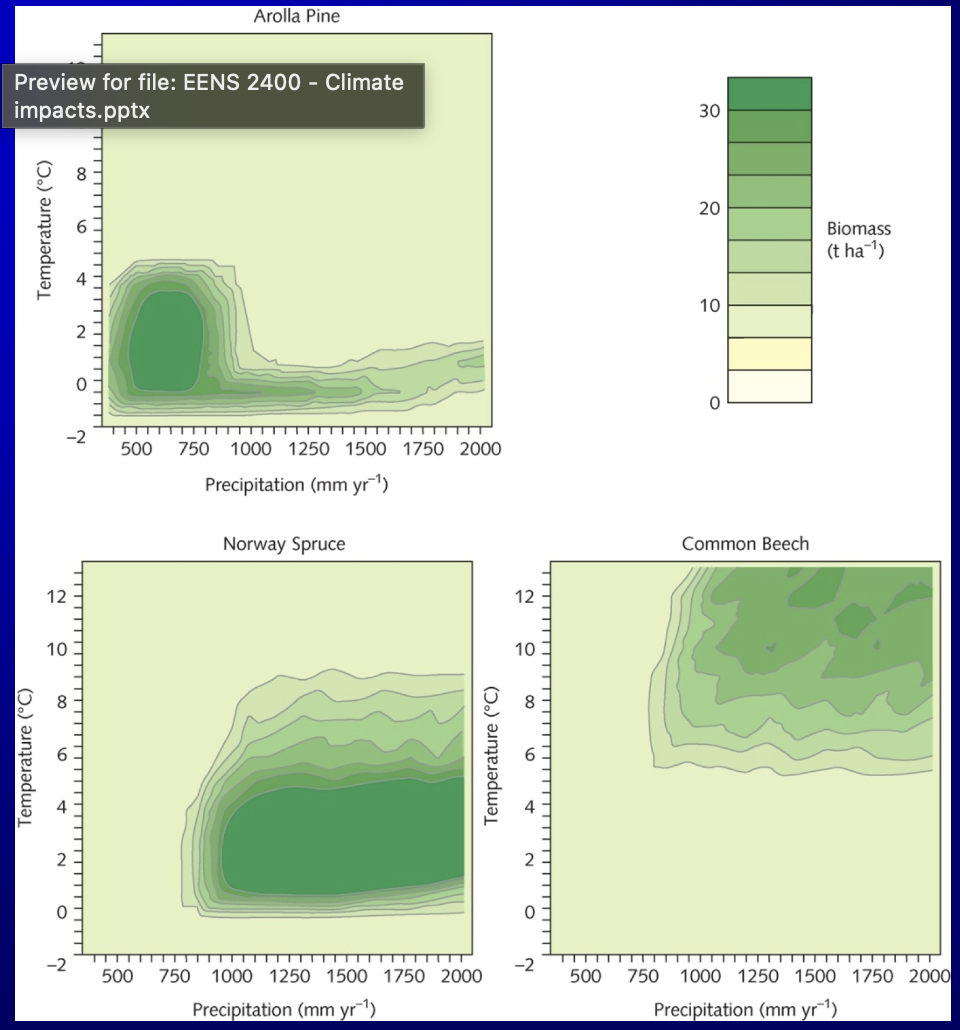
realtionship between climate (temperature and precipitation) and the biomass of three tree species: Arolla pine, norway spruce, and common beech
ecological niches, certain
arolla pine: cooler direr environmnets in 0-4C and precipitation below 1000 mm/yr
norway spruce: occupies a mid-range niche and prefers high to moderate precipitation >1000 mm/yr and temperatures 0-8C
common beech: dominates in warmer, wetter conditions highest biomass occurs at temperature 6C precipitation levels exceeding 1000 mm/yr

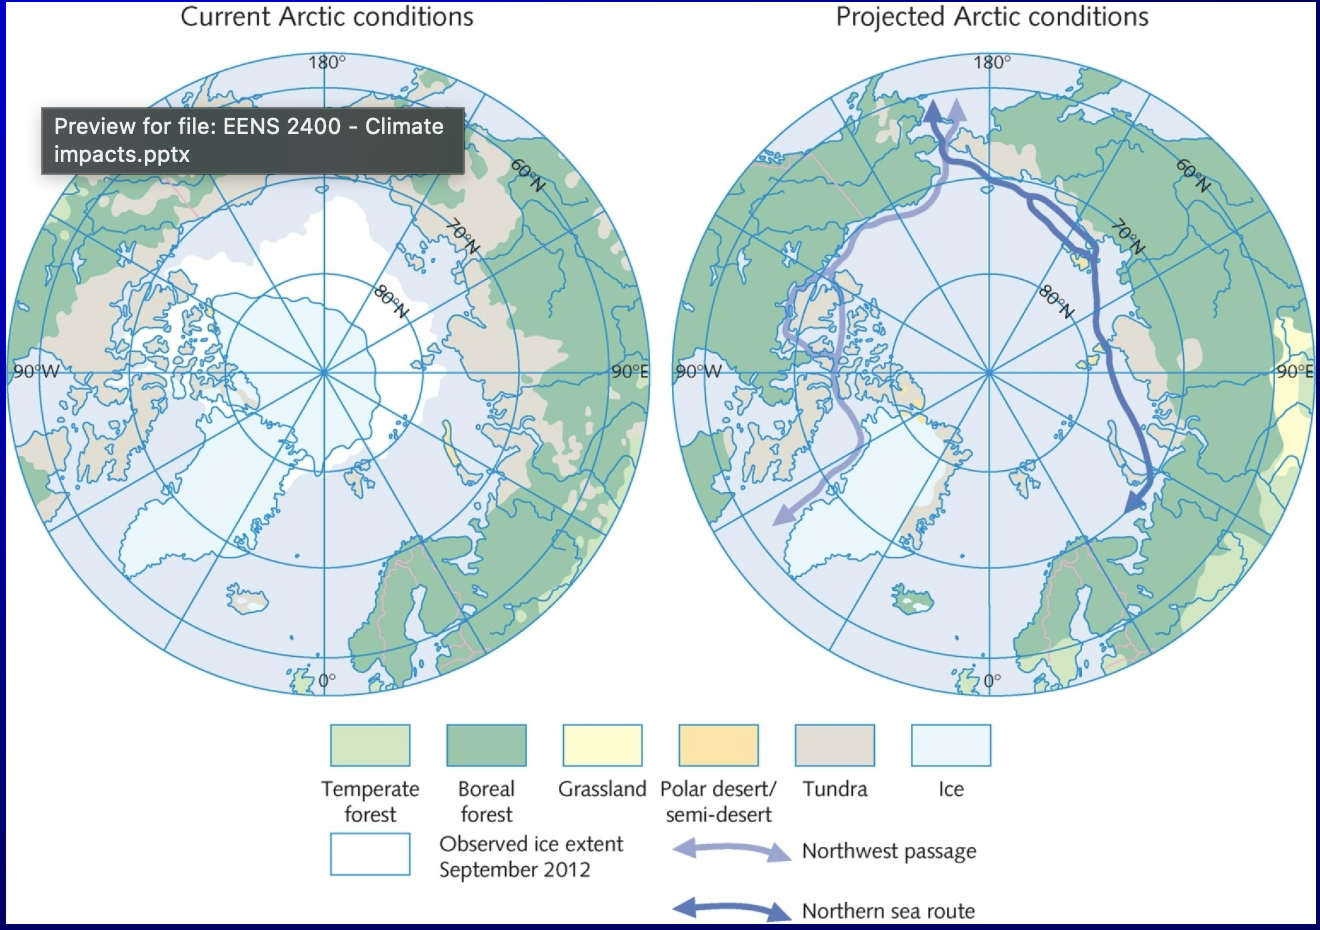
projected artic conditions, what is happening with plants
loss of tundra and polar desert, expected to shrink and be overtaken by grasslands and forests
ice reduction the white ice region at the pole shows a significant decrease in the projected map compared to the current map
biome migration along with the migration of individual species occurs both latitudinally and altitudinally it is often hampered by toehr human caused barriers


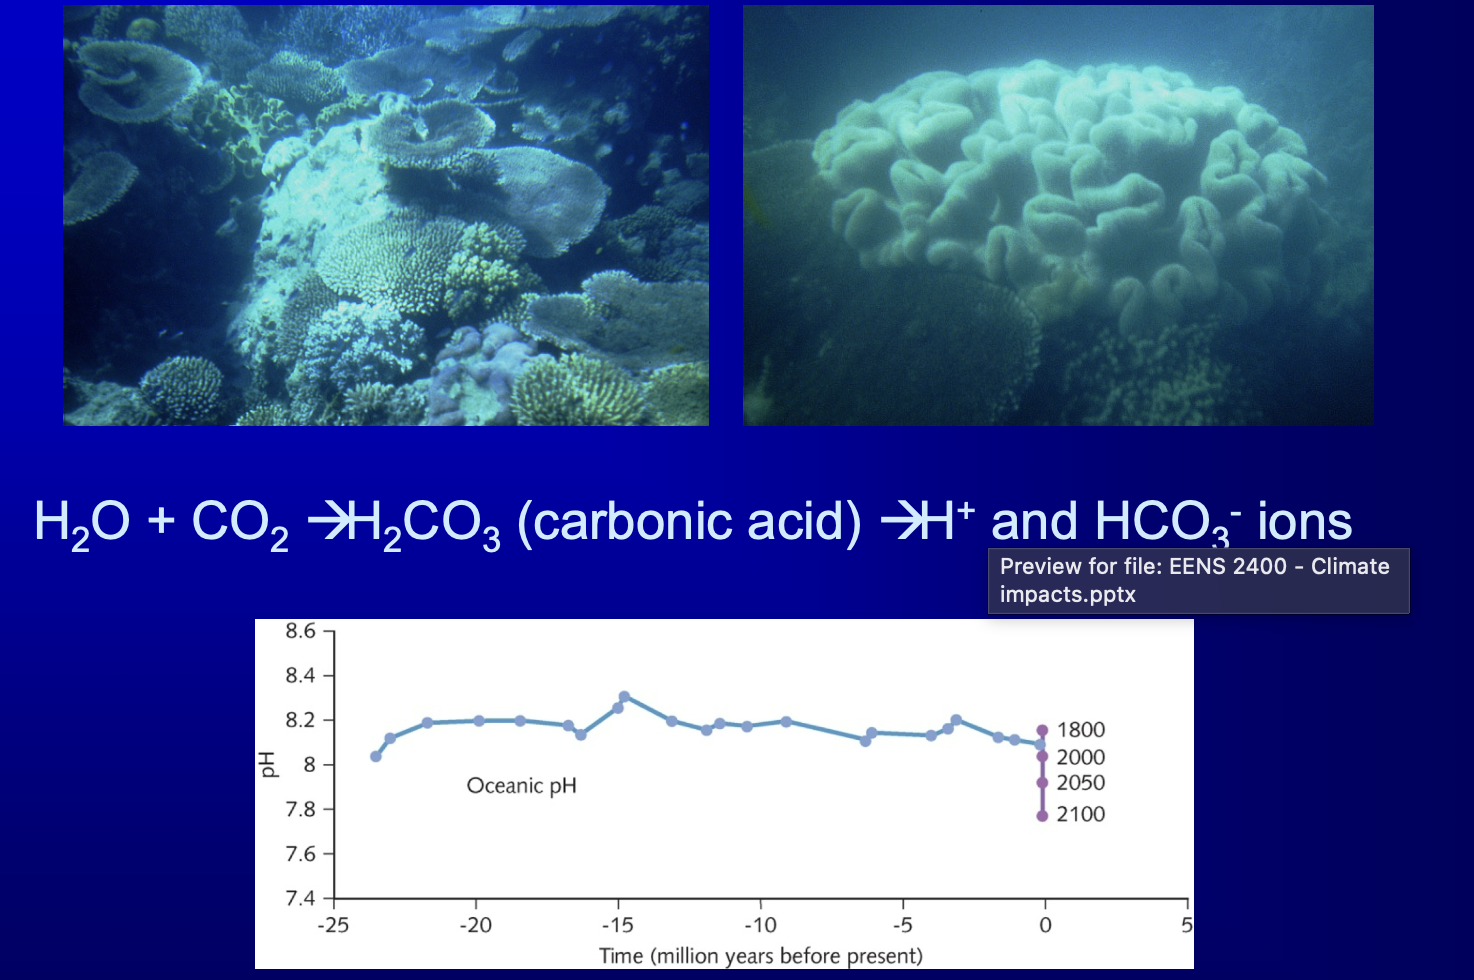
ocean acidification
presents an immense threat to a wide range of marine species and ecosystems notably coral reefs