Stats- Vocab Cram
1/55
There's no tags or description
Looks like no tags are added yet.
Name | Mastery | Learn | Test | Matching | Spaced | Call with Kai |
|---|
No analytics yet
Send a link to your students to track their progress
56 Terms
Population Data
Data for all individuals from the target population
Sample Data
Data for some individuals from the target population
Variable
feature we record that may vary from individual to individual
Observational Unit
single individual entity in a study
Sampling Frame
list of units from which the sample is selected (survey, polls, etc.)
Selection Bias
distortion in data that occurs when participants chosen do not properly represent the intended population
Volunteer Sample
when self-selected participants take part in a study
Convenience Sample
when researchers select participants who are most easily accessible
Nonresponse Bias
when ppl refuse to participate resulting in the final sample being unrepresentative of the overall target population
Response Bias
tendency of participants to answer questions inaccurately
Probability Sampling
technique in which everyone in the population has a probability to be selected for the sample
Simple Random Sampling
Everyone in the population has an equal probability of being sampled
Stratified Random Sampling
Dividing population then taking a sample from each
Cluster Sampling
Population is divided into clusters —→ a random sample of clusters is selected
Systematic Sampling
method of selecting individuals from a population at fixed, periodic intervals—> has random starting point
Observational Study
observe subjects in natural environment without interfering or assigning treatments; not possible to conclude a cause
Randomized Experiment
participants randomly assigned treatment; can conclude cause
Case-Control
2 distinct random samples of individuals w/ differing by some feature; individuals w/ feature= cases; indiv. w/o= controls
Cross-Sectional
information collected by observing multiple subjects at a single specific point
Completely Randomized Experiment
Individuals are randomly assigned to different treatment groups
Matched Pairs Experiment
Imposed conditions are compared on pairs/sets of related individuals
Study Design
Completely randomized experiment; individuals are assigned to different treatment groups completely at random
A single-blind experiment
where participants do not know which treatment they have been assigned
A double-blind experiment
where participants nor researchers knows who had which treatment
Categorical
variable for which the raw data are group or category names
Nominal
variable does not necessarily have logical ordering
Ordinal
variable does have logical ordering
Quantitative
variable for which the raw data are numerical measurements/counts
Discrete
can take one of a countable list of distinct values (ex: 1, 2, 3, 4,)
Continuous
can take any of the infinite possible values in an interval (ex: 1-4)
Statistic
summary of sample data
Parameter
summary of population data
P-Hat
proportion of individuals in a certain category
Mean
represented by “x-bar”; the average of distribution
Median
the middle of distribution

“Mu”
population mean

Sigma
population standard deviation
Variance
average squared difference from the mean

Sigma (squared)
population variance

Capital Sigma
Summation Operator

Alpha
significance level/ probability of Type 1 error

Beta
probability of a Type II error
Type 1 Error
False positive; concluding that a relationship exists when it does not
Type 2 Error
False negative; concluding there is no relationship when there is

Rho
Population correlation

Pi
Population proportion

Epsilon
Error term
“estimate”
Confidence Interval
Test
Hypothesis

N
sample size
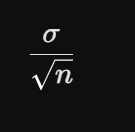
What is this equation used for?
standard deviation of sampling distribution; tells you how much sample mean (x-bar) is expected to vary from true population size (mu) for a given sample size (n)
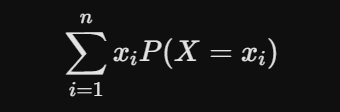
What is this equation used for?
Expected Value E(X) or “mu”; for calculating theoretical average outcome if repeated many times
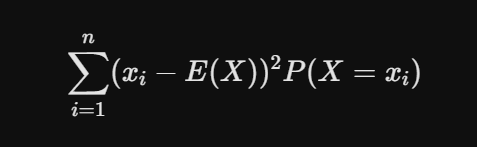
What is this equation used for?
Variance; measures how spread out the outcomes are around the expected value
Central Limit Theorem
If a large sample size is taken (greater than or equal to 30) the distribution of the sample means will look like a bell curve
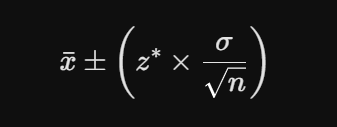
What is this equation for?
Calculating Confidence intervals; to determine how confident the range of values contains the true population parameter

Critical Value
threshold of probability for result to be statistically sigificant