OAM 330 Midterm 1 (Melissa Williams)
1/67
There's no tags or description
Looks like no tags are added yet.
Name | Mastery | Learn | Test | Matching | Spaced | Call with Kai |
|---|
No analytics yet
Send a link to your students to track their progress
68 Terms
Organizational behavior variables in organizational behavior
– Uses scientific methodologies to
understand and predict human behavior
– Aims to maximize individual and
organizational success
Individual Level Input variables in organizational behavior
•Demographics & social
identity
• Personality & values
• Decision-making tendencies
• Perception
• Motivation
Group- level input variables in organizational behavior
• Power & leadership
• Group structure
• Team composition
• Decision-making tendencies
System or cultural level input
•Organizational culture
• Global culture
• Human resource
practices
• Organization structure & design
Outcome (dependent) variables in organizational behavior
• Productivity & performance * (Deviant) workplace behavior
• Absence * Citizenship
• Turnover * Job satisfaction
Course themes
1. Common sense is necessary – but not sufficient – for predicting human behavior in organizations
2. Behavior is predictable.
3. Empirical evidence outperforms other types.
Empirical Evidence
In modern science – evidence arising from systematic testing or experimentation
Most valuable when aggregated
Empirical evidence outperforms other types bc…
N of 1 problem
correlation ≠ causation
Evidence Hierarchy
– The higher up you go on the pyramid, the more accurately you can predict the NEXT event
• Beware: Dramatic anecdotes are extremely powerful
– Richly detailed = memorable
– Negative = memorable
– First thing you see/hear = memorable
– Worked for our ancestors
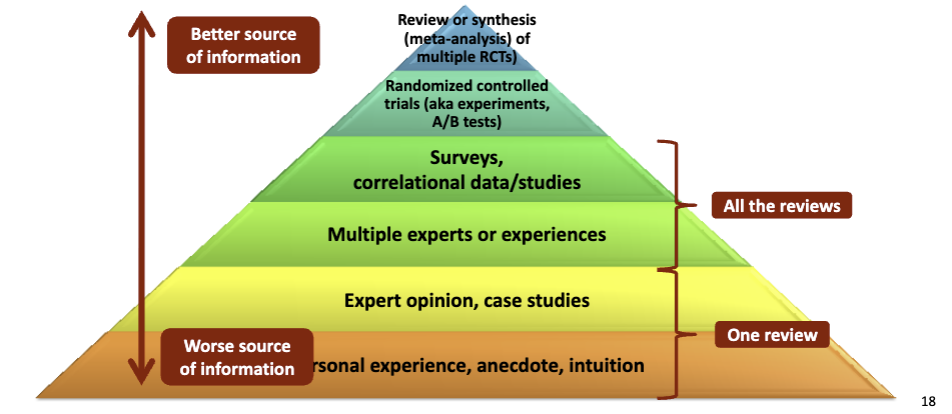
N of 1 problem
– Can’t know all the reasons for one person’s (or one company’s) experience
– Low likelihood that your experience will be the same
—>Cannot generalize from an N of 1
– Small study /trial size = bad and not generalizable
Evidence-based management (extra)
• Pfeffer & Sutton – rank-and-yank at GE
They argue this 20-80-10 "vitality curve" method, which demanded annual firing of the bottom 10%, created fear and focused on short-term metrics rather than long-term performance.
• “Southwest Airlines is the most successful airline in thehistory of the industry. Herb Kelleher, its CEO from 1982 to 2001, drinks a lot of Wild Turkey bourbon.” —→ The Wild Turkey bourbon was the reason??
• Don’t overgeneralize from benchmarking
correlation ≠ causation (three reasons)
In short: Observed relationships… (1) may be spurious/coincidental, (2) go in the reverse causal direction, (3) caused by a third variable
Observed relationships may be spurious (merely coincidental)
Observed relationships may go in the reverse causal direction
– Fewer highway deaths -> more lemons?
Observed relationships may be caused by a third variable
– Road quality -> increased ability to import goods?
– Road quality -> increased auto safety?
Extra Notes:
The temptation to draw causal conclusions is strong
We may over-interpret correlations at the lower levels of the evidence hierarchy, so we can only make causal conclusions at the top (true experiment: randomized controlled trial)
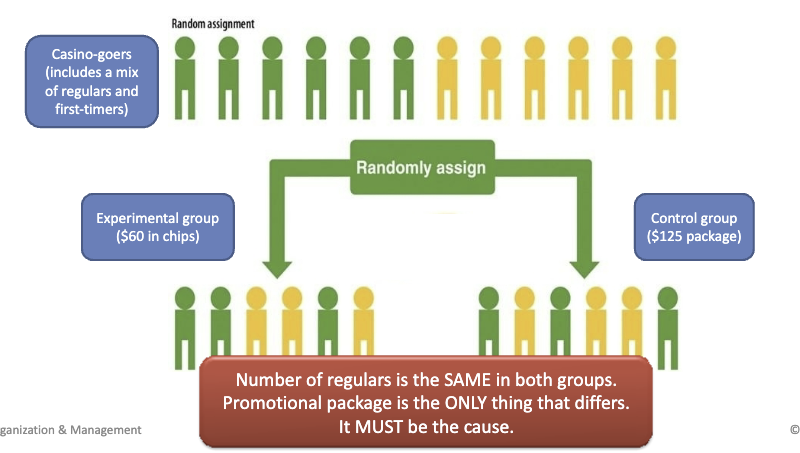
randomized controlled trial (a.k.a. experiment)
Experimenter has control over the input (independent) variable
which group gets the treatment and how much
YES: You tell the participating salespeople what to wear and track
their sales
NO: You write down what the participating salespeople chose to wear
and track their sales
Random assignment of individuals to conditions (including a control or comparison condition)
Random Assignment (in randomized controlled trial)
Random assignment of individuals to conditions (including a control or comparison condition)
Each person* in the study has an equal chance of ending up in the experimental group or the control group
Ex: Pulling names from a hat, Every other person, Random number generator
Result: Irrelevant variables will average out to be equal across conditions
… except the one you are manipulating!
Therefore, the independent variable is the ONLY thing that differs between the experimental group and the control group
Obstacles to conducting an experiment
• It may be impractical, impossible, or unethical to assign people to different conditions
• (Ex) What if your independent variable is:
– Agreeableness
– Working in the East Coast vs. West Coast branches
– Salary
Quasi-experimental studies
(an Alternative study design)
– Taking advantage of a natural or existing division
– Different companies, branches, floors, classes, timing of a new policy
- Has control over Independ. var. (1) but not random assignment (2)
Correlational studies
(an Alternative study design)
– Measure the relationship between variables (instead of manipulating the variables)
– # of customers served per day and satisfaction of those customers?
- Neither control over Indep. Var. (1) or random assignment (2)
Control variable
A variable you measure in order to rule it out as an alternative explanation
Ruling out those pesky “third variables” (correlation ≠ causation #3)
Ex: Reading to kids and kids reading for fun: What control variables might you measure?
Kids’ reading skills … parents’ enjoyment of reading … # of books in the home … free time in kids’ day … distance to nearest library … parental income … etc.
System 1 – limbic system
– Operates automatically, quickly, effortlessly
– Not under your conscious control
– Snap judgments
– Practiced routines
– Ex: Running from a wild animal, driving home the same way for years
System 2 – prefrontal cortex
– Requires your conscious attention, control, and concentration
– Effortful and complex mental activities
– Allows looking deeper for non-obvious cues
– Ex: Doing calculations, learning to drive for the first time
Systems 1 and 2 in conflict
– System 2 (conscious thought) doesn’t always know when System 1 (nonconscious) is operating
– We frequently think we are making a more rational, data-driven decision than we are
Perception
Perception: organizing, interpreting, and making meaning from what your senses tell you
1st decision-making step – perceiving the situation, gathering information
Perception ≠ reality
Motivated perception
We see what we expect or want to see
Ex: 70% “saw” the animal that led to a better outcome (orange juice vs. nasty smoothie)
Self-fulfilling prophecies
Expectancies influence others’ actions
Availability heuristic (Availability bias)
Conclusions based on what information comes easily to mind
Easily available information may not be representative of all information
Ex:
More people choose to drive after a widely publicized plane crash
Increased driving after 9/11 led to 2,170 more fatal car accidents – almost as many as the number of people who died in the Twin Towers (2,606)
Make sure you are making a decision based on all the evidence, not vivid examples that come to mind
Confirmation bias
– We tend to seek and gather information that confirms our existing theories
– A better test would be to look for anything that might disconfirm it
Halo effects
Things (and especially people) that are “good” in one area tend to be seen as “good” in other areas
– “Exaggerated emotional coherence”
Ex: Attractiveness – people (inappropriately) see it as indicating intelligence and competence
Attribution (extra)
Attribution – how we explain behavior
– Internal cause – stable aspect of a person (they’ll do it again)
– External cause – changeable aspect of the situation (a one-time occurrence)
Systematic errors in attribution
Fundamental attribution error –others’ behavior is over-attributed to internal causes
Self-serving bias – own negative behavior over-attributed to external causes
Overconfidence
We are often wildly overconfident in predicting our own outcomes
Dunning-Kruger effect: We are more overconfident in domains in which we have less experience/skill
Planning fallacy:
We make predictions based on best-case scenarios, not likely scenarios
We make predictions based on this specific task, not the average of past tasks of this type
Hindsight bias
Overconfidence that we could have predicted an event in advance
Curse of knowledge – difficult to put ourselves in the perspective of not knowing what we now know
Anchoring bias
Over-weighting initial information
Bias in numeric decision-making
Even when the information is not relevant, random
Anchoring bias plays a role in all price & salary negotiations
Very difficult to avoid the influence of anchors so it’s better to avoid seeing it when possible
Ex: “We’re not going to price it at $999. The iPad will start at just $499.”
Framing and risk
Would you prefer a smaller “sure thing” … or a chance for something better?
Bias in numeric decision making
We are risk averse for gains, but risk seeking for losses– Even when the net change is the same
Sunk cost fallacy
Over-weighting what you have already invested when choosing a next step
Bias in numeric decision making
Sometimes: escalation of commitment
Sticking with your original plan because you’ve already worked on it, even if it’s not a great plan
Ex: Staying in a long line or on hold
How to reduce impact of decision-making biases
“Because the brain cannot see itself fooling itself, the only reliable method for avoiding bias is to avoid the situations that produce it.” - Gilbert, 2006
• Be aware
• Allow enough time to evaluate information thoroughly
• Focus on broad samples of data (not just single experiences)
• Present information in multiple ways – avoid framing effects
• Minimize situations in which people’s egos are at stake
Personality testing – why companies use it and whether it typically works
Why is personality testing so common?
Hiring is hard
Interviews don’t really work (“interview illusion”)
interviewers overrate their ability to judge a candidate's potential
Personality testing is intuitively appealing
Barnum effect
Does personality testing work?
Results are mixed here too
Widely used ≠ most reliable (Myers-Briggs)
For the Big 5: Personality-performance relationships are reliable but small
For the Big 5: Strongest relationships are contingent rather than direct
For the Big 5: We can’t (easily) change our traits, but we CAN find an environment where
we’ll thrive
People whose personality matches the job demands earn ~15% more and are more satisfied (vs. those who don’t match)
Barnum effect
– Most personality results seem accurate
– Yields an illusion of deep insight
Myers-Briggs
16 personalties:
Extraversion (E) vs. Introversion (I) (energy source), Sensing (S) vs. Intuition (N) (information gathering), Thinking (T) vs. Feeling (F) (decision-making), and Judging (J) vs. Perceiving (P) (lifestyle/structure).
Dimensions not empirically based
Categorical rather than continuous
Most widely used in organizations – but not proven valid
Not so stable over lifetime (hw article critiqued this aspect)
The Big 5 (OCEAN)
Individual differences can be described in most cultures by 5 trait dimensions (not types)
History:
Convergence from multiple independent research teams
Millions of research participants around the world
Methods:
Linguistic analysis, trait taxonomies
Comparisons between self-ratings and other-ratings
Relationships with behavior
Properties:
Mostly stable over lifetime
Partially hereditary
Predicts behavior
O: Openness to Experience
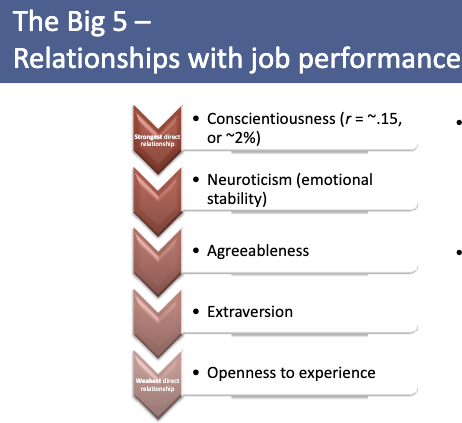
C: Conscientiousness (strongest relationship with job performance, but still small: ~2%)
E: Extraversion
A: Agreeableness
N: Neuroticism
- Personality-performance relationships are reliable but small
Openness to experience
– Predicts creativity, flexibility, adaptation to change
– May be better leaders – better with ambiguity and change
– Overall relationship with job performance is minimal
Conscientiousness
Conscientiousness: the quality of wishing to do one's work or duty well and thoroughly.
– Strongest direct relationship with job performance
– Predicts persistence, organization, planning
– Fewer errors
– Overall greater performance
– Not related to job type or rank
Extraversion
– Associated with better performance only in jobs requiring lots of interpersonal contact or teamwork
– May be better leaders
Agreeableness
– Associated with more liking by co-workers, less deviant behavior
– Associated with better performance only in jobs requiring lots of interpersonal contact, teamwork
Neuroticism
– Also called emotional (in)stability or negative emotionality
– Predicts less satisfaction with job and life, more stress, negativity
– More difficulty managing workplace stress or uncertainty
Narcissism
Narcissism – grandiose sense of self-importance
– I am more capable than other people.
– I really like to be the center of attention.
Extreme values seen as clinical pathology
More common among those seen as business
visionaries
What leads to narcissism?
Biological factors (NPD)
Age (being younger)
Wealth
Being richer
Coming of age in a good economy
Family type (being an only child)
Geography
Individualistic culture (vs. collectivist)
Urban (vs. rural)
Potential Strengths:
– Strong vision
– Charismatic
– Highly motivated
– Swift decision making
– More likely to emerge as leaders
– Can energize followers, lead to breakthrough transformations
Risks:
– Lack of empathy
– Poor at taking others’ advice, accepting criticism
– Low impulse control
– Can lead to follower resentment and discontent, decision making failures
– Involved in more lawsuits
Values
– Beliefs about which ways of being or behaving are better than others
– The “should” component of personality and behavior
– personal values vs. cultural values
Sources:
– Personality & genetics
– Cultural and personal experiences
Personal values
”I want to have an exciting, adventurous life.”
Cultural values
“Around here, we all pitch in and help each other.”
Cultures vary systematically in what they value (on average)
– Geography (land per person)
– Economics (degree of wealth)
– Disease exposure
– Harshness of climate
– Spread of religious beliefs
– Type of crop farmed
Hofstede studies
– >100,000 IBM employees around the world
– Systematic variation in what was important to people in different countries
Identified 5 value dimensions:
– Uncertainty avoidance
– Long- vs. short-term orientation
– Masculinity vs. femininity
– Power distance
– Individualism-collectivism
Individualism & collectivism
Degree of priority placed on individuals vs. groups
Individualistic cultural contexts:
– Value independence, uniqueness, self-expression, authenticity, initiative, personal achievement
– North America, Western Europe
Collectivistic cultural contexts:
– Value connections to others, belonging, harmony, group identity, group achievement
– Rest of the world
Rice vs. Wheat farming
Example of the impacts of the nature of farming crops with different farming needs in different geographic regions in China, resulting in psychological differences between people living in those regions
Rice Farming (Collectivist):
Shared system of water management to coordinate irrigation timing
Communal infrastructure (e.g., canals)
Seedlings grown in sharednurseries
Wheat Farming (Individualistic):
Farmers till & plow individual fields
Irrigation primarily from rain
Equipment owned by each farming family
Mechanized harvesting by each farmer
Role of culture in responding to moral dilemmas, workplace motivation
Effects: Obligations to ingroup members vs. strangers
Ex: Support a friend despite an obligation to out-group strangers
USA = No, I couldn’t do it. The same rules should apply to everyone.
India, China = Yes, of course. My friend is counting on my loyalty.
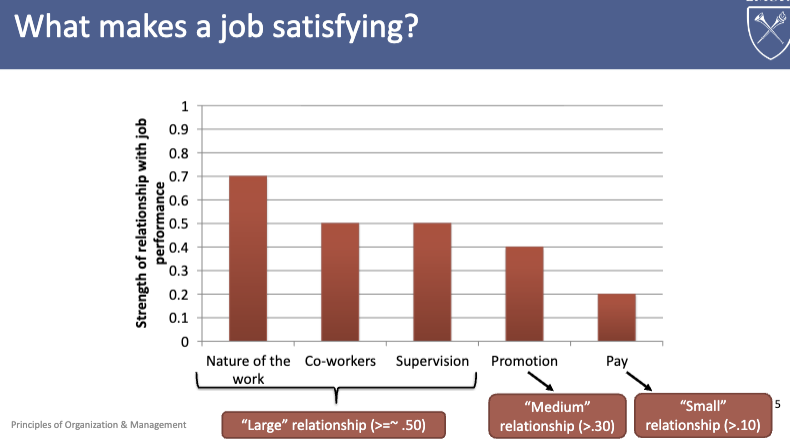
Factors predicting job satisfaction
Ordered by strongest to weakest relationship with job performance:
Nature of the work
Co-workers
Supervision
Promotion
Pay
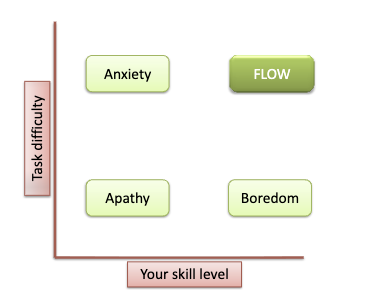
Flow state
– Total immersion in a task
– “In the zone”
– Lack of awareness of time, self,bodily states
One of life’s most pleasurable states
– More flow experiences reported at work (vs. leisure time)
Image: Flow = High Skill + High Difficulty
Predicting job performance from job attitudes
Employee satisfaction moderately to strongly predicts:
– Job performance
– Organizational citizenship behaviors
– (Less) turnover, absenteeism, deviance
Motivating Workplace Environments
What kinds of environments are most motivating?
Clear paths from inputs to outputs (expectancy theory)
Fair procedures and outcome (Equity theory and Distributive/Procedural justice)
Meaningful work that affects others (next time)
Expectancy Theory
Maximum motivation when input-to-output relationships are highest
Clear paths from inputs to outputs
Employee expectancies:
1. If I work hard, will I perform well?
2. If I perform well, will I be rewarded?
3. If I am rewarded, will the rewards help me fulfill my goals?
Equity theory
How does my ratio of inputs-to-outputs compare to that of relevant others?
Fair procedures and outcome
Equity theory bottom line: Employees evaluate job rewards based on their relative value, not their absolute value
Example:
– A comparable colleague works pretty hardand gets an OK salary.
– I work pretty hard and get an OK salary.
– OR: I work REALLY hard and get a higher salary
– Result: I feel fairly rewarded (equity).
– I work REALLY hard and get an OK salary.
– A comparable colleague works pretty hard and gets and gets an OK salary.
– Result: I feel under-rewarded.
Ex:
Veteran example from WSJ reading
Baseball team performance negatively related to pay inequity among players
Distributive Justice
(what I get)
Did I get the rewards I expected and deserved?
Procedural Justice
(how I get it)
– Are decisions made in a fair and transparent manner?
– Did I have an opportunity to make my voice heard?
– Am I treated with dignity and respect at this organization?
– Are people with my identity (e.g., race, gender, social class) treated the same as others?
Procedural justice: strongest predictor of job performance
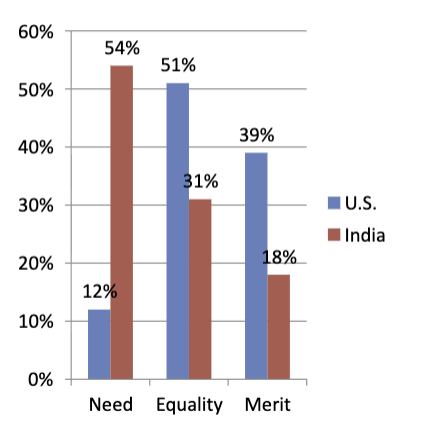
Cultural differences in perceptions of workplace fairness
Judgments of organizational fairness may differ across cultures:
– Merit vs. equality vs. need: Employees in some cultures may expect employers to meet all needs
– What counts as input? Employees in collectivist contexts may include efforts that contribute to ingroup solidarity (not just task work)
What all employees want (across cultures):
– Interesting work they can perform with some autonomy
– Fair, transparent procedures
What makes work meaningful (?)
-motivated by the opportunity to make an impact on real people (Especially end users)
Ex: University fundraising callers: a 10-minute intervention with fund-receivers
Money and happiness relationship
Does money buy happiness?
Yes … with caveats
1. Positive relationship but not linear
2. Correlation ≠ causation
3. People predict that money will increase their happiness more than it actually does
4. Believing that money is important for happiness predicts less happiness!
Why do we work?
– To pay the bills, yes – but college grads will typically make more than they need to just survive
– To have an identity (“I’m a …”)
– To achieve and accomplish
– To have “flow” experiences
Conflict:
– Many incentive structures are built on the assumption of boring, unlikeable work
– But people actually like a lot of their work
The myth of the unhappy worker
“Very”/ “Somewhat” satisfied: ~90%
“Not at all” satisfied: <5%
Intrinsic motivation
I like doing this
Extrinsic motivation
I like what doing this brings me
But using incentives to increase extrinsic motivation can undermine intrinsic motivation
Upsides and downsides of motivating others via financial incentives
Upside of financial incentives
– Gets people to do the work
Downsides of financial incentives
– Less creativity
– Less teamwork and cooperation (more competition)
– Unethical behavior
– Sense of unfairness
– Focus on short-term rewards vs. long-term planning
– Effort that is contingent on continued rewards
What managers should do
Pay above industry standards
– “Take the issue off the table”
– Likely cost-effective
Provide good benefits and flexibility
– Helps keep life from getting in the way of work
• Give unexpected (vs. expected) rewards
• Use non-tangible rewards like status, recognition, and thanks
• Money does matter – but it’s complicated
– We overestimate its importance to our future happiness
– We overestimate its importance to others
– It can undermine our intrinsic motivation
– It can foster unethical behavior or a sense of inequity
• Non-monetary incentives: highly valued by employees and often low-cost
What we all want (across cultures):
– Autonomy, mastery, purpose
– Meaningful work that connects to end users