RP1 -> the effect of ___ on the rate of an enzyme controlled reaction
 Call Kai
 Learn
Learn Practice Test
 Spaced Repetition
 Match
Match Flashcards
 Knowt Play
1/10

There's no tags or description
Looks like no tags are added yet.
Name | Mastery | Learn | Test | Matching | Spaced | Call with Kai |
|---|
No analytics yet
Send a link to your students to track their progress
11 Terms
variables that could affect the rate of an enzyme controlled reaction
● Enzyme concentration / volume
● Substrate concentration / volume
● Temperature of solution
● pH of solution
● Inhibitor concentration
Any one of these can be the independent variable and need to be varied (eg. by preparing a dilution series of varying concentrations). All others (except inhibitors) would be control variables so would need to be kept constant.
Describe how temperature can be controlled
● Use a thermostatically controlled water bath
● Monitor using a thermometer at regular intervals and add hot / cold water if temperature fluctuates
Describe how pH can be controlled.
Use a buffer solution
Monitor using a pH meter at regular intervals
Why were the enzyme & substrate solutions left in the water bath for 10 mins before mixing?
So solutions equilibrate / reach the temperature of the water bath
Describe a control experiment.
● Use denatured enzymes (eg. by boiling)
● Everything else same as experiment, eg. same conc. / volume of substrate (at start) and enzyme, same type / volume of buffer solution, same temperature
Describe how the rate of an enzyme-controlled reaction can be measured
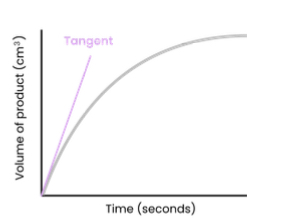
● Measure time taken for reaction to reach a set point,
eg. concentration / volume / mass / colour of substrate or product
○ Rate of reaction = 1 / time; example units = s-1
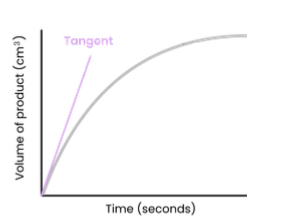
● Measure concentration / volume / mass / colour of substrate or product at regular intervals (or using a continuous data logger) throughout reaction
○ Plot on a graph with time on the x axis and
whatever is being measured on the y axis
○ Draw a tangent at t = 0 (or any other time for rate at a particular point)
○ Initial rate of reaction = change in y / change in x; example units = cm3 s-1
Describe how processed data can be presented as a graph
● Independent variable on x axis, rate of reaction on y axis, including units
● Linear number sequence on axis, appropriate scale (graph should cover at least half of grid)
● Plot coordinates accurately as crosses
● Join point to point with straight lines if cannot be certain of intermediate values OR draw a smooth curve but do not extrapolate
Explain why the rate of reaction decreases over time throughout each experiment
● Initial rate is highest as substrate concentration not limiting / many E-S complexes form
● Reaction slows as substrate used up and often stops as there is no substrate left
Suggest a safety risk and explain how to reduce this risk.
● Handling enzymes may cause an allergic reaction
● Avoid contact with skin by wearing gloves and eye protection
Explain a procedure that could be used to stop each reaction.
● Boil / add strong acid / alkali → denature enzyme
● Put in ice → lower kinetic energy so no E-S complexes form
● Add high concentration of inhibitor → no E-S complexes form
Explain why using a colorimeter to
measure colour change is better than
comparison to colour standards.
● Not subjective
● More accurate