Statistics and Data Analysis: Key Concepts and Methods
1/37
There's no tags or description
Looks like no tags are added yet.
Name | Mastery | Learn | Test | Matching | Spaced | Call with Kai |
|---|
No analytics yet
Send a link to your students to track their progress
38 Terms
Nominal LOM
categories w no order
- qual and simplest LOM
ex) eye color, major
Ordinal LOM
can be ranked
- qual
ex) class ranks
Interval LOM
# data w no true 0
- quan
ex) temperature
Ratio LOM
# data with a true 0
- quan and most info
ex) height, age, money
Random sampling
everyone has equal chance of being selected
stratified sampling
divide pop into groups and select from each group
ex) students from every grade level
descriptive statistics
describe/ summarize data you already have
QUALitative data
categorical responses
QUANitative data
# data
inferential statistics
uses a sample to make conclusion about a population
systematic sampling
everyone assigned number, every __kth # is picked
ex) every 10th customer
Formula: F= N/n= kth number
cluster sampling
divide pop into clusters & select 1 or more to be included
** at least 1 group left out (diff than stratified)
ex) NYC boroughs but leaving Stat Island out
histogram
bars touching
- used w quan data
ex) weight, age...70-80, 80-90, 90-100
bar graph
space between bars
- used w qual data
ex) major and eye color... green, blue, brown
Scatterplot
shows relationship between 2 variables
- shows correlation/ association; r
boxplot
shows median, quartiles, min & max, spread of data
- can help show outliers
skewed right distribution
data toward left
- mean> median
skewed left distribution
data toward right
- median> mean
mean vs median vs mode
mean: avergae (add all and divide)
median: middle value, 50th percentile, in ordered data (avrg of 2 middle ones if uneven)
mode: mode frequent value
standard deviation
big SD= data spread out
small SD= data close to mean
quartiles and IQR
q1= first quartile 25%
q2= second quartile/ median 50 %
q3= third quartile 75%
IQR= q3-q1
Probability
- probability NEVER (-)
- between 0 & 1 (not bigger than 1)
independent vs dependent events
- one event doesnt affect probability of another event
- one event changes the probability of another event
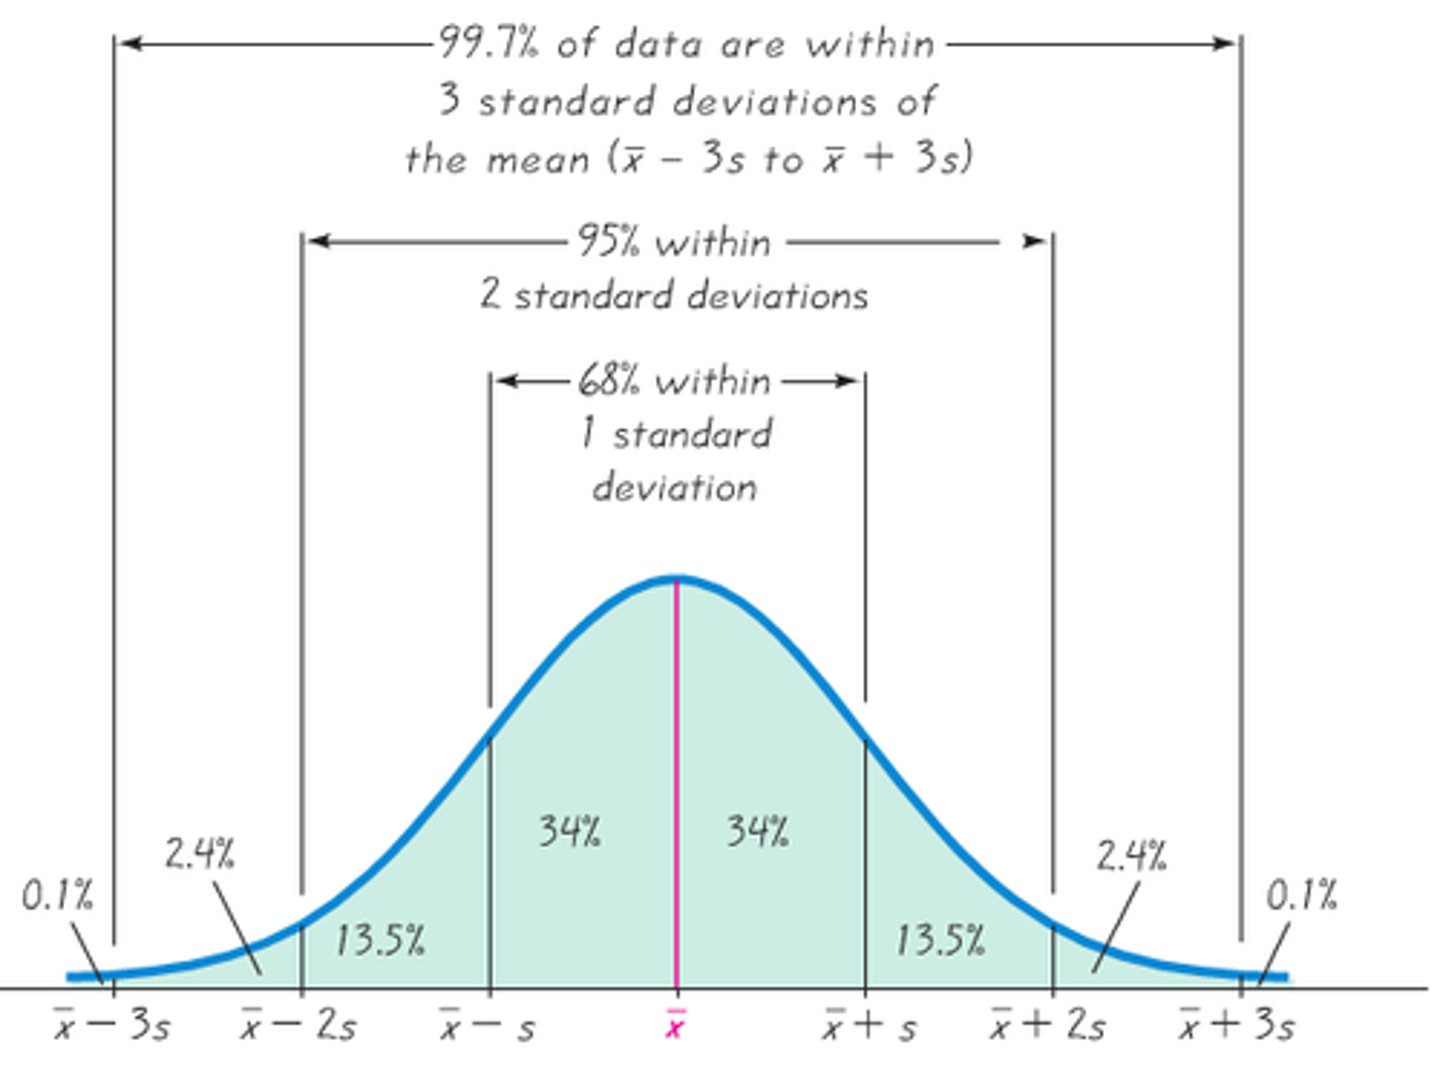
Empirical Rule
1 sd= 68 % of data
2 sd= 95% of data
3 sd= 99.7% of data
Z Score
# of sd's from the mean
+Z = above mean
-Z= below mean
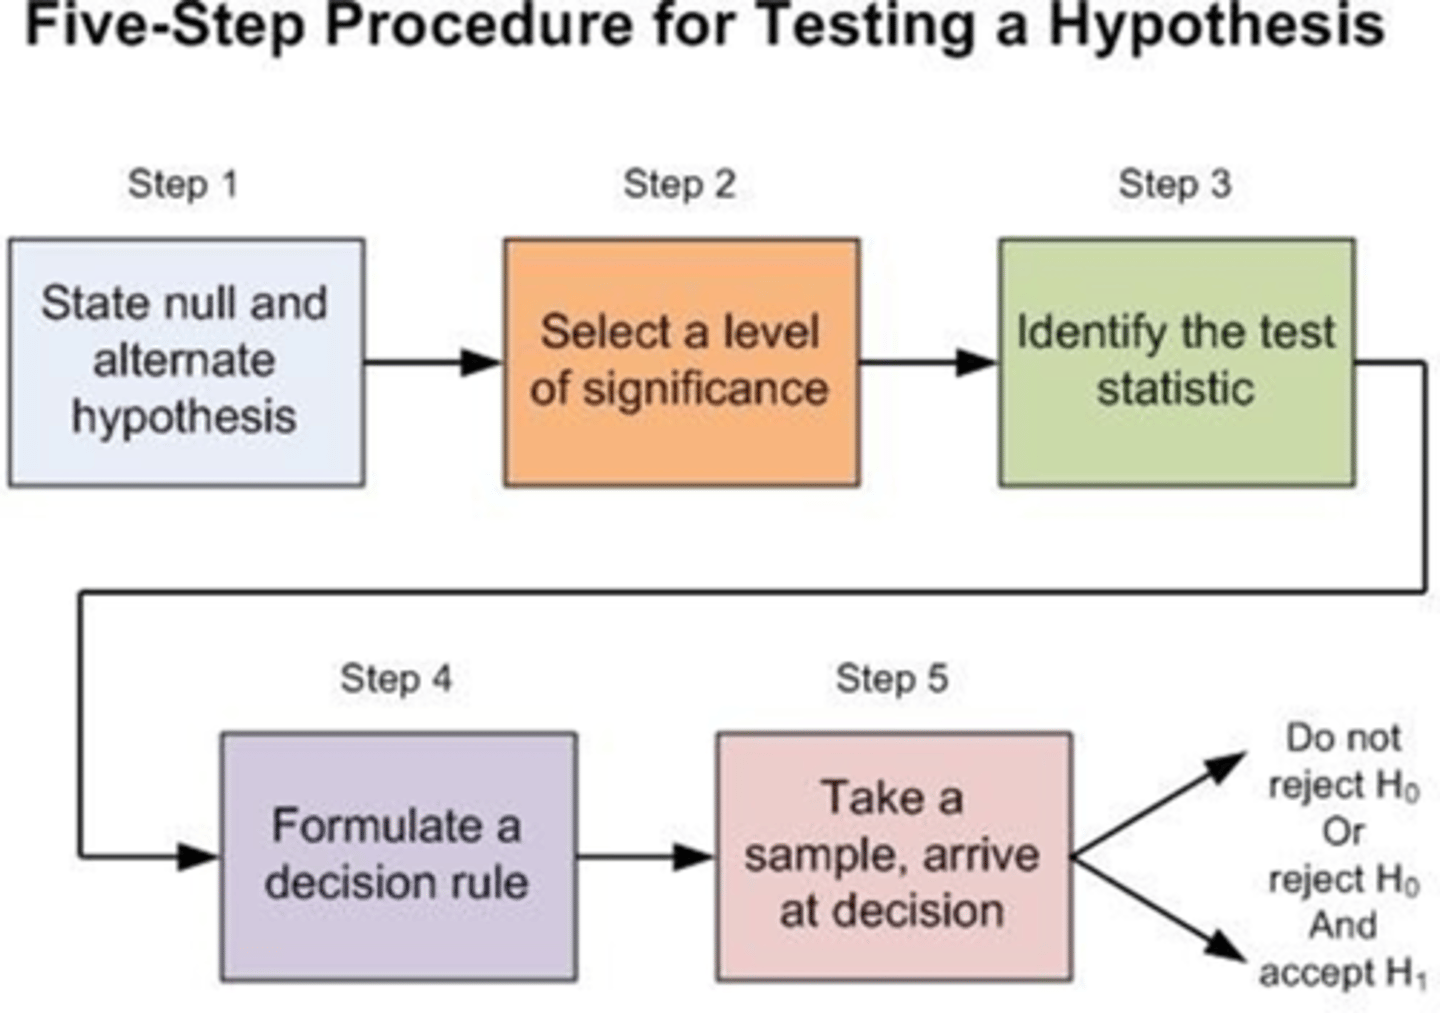
Hypothesis Testing (5 steps)
Z test = po (sigma) sd. t test = 's' sd
- null (no change) and alt (claim) hypothesis
- locate z critical values (table F with alpha & 1 or 2 tails)
- draw distribution w critical values to see rejection region
- test statistic
- decision; reject or not reject
- summary of results
p- value
- compare p-val to a to decided to reject or not
- p is low h0 goes (reject)
- p is high h0 stays (dont reject)
ex) if a= .05 and p= .02.... .02<.05 .... Reject H0
if a=.05 and p= .18.... .18>.05 .... Don't Reject H0
Correlation
relationship between2 variables
correlation coefficient (r) = sample strength and direction of correlation
+ correlation = variables same direction
- correlation = variables in opposite directions
when correlation coefficient r is close to 1 or -1, what does it mean?
strong positive or negative correlation
- closer to 0 = weak/ no correlation
In Pearson's Correlation... x = ? and y = ?
x = independent
y = dependent
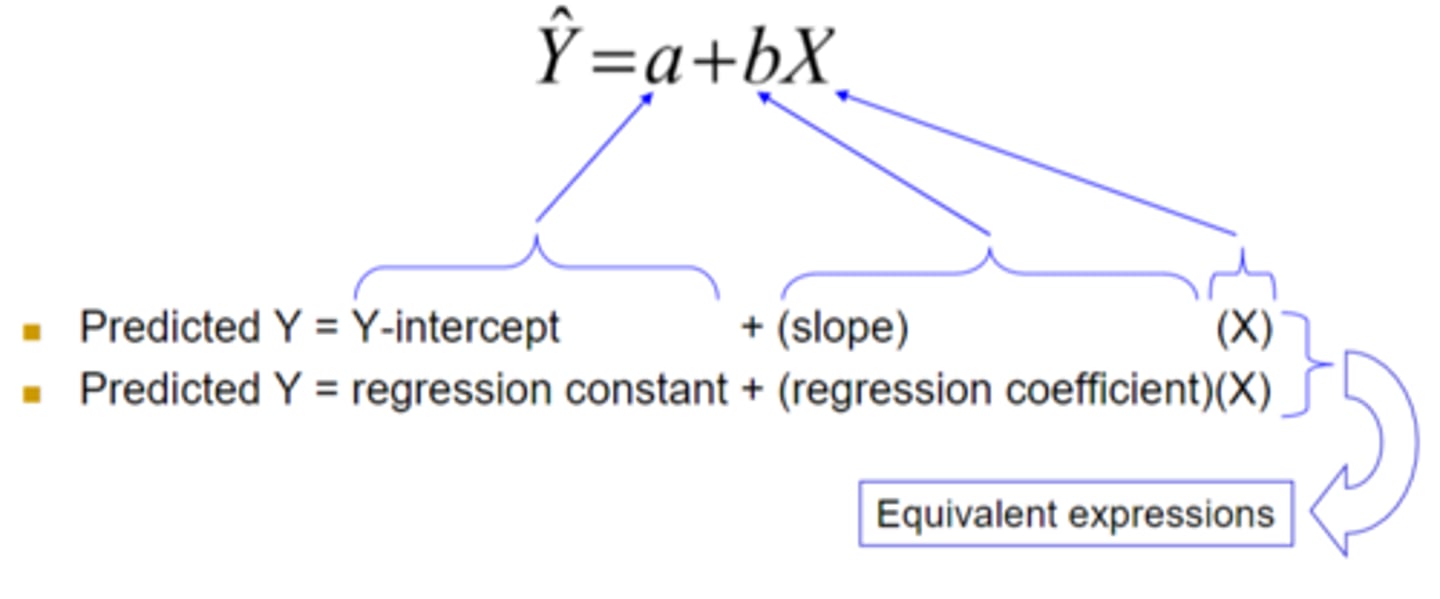
simple linear regression analysis
should be done is Null is rejected from Correlation Test
Formula = y= a + bx
** can find a and b in calc
coefficient of determination
aka Explained Variable
- r^2, then make a %
- tells us how much variability in y can be explained by x
coefficient of non-determination
aka Unexplained Variable
- subtract the explained variable from 100%
- tells us what is unexplained
Chi Square test of Independence
- tests if 2 variables are related or not
. Null = variables are not dependent
. Alt = variables are dependent
. degree of freedom = (rows -1)(columns -1)...table G
. always one positive c.v.
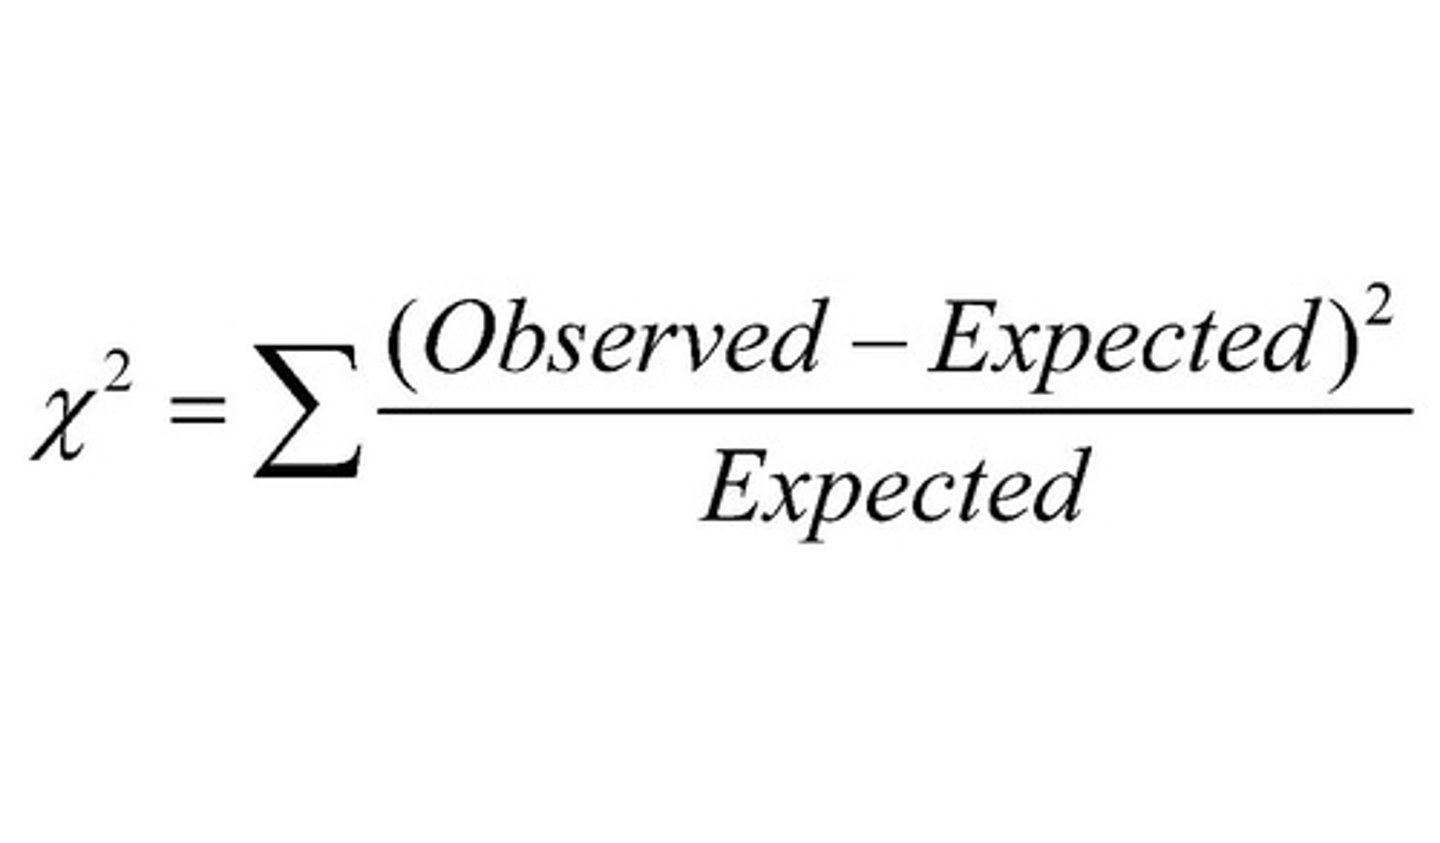
Chi Sqaure: test stat
** need to have the expected counts (observed counts given)
- Formula for E.C. = (Row total)(Column total) / entire total
. E.C. gives # it should be if variables are independent/ not related
not true flashcard
ok
chi sq = .. data
correlation/regression = …. data
categorical - use table of counts/ freq
numerical - pairs of #