Lesson 11 - Decision Making
1/12
There's no tags or description
Looks like no tags are added yet.
Name | Mastery | Learn | Test | Matching | Spaced | Call with Kai |
|---|
No analytics yet
Send a link to your students to track their progress
13 Terms
Automatic vs reflective systems
Automatic systems
Uncontrolled fast, unconscious
Reflective systems
Controlled, slow, conscious
How do we making voting decisions
Those who looked more competent won the voting decision/ was the most picked
Bounded rationality/ thinker —> bounded decision making
Uses heuristics to make decisions b/c they have limited info, cognitive limitations and time constraints
Use heuristics and tend to make systematic errors and mistakes in your judgments and decision making
Heuristic = quick thinking
We use heuristic bc its quick and useful for us
Bounded thinker is limited by:
Limited info
Cognitive limitations (Brain cant process a lot of info)
Time constraints
Anchoring and adjustment: 1991 study of 10 corporations being ranked by Fortune to be among the 500 largest US-based firms according to sales volume
Group A: Apple, Levi Strauss, Maytag etc..
Group B:Conagra, United Technologies etc…
Participants were asked which Group had the largest total sales volume
Results
Most participants chose Group A, which is wrong —> They chose Group A because the names felt most familiar so your brain assumes this Group has the largest total sales volume
Group B actually had the most total sales volume
People rely on familiarity instead of actual data, leading them to overestimate well-known companies and make incorrect judgments.
1. Anchoring and adjustment
Anchors are starting points based on some piece of available info
Once the anchor is set, the outcome is biased around it
2. Availability heuristic
People judge how likely something is based on how easily examples come to mind. Influenced by 2 factors:
Accessibility: How easily you can recall something
Salience: How vivid or noticeable it is
E.g Example: You might trust a friend’s story more than objective data (like consumer reports) because it’s easier to remember.
3. Representativeness
How representative/ similar A is to their stereotype of B
Based on similarity
People respond based on their stereotypes
Subjective value function
Objective vs subjective value function
Objective value: When something is objectively or actually worth
e.g $100 is actually worth $100
Subjective value: what it is worth to you —> how much value you place on something regardless of the objective value
e.g you think $100 is alot but Bill Gates probably think $100 is little
The subjective value function states that as we get more of something, we value subsequent increments of that thing less and less —> the more you already have of something, the less extra happiness or value you get from getting a little more of it.
The subjective value function shows diminishing sensitivity: identical differences are perceived as larger when values are low (e.g., 3% vs 5%) than when values are high (e.g., 95% vs 97%), leading to different judgments despite equal objective differences.
A change from 3% bad to 5% bad feels like a big jump in badness.
But a change from 95% good to 97% good does not feel like a big jump in goodness. Even though mathematically both differences are 2%.
Example:
If you have $10, getting $20 more feels like a big gain.
If you already have $1010, getting $20 more usually does not feel nearly as important.
So even though the objective increase is the same: $20 is actually $20
10 → 30 = +20
1010 → 1030 = +20
the subjective value is bigger in the first case.
Framing
Framing is when the way information is worded as a gain or a loss affects how people judge it and what they choose —> Framing means people react differently depending on whether the same outcome is described as a gain or a loss.
GAIN FRAME
Plan A: This plan will save 1 of the 3 plants and 2000 jobs
Plan B: This plan has a 1/3 probability od saving all 3 plants and all 6,000 jobs
LOSS FRAME
Plan C: This plan will result in the loss of 2 of the 3 plants and 4,000 jobs
Plan D:This plan has a 2/3 probability of resulting in the loss of ALL 3 plants and all 6,000 jobs
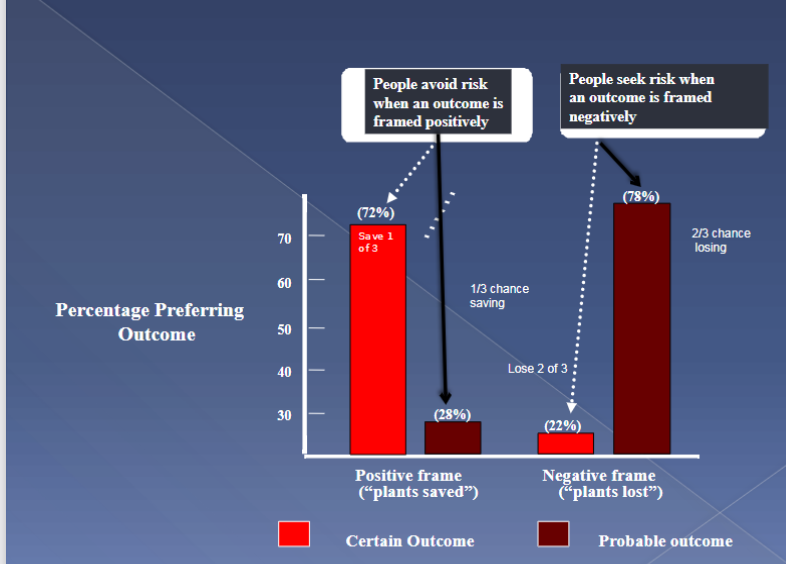
Summary of the graph:
When the situation is framed as a GAIN (plants saved):
Most people (72%) choose the safe option (Plan A)
Only 28% choose the risky option (Plan B)
People avoid risk when thinking about gains
When the situation is framed as a LOSS (plants lost):
Only 22% choose the safe option (Plan C)
Most people (78%) choose the risky option (Plan D_
People seek risk when its framed as a loss
“ I aleady know I’m losing something, so I might as well take a chance and try to avoid that loss.”
Overall:
Gain frame → people prefer the safe option
Loss frame → people prefer the risky option
Prospect Theory
Losses feel worse than gains feel good
“A loss of x hurts twice as much as a gain of x pleases”
The pain of losing $100 is stronger than the happiness of gaining $100
The judge–advisor paradigm
How much do people rely on advice vs. stick to their own judgment?
studies how individuals adjust their initial decisions after receiving advice, by measuring how much their final judgment shifts toward the advisor’s recommendation.
Results:
People change their answers toward advice, but usually less than they should —> only change their answers a little bit bc they still trust themselves more
Egocentric advice discounting
People trust themselves more than others’ advice —> People tend to underweight
advice from others and over-weight their own opinions. Likely to be particularly true when decision makers perceive their own opinions to be superior to those of other peoplePeople will trust their decisions more when:
1. Person feels optimistic they will make a good decision
2. Person feels that they have the decision under control
3. Person feels confident about their ability
4. Amount of power
Feeling powerful makes people trust themselves more and rely less on advice
High power → LOW use of advice
Low power → HIGH use of advice
Narcissism
A personality trait where people have an inflated, overly positive view of themselves
Think they are better than others
Believe they are special or unique
Have overconfidence in their abilities
Feel entitled (deserve more than others)
Key point: Narcissistic people are less likely to take advice because they trust themselves more
High narcissism → LOW use of advice
Low narcissism → More cooperative / dont think highly of themselves —> HIGH use of advice