Biology H - Ecology Unit
1/36
There's no tags or description
Looks like no tags are added yet.
Name | Mastery | Learn | Test | Matching | Spaced | Call with Kai |
|---|
No analytics yet
Send a link to your students to track their progress
37 Terms
- Autotrophs (producers) are…
- This classification consists of:
- organisms that produce their own food.
- Plants, some bacteria, some archaea, and some protists.
- Heterotrophs (consumers) are…
- This classification consists of:
- organisms that consume nutrients from an outside source.
- Animals, some bacteria, some archaea, and some protists.
- Decomposers are…
- This classification consists of:
- organisms that breakdown other dead organisms/waste, releasing vital organic nutrients in the soil for plants (such as Nitrogen and Phosphorus).
- Fungi and some bacteria.
In a food web, the arrows point according to the direction of…
energy transfer.
Explain the Ten Percent principle in Ecology:
- The ten percent rule in ecological food pyramids states that when energy is passed in an ecosystem from one trophic level to the next, only about 10% of the energy is passed on.
- The remaining 90% is lost as heat, used for metabolic processes, or lost as waste.
Because the Ten Percent principle dictates that energy is reduced by 90% at each step, food chains rarely exceed 4 or 5 trophic levels because…
there simply is not enough energy at the top of the pyramid to sustain an additional level of predators.
In one sentence, Ecology is…
the scientific study of the interactions between organisms and their environment.
Biosphere
The part of Earth where there is life.
All ecosystems consist of biotic and abiotic factors, and they affect the distribution of organisms. Briefly explain what each factor is, and exemplify them:
- Biotic Factors: The living components of an environment, such as the various kinds of interactions between producers, consumers, and/or decomposers.
- Abiotic Factors: The non-living components of an environment, such as temperature, precipitation, soil pH levels, elevation, atmospheric pressure, and more.
Explain the differences between a population, a community, and an ecosystem:
These three ecological levels represent a scale of increasing complexity:
- A population is a group of the same species living together.
- A community includes all of the various populations interacting in that same area.
- An ecosystem goes a step further by combining that entire living community with the non-living, physical environment.
The biomes accounting for the largest part (~75%) of the biosphere in terms of area are…
aquatic biomes.
Biomes vs. ecosystems:
- An ecosystem is a specific, localized community of living organisms interacting with each other and their non-living environment (like a rotting log or a single coral reef).
- A biome is a massive global region classified by its climate and dominant vegetation, meaning a single biome contains many different ecosystems within it.
Carrying Capacity
The amount of individuals an environment can (naturally) support.
Biotic Potential
The maximum rate at which a population increases under ideal conditions.
The fundamental drivers of population change within a species are…
birth, death, and migration (immigration and emigration).
Relationships between species in a community are referred to as interspecific interactions, and they directly affect a species’ survival and reproduction. List each of the main relationships:
- Competition
- Predation
- Herbivory
- Symbiosis
Parasitism
Mutualism
Commensalism
- Disease
Classify how each kind of interspecific interactions affect their interacting species:
- Interaction is detrimental to both species (–/–):
Competition
- Interaction is beneficial to one species, but detrimental to another(+/–):
Predation
Herbivory
Parasitism
Disease
- Interaction is beneficial to both species (+/+):
Mutualism
- Interaction is beneficial to one species, but does not affect the other(+/0):
Commensalism
Fundamental Niche vs. Realized Niche:
- The initial set of conditions and resources an organism could theoretically use without interference from other species.
- The restricted, typically smaller space and resources a species actually occupies and uses due to limiting factors like competition, predation, and resource availability.
As biodiversity increases, ecosystem stability…
also increases.
Biodiversity has two main components. Describe each:
- Species richness: The total number of different species in the community.
- Relative abundance (AKA species “evenness”): The proportion each species represents of the total individuals in the community.
… connect all trophic levels.
Decomposers
Summarize the Carbon (CO2) cycle and humanity’s impact on it:
- The Carbon cycle is the continuous natural process by which carbon moves between the atmosphere, oceans, soil, and living organisms through photosynthesis, respiration, and decomposition.
- Humans have made this cycle unbalanced by clearing forests and burning fossil fuels, releasing carbon into the atmosphere much faster than natural systems can absorb it.
Summarize the Nitrogen (N) cycle:
The process by which specialized bacteria convert atmospheric Nitrogen into usable compounds that plants and animals need to build vital molecules like DNA. Through decomposition and denitrification, this Nitrogen is eventually transformed back into gas and released back into the atmosphere in order to naturally complete the loop.
Invasive species
- Foreign organisms that out-compete native ones by aggressively monopolizing vital resources like food, water, and space, often while lacking natural predators to keep their population growth in check.
- These can be introduced accidentally or deliberately, and most are spread due to human activities.
Rachel Carson
- Credited for starting the modern global environmental movement.
- Author of Silent Spring, a book that exposed the dangers of pesticides for both humans and native species, and its name comes from a pesticide’s abilities of silencing birds’ songs and killing both “good” and “bad” insects (pests).
Biomagnification
- The process where the concentration of toxic substances—like mercury or DDT—multiplies and becomes increasingly concentrated as they move up trophic levels in food chains.
- Occurs because a predator must consume large quantities of prey over its lifetime, and these prey store the toxins in its fat reserves. Thus, they eat accumulating amounts of these toxins.
DDT
- A synthetic pesticide. Widely used in the mid-20th century to control agricultural pests and disease-carrying insects (like mosquitoes and lice), it was largely banned globally following the publication of Silent Spring.
There are three types of dispersion that demonstrate how individuals in a population are spatially arranged within a habitat. Name each and briefly describe how their interactions impact their behavior:
- Clumped dispersion → Individuals aggregate in patches; interactions consist of social grouping due to “patchy” resources (commonly seen in more social species).
- Uniform dispersion → Individuals are evenly distributed; interactions involve territoriality due to limited resources (commonly seen in less social species).
- Random dispersion → Individuals are independently positioned in a location; interactions are neutral due to equal amounts of resources.
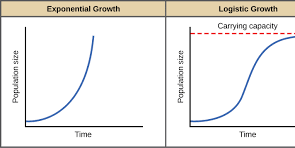
Exponential population growth vs. Logistic population growth
Exponential:
- Associated with r-selected (opportunistic) species:
Little to no parenting.
Rapid maturation.
- Maximize their reproduction/growth rate by producing many offspring with minimal parental care to quickly populate unstable environments.
- Density-independent population regulation.
- Results in J-shaped curve.
Logistical:
- Associated with k-selected (equilibrial) species:
Intensive parenting.
Slow maturation.
- Fewer, high-quality offspring to live near the environment's carrying capacity; rate of increase declines as carrying capacity is reached.
- Density-dependent population regulation.
- Results in S-shaped curve.
Carrying capacity represents the density-dependent regulative factor (r/k) ..., while biotic potential represents the density-independent regulative factor … (r/k)
- Carrying capacity → k
- Biotic potential → r
Density-dependent population regulation (k-selected; prevent population from indefinite J-shaped curve)
- At high densities, we see a decrease in birth rates and increase in death rates. This is because they act as a breaking system to stabilize populations near their carrying capacity.
- Examples of this kind of regulation include:
Resource competition
Territoriality
Predation (concentrated prey makes its population decline)
Disease and Parasitism (concentrated population makes pathogens spread easier)
Toxic wastes
Intrinsic factors (e.g. crowding causing hormonal changes that delay sexual reproduction in rodents)
Density-independent population regulation
- Birth and death rates remain constant across all population densities.
- Are generally abiotic (non-living) and unpredictable.
- Caused by:
Natural disasters
Extreme weather
Human activities (pollution, pesticide use, habitat destruction, etc)
Briefly explain how Logistic population growth connects to density-dependent population regulation:
- Logistic population growth is the direct visual and mathematical result of density-dependent regulation acting on a population.
- As population density rises, resource scarcity and disease increase death rates and lower birth rates, forcing the growth rate to slow down and stabilize at the environment's carrying capacity.
Briefly explain how Exponential population growth connects to density-independent population regulation:
- Exponential population growth occurs independently of population density because it is driven by density-independent regulation.
- In this scenario, abiotic factors like weather, natural disasters, or sudden habitat destruction eliminate individuals regardless of how crowded the population is, allowing unrestricted, rapid growth whenever conditions are favorable.
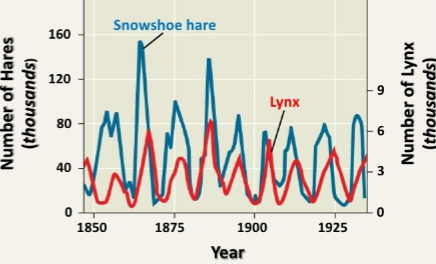
Boom and Bust Model
- Describes a cyclical dynamic where an animal population undergoes a period of rapid, sometimes exponential growth (the boom), followed by a sudden, drastic population crash (the bust). Thus, according to this model, populations fluctuate in density with regularity.
- Hare and Lynx exemplify this model:
Their populations rise and fall together in a tightly linked, 10-year cycle, driven by food availability and heavy predation.

Based on the following graph, which type would represent:
- High death rate for older individuals
- Constant death rate throughout life
- High death rate for young individuals
- Type 1 shows dying at older age
- Type 2 shows dying at steady, average rate
- Type 3 shows dying at younger age
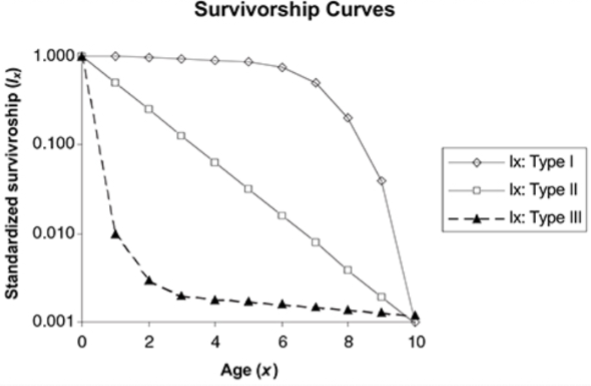
Based on the survivorship curves graph, which type would describe:
- Humans (developed countries)
- Sea turtles
- Squirrels
- 3
- 1
- 2