statistics: 3.1 CORRELATION ANALYSIS
1/11
There's no tags or description
Looks like no tags are added yet.
Name | Mastery | Learn | Test | Matching | Spaced | Call with Kai |
|---|
No analytics yet
Send a link to your students to track their progress
12 Terms
what is a correlation? 1 pt
the degree to which two variables move in coordination with one another; statisitcal measure of the linear relationship between two variables
why is a correlation useful? 1 pt
because it tells us about the relationship between variables
how do we visually represent the relationship between two variables together? 1 pt
using scatterplots
Y axis- dependent variable
X axis- independent variable
what is a linear relationship? 1 pt
a statistical term that we use when the relationship between two variables follows a straight line
positive vs negative linear relationship? 2 pts
positive- as the values of one variable increases so do the values of the other
negative- as the values of one variable increases the values of the other decreases
how to measure a correlation between two variables? 2 pts
covariance- statistical measure of how X and Y vary together
pearson correlation coefficient- a measure of the linear relationship between two variables measured at least at the interval or ratio level (scale) and results are always a number ranging from -1 to 1
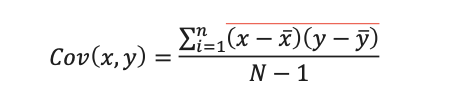
how to calculate covariance? 5 pts
For each participant/observation, calculate the differential score of x > x-mean of x
For each participant/observation, calculate the differential score of y> y – mean of y
For each participant/observation, multiply the differential scores > (x-mean of x) (y-mean of y)
Sum the result of the multiplications across all participants/observations
Divide the result of the sum by the sample size minus 1
what is the problem with covariance? 3 pts
it cannot always be directly interpreted because it can take on very large numbers
has no known bounds and can take on any value
makes it hard to interpret because each variable has its own scale and defined unit
(solution = pearsons r)
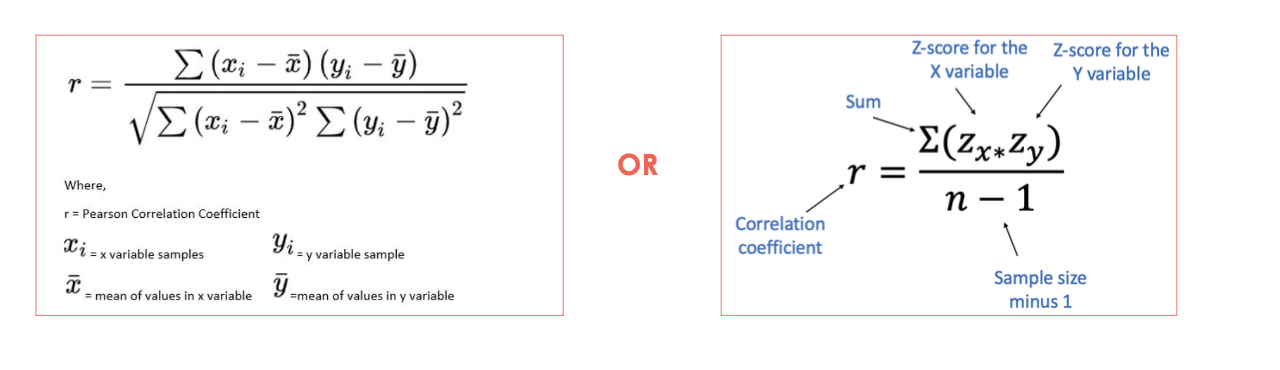
how to calculate pearsons r? 10 pts
calculate the mean of x and the mean of y
for each participant observation calculate x-mean of x and y-mean of y
multiply (x-mean of x) and (y-mean of y) for each participant
sum all the products to get the numerator
for each participant square the x and y deviation scores (x-mean of x)2 and (y-mean of y)2
sum all the products of the squared deviations
multiply the two sums of squared x deviation and squared y deviation
take the square root of this result to form the denominator
divide the numerator from the denominator
result is pearson’s r
(pearsons r= covariance/(standaard deviation of X x standard deviation of Y)
interpreting Pearsons r? 4 pts
r<0.3 → no relationship/ very weak relationship
0.3< r <0.5 → weak relationship
0.5< r <0.7 → moderate relationship
r>0.7 → strong relationship
when can i perform a pearson’s correlation? 4 pts
when your two variables are quantitative
when you assume there is a linear relationship between the two variables; confirm the assumed relationship by creating a scatterplot and visually inspecting if the relationship is linear or not
there should be no significant outliers as pearson’s correlation is sensitive to them and they should be kept at a minimum
variables should be normally distributed; confirm with density plots for each variable separately and observe the shape of the graph or use shapiro-wilk test of normality
what is an outlier? 1 pt
a point that does not follow the usual pattern of the graph (extremities)