5 Symbolizing point and linear features
1/25
There's no tags or description
Looks like no tags are added yet.
Name | Mastery | Learn | Test | Matching | Spaced | Call with Kai |
|---|
No analytics yet
Send a link to your students to track their progress
26 Terms
What is this map type?
What do the points represent?
Graduated circle maps
uses points that have a location, but they represent a unit (typically a political unit)
What is this map type?
What do the lines represent?
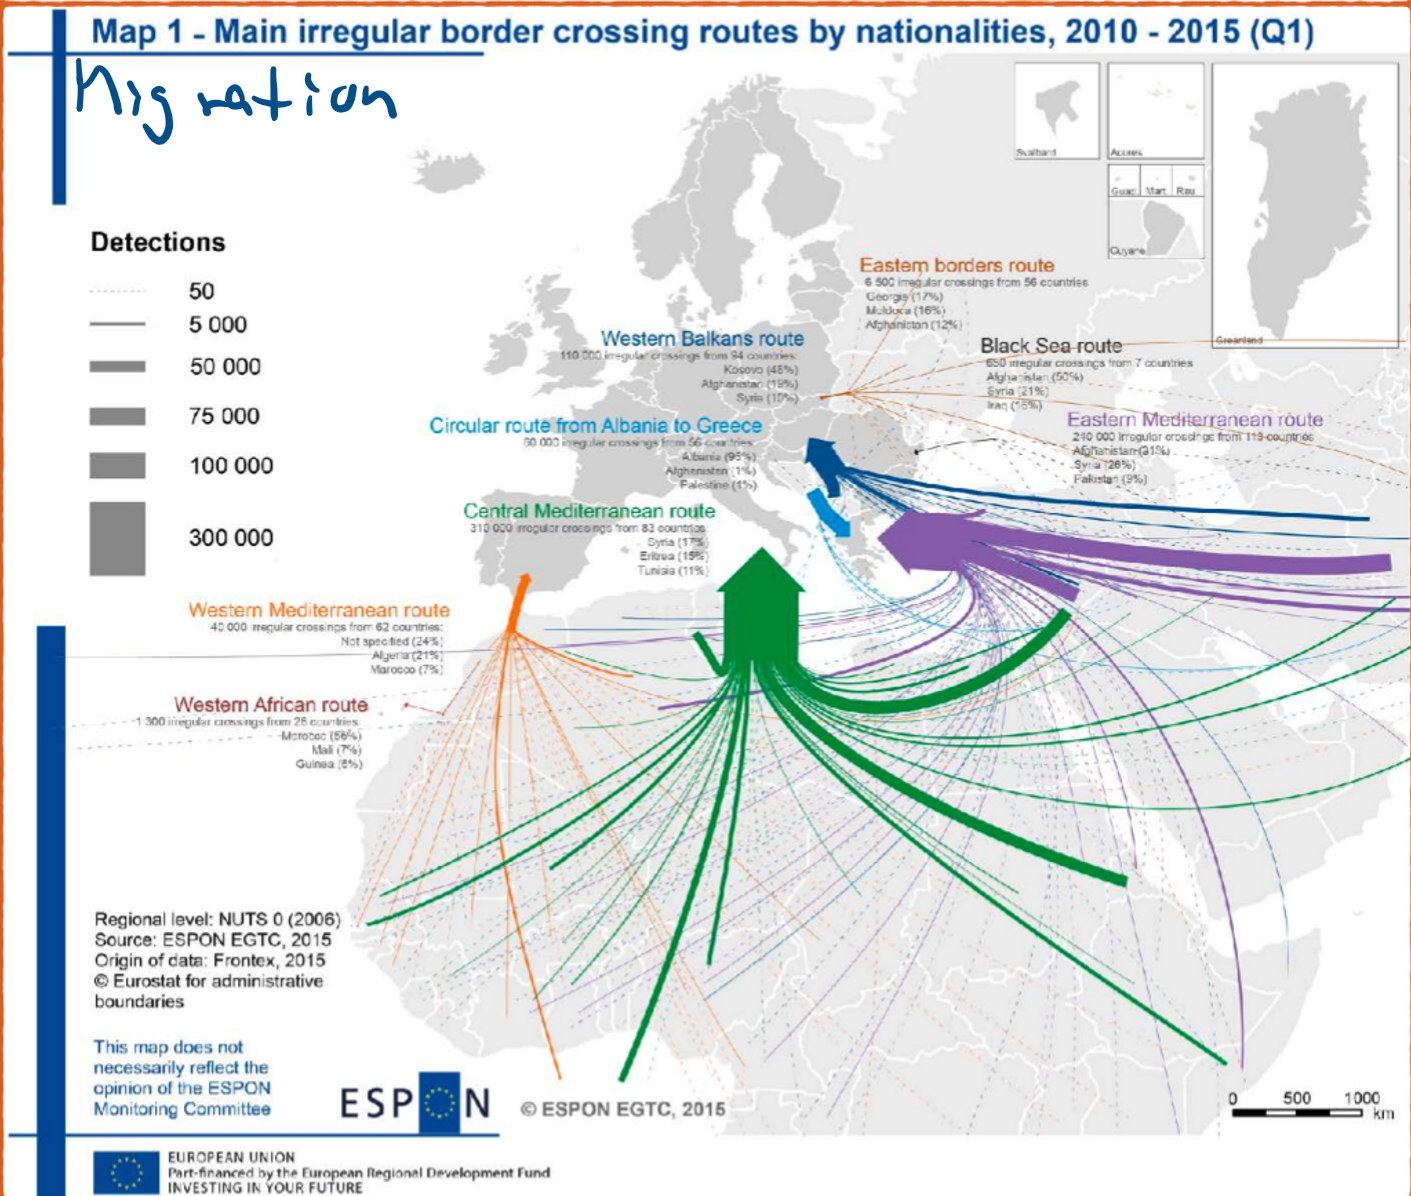
Quantitative flow map
uses lines that are scaled to represent things being moved between locations
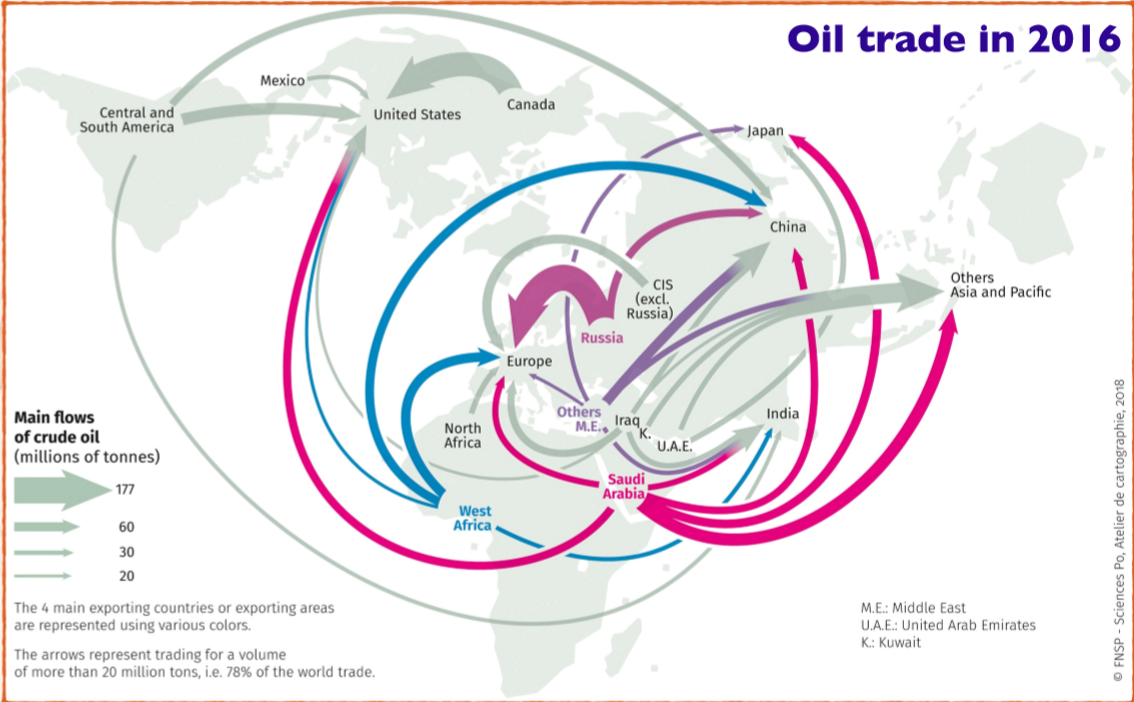
Flow map: Definition
A map used to display the movement of some phenomenon between geographic locations, generally the thickness is varied
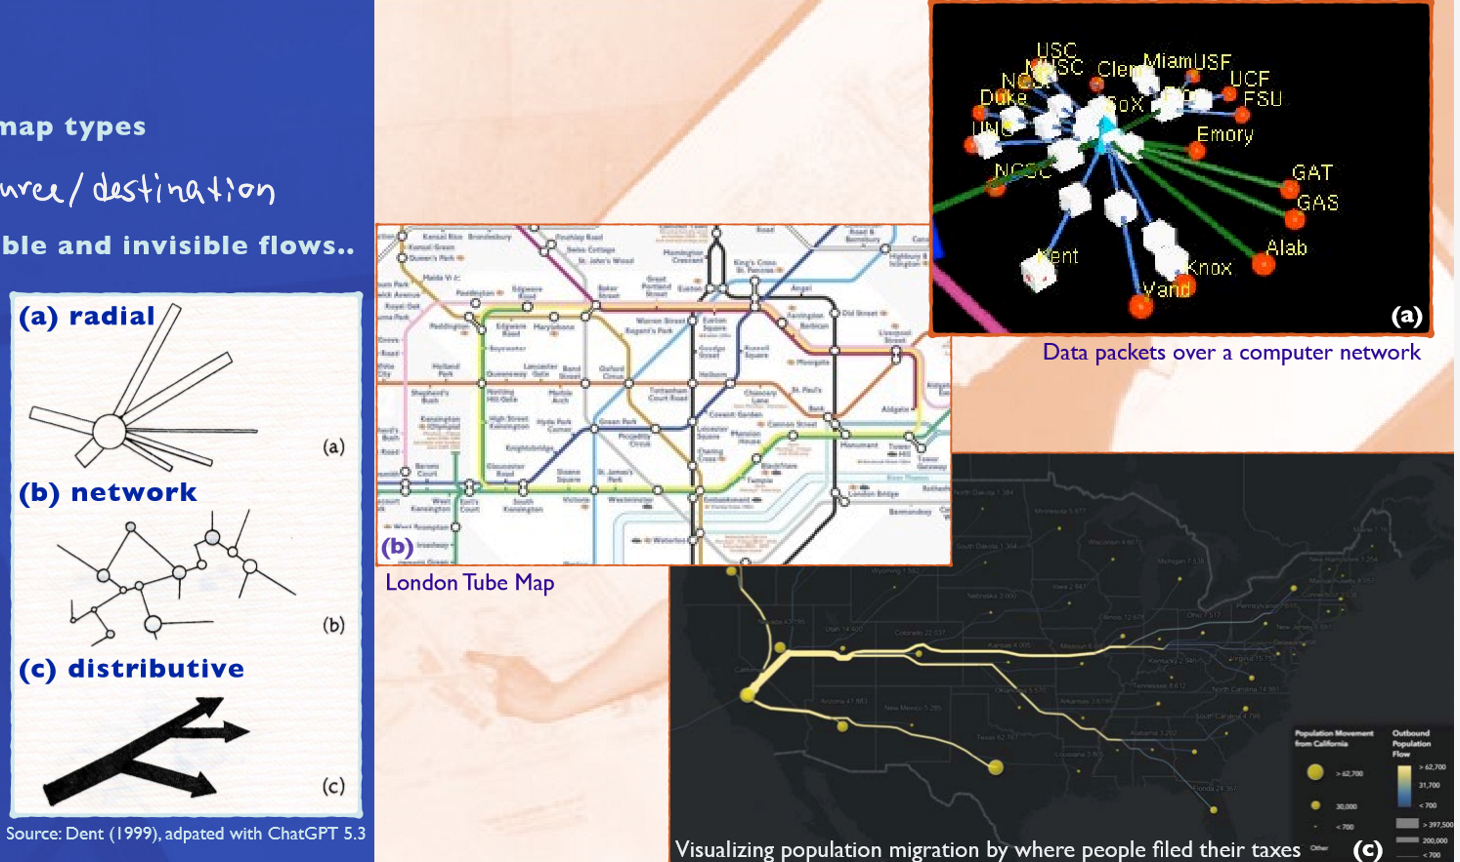
What are 3 types of flow maps?
origin-destination flow maps
continuous flow maps
trajectory-based flow maps
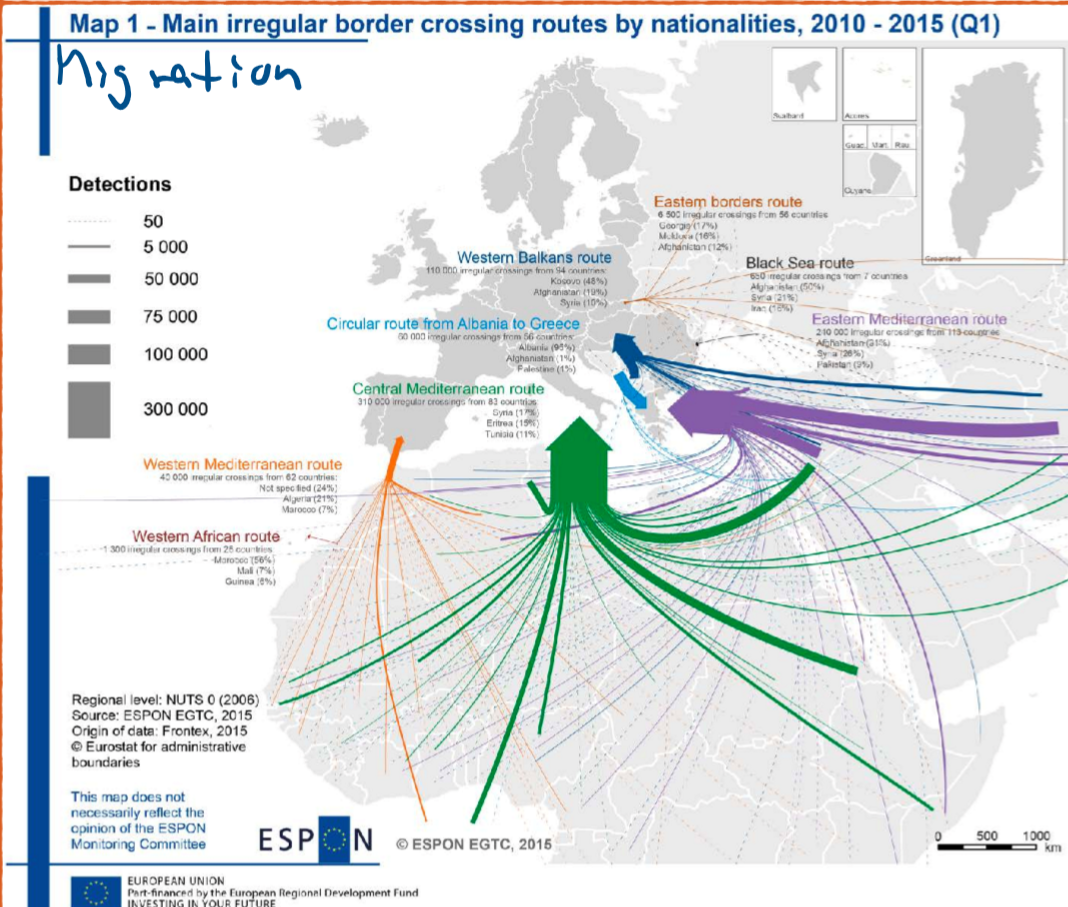
What are origin-destination flow maps?
Example?
portray flows between geographic locations when the actual route of flow is unimportant
Migration
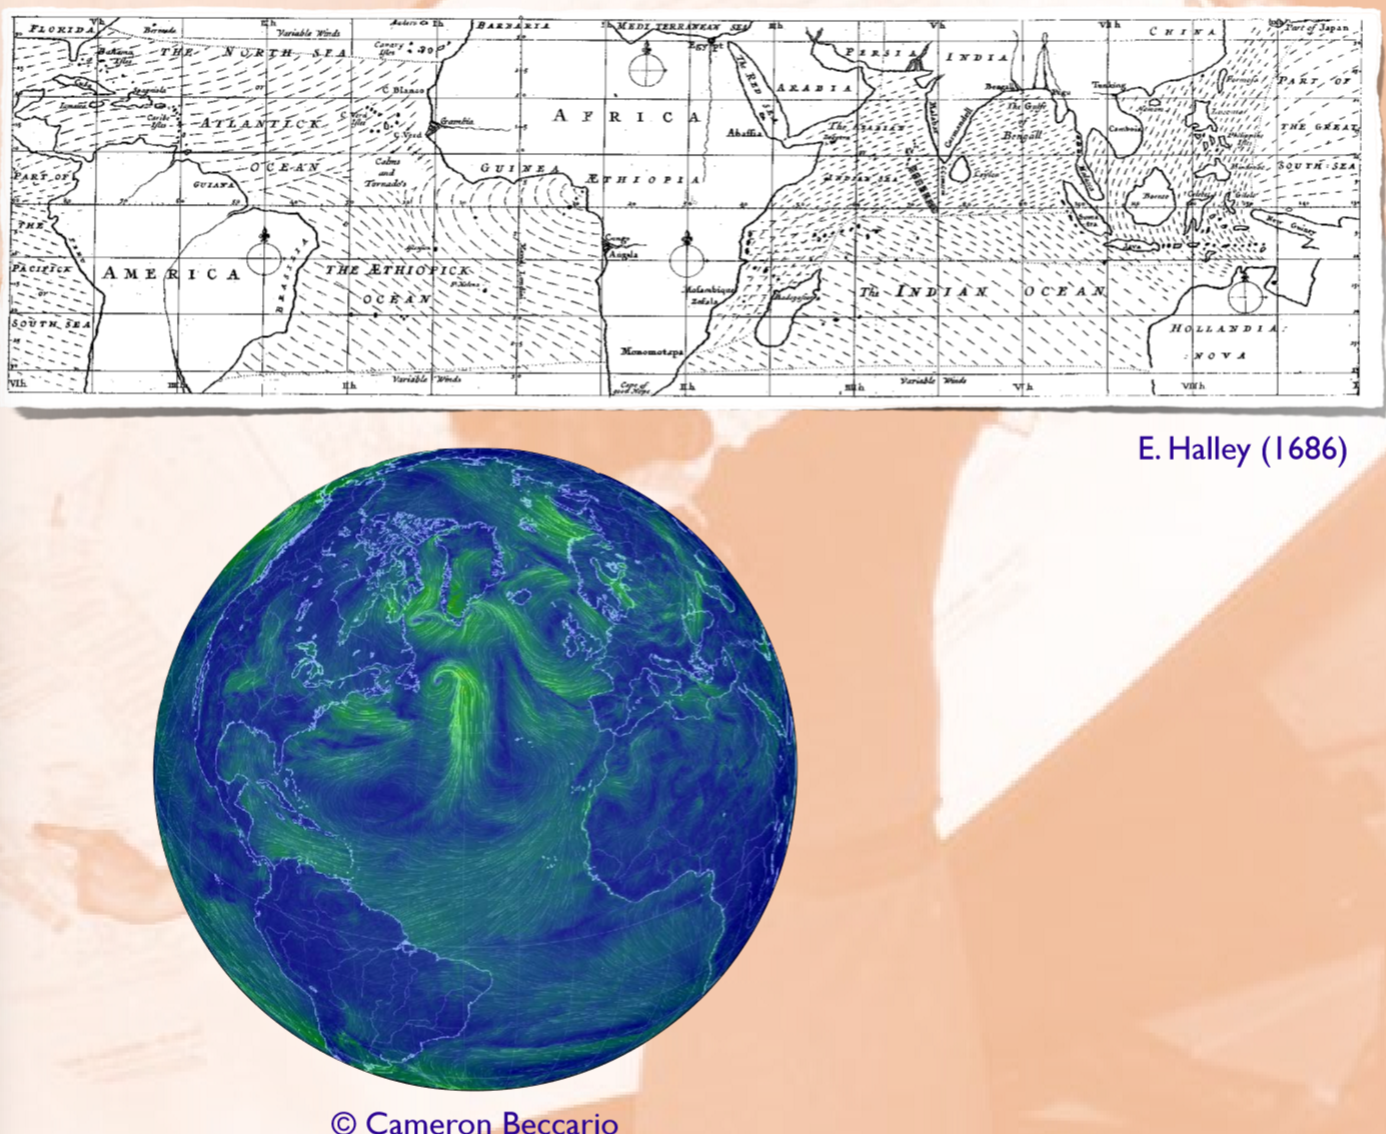
What are continuous flow maps?
Example?
depict the movement of a continuous phenomenon
Wind or ocean currents
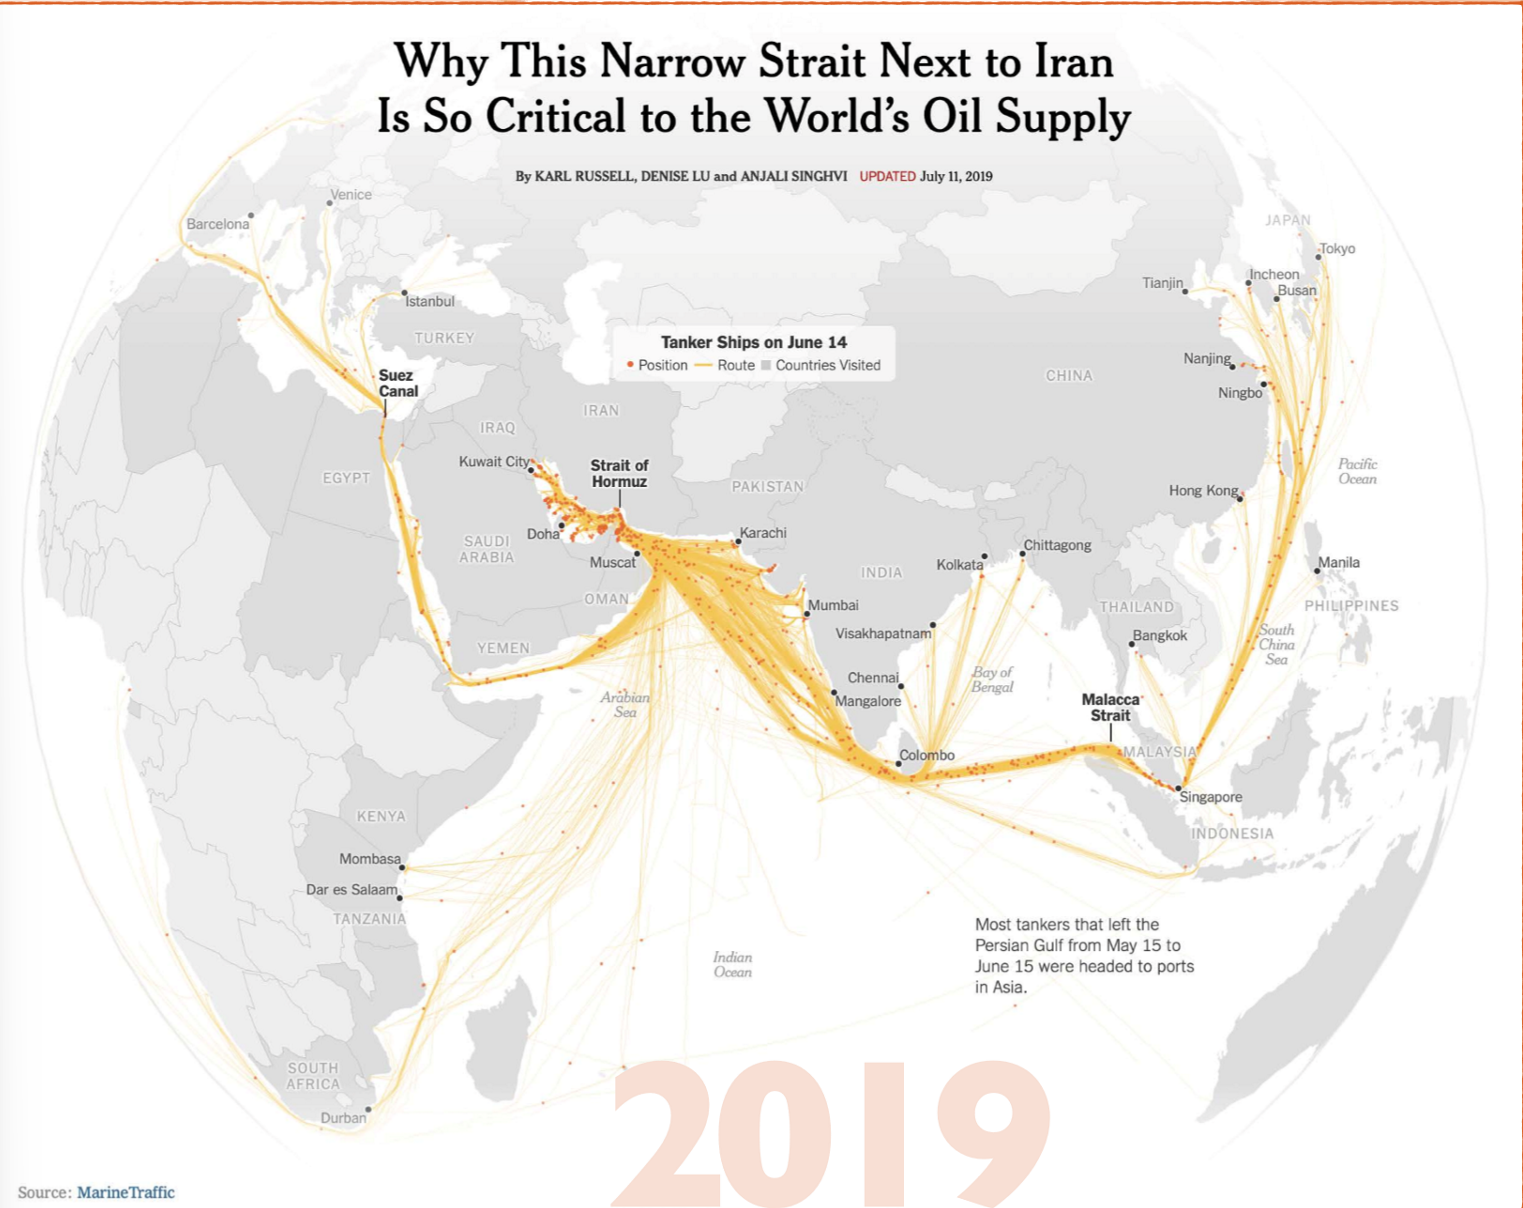
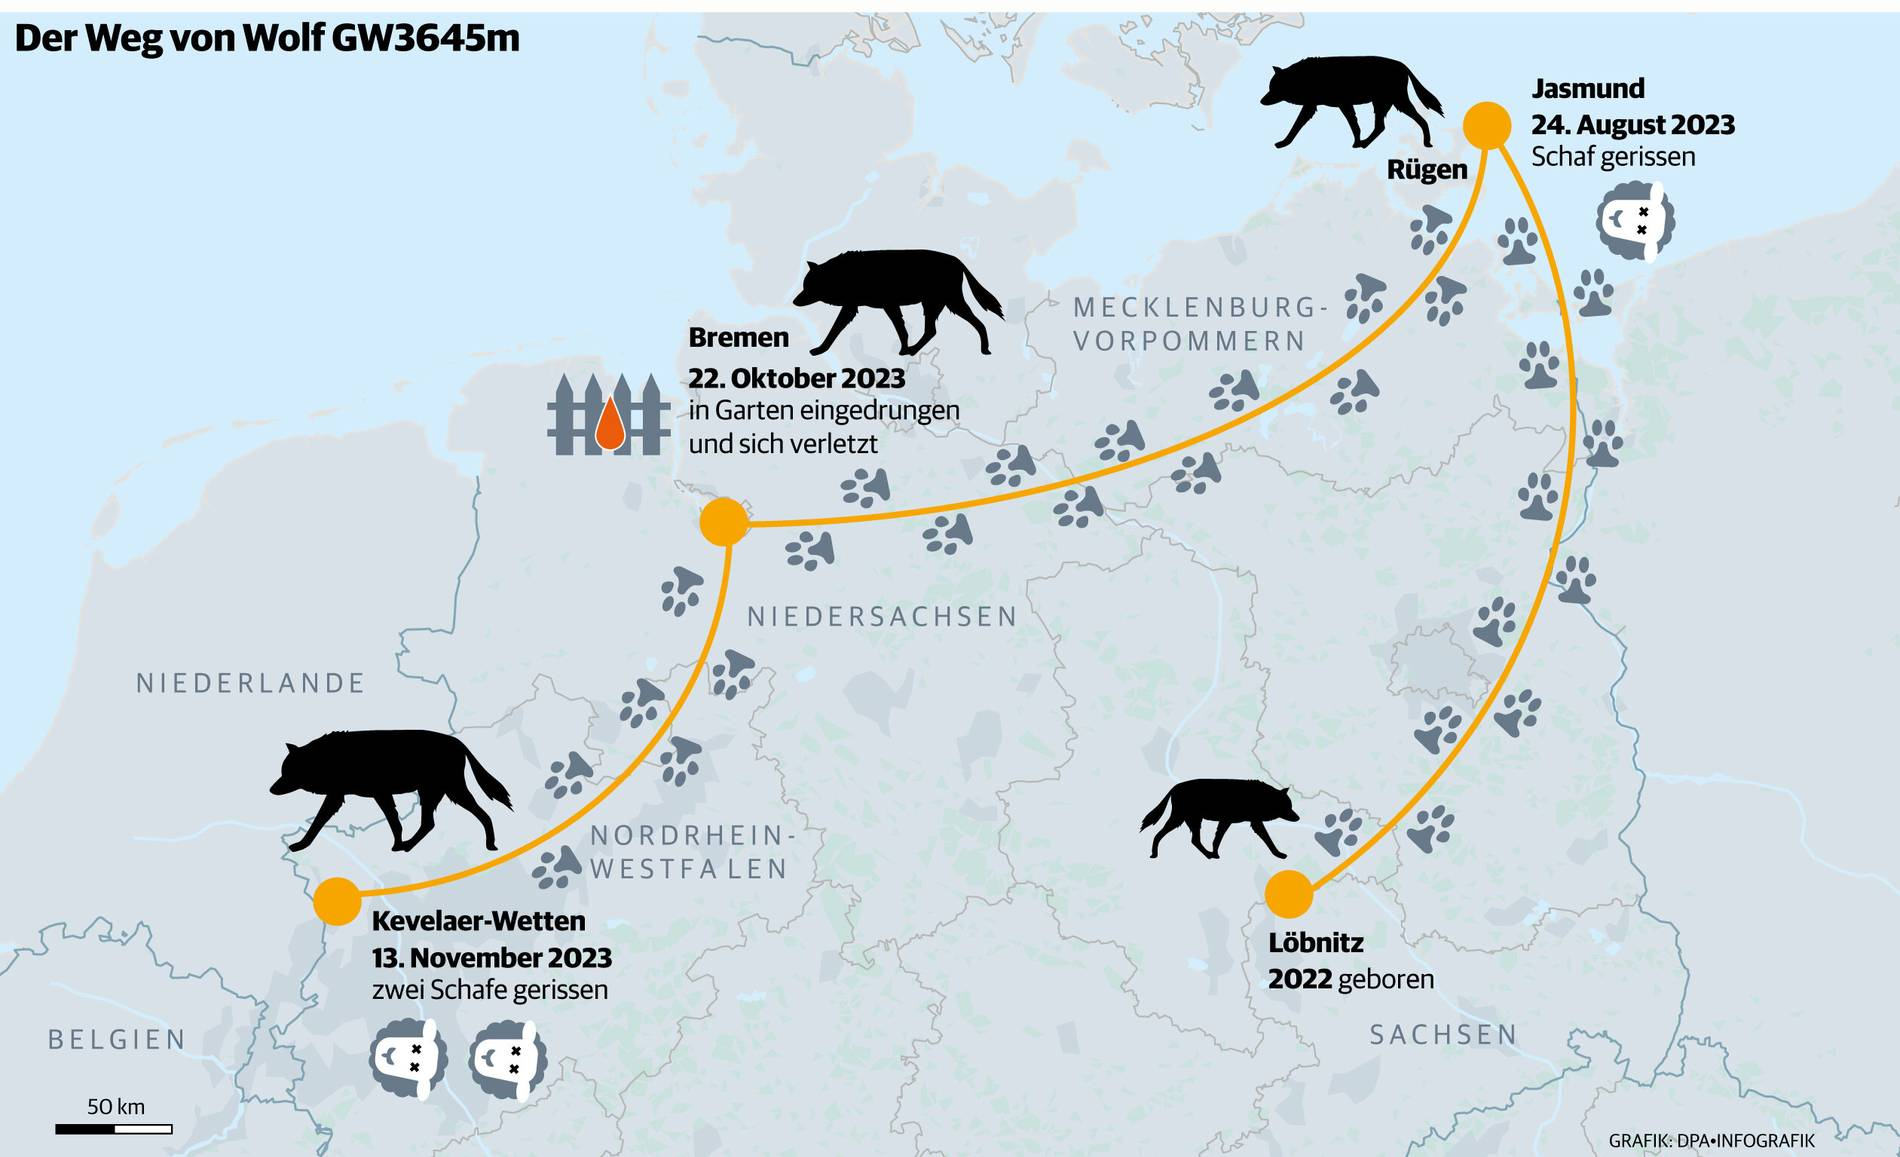
What are trajectory-based flow maps?
Example?
depict flows when the actual flow is important
Routes of members of a wolf pack over the course of several maps
What visual variables (vv) can be used for linear features?
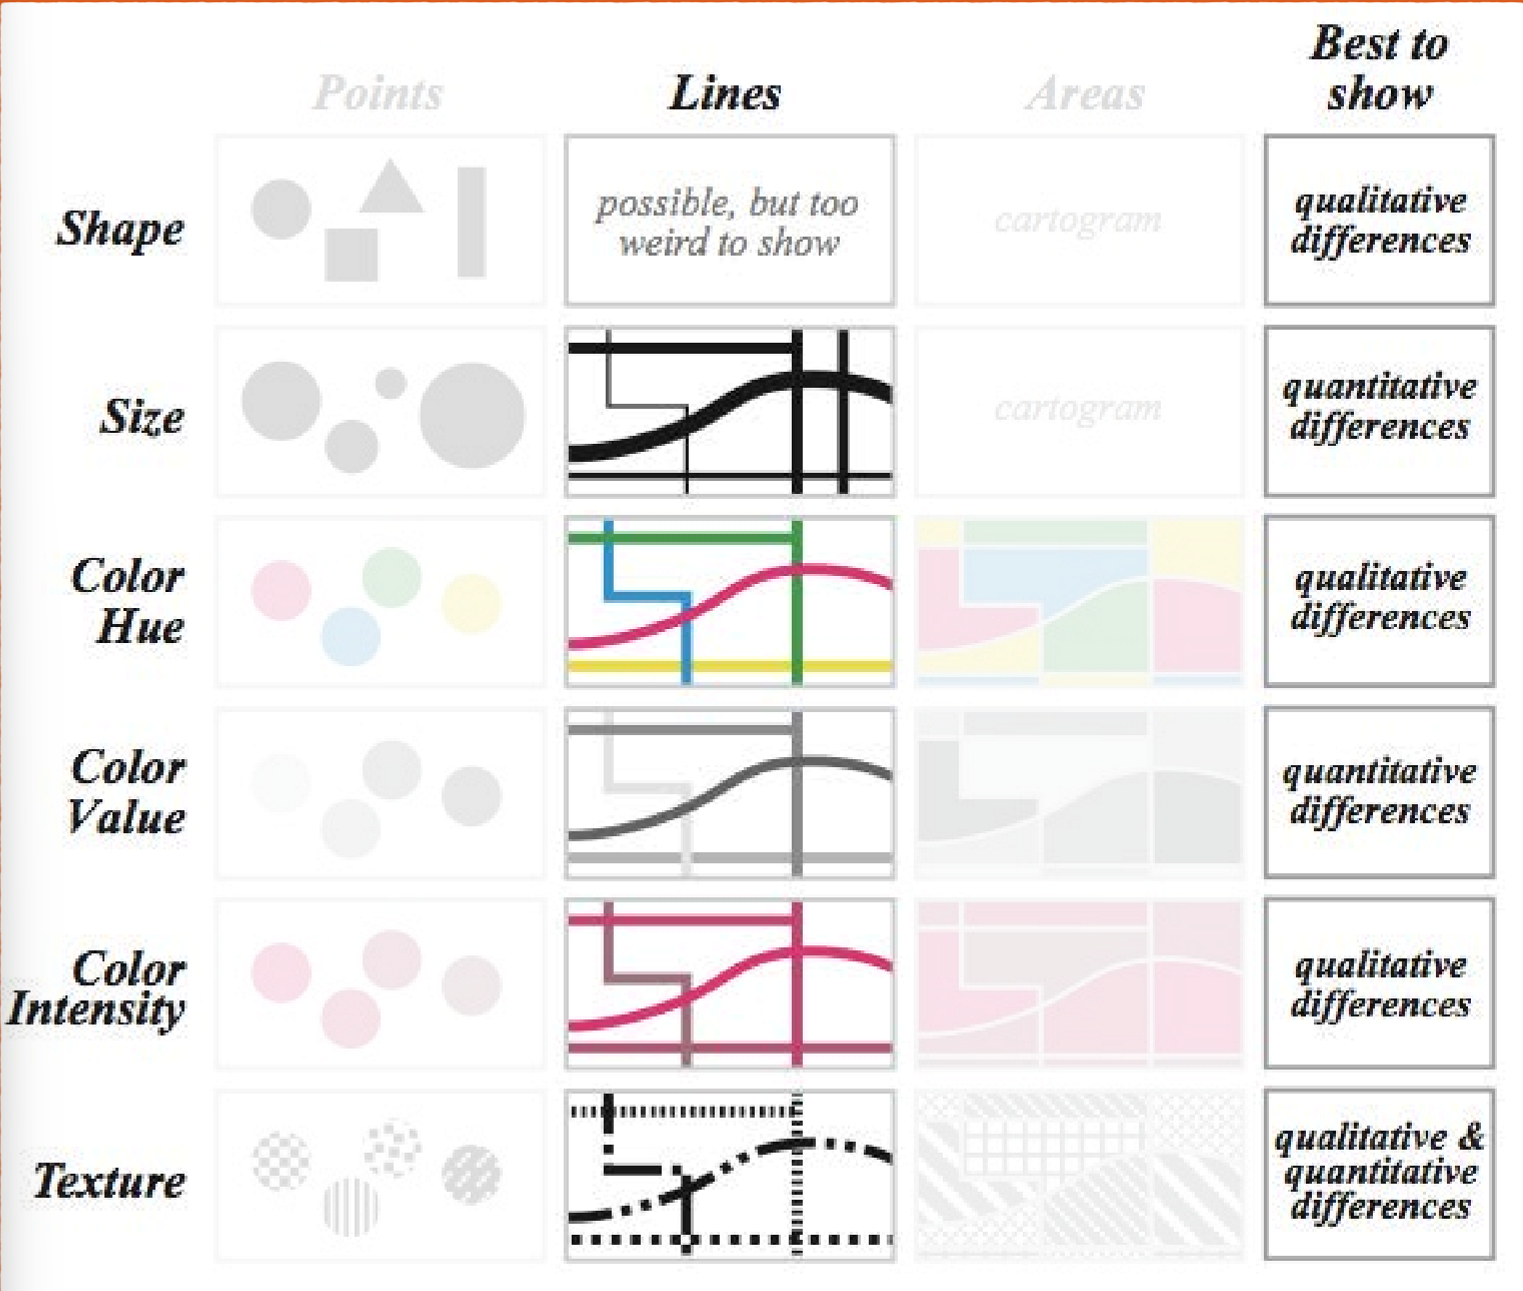
How do you map qualitative data as lines?
What vv can be varied?
Examples?
Qualitative means feature qualites or categories
→ Vary visual variables:
colour hue (categories)
orientation
texture
shape
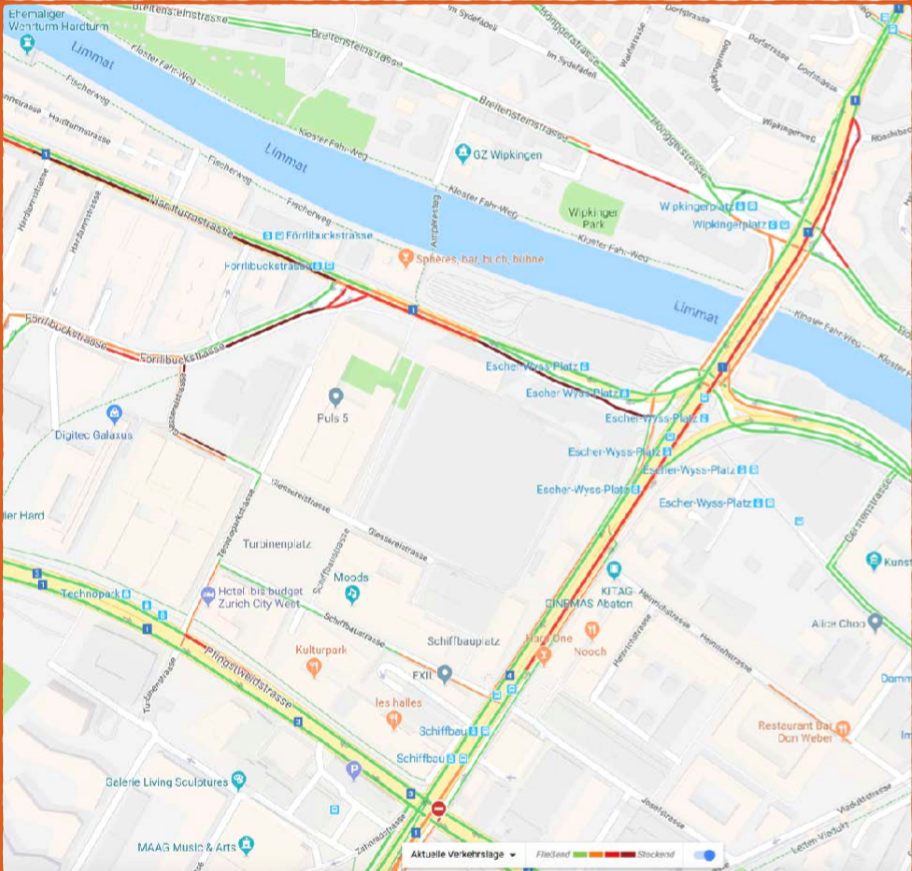
e.g.: traffic, borders, street types
How do you map quantitative data as lines?
What vv can be varied?
Examples?
Quantitative means numbers, varying magnitudes
→ Vary visual variables:
color value
color hue / saturation (categories)
size
e.g. migration, cotton
What is the difference between qualitative or quantitative flow maps?
What vv can be varied for each?
Qualitative: What is flowing along a linear feature? e.g. wind, traffic
orientation
texture
shape
Quantitative: How much is flowing along a linear feature? e.g. migration, cotton
size
What are flow map types that are not origin-destination maps?
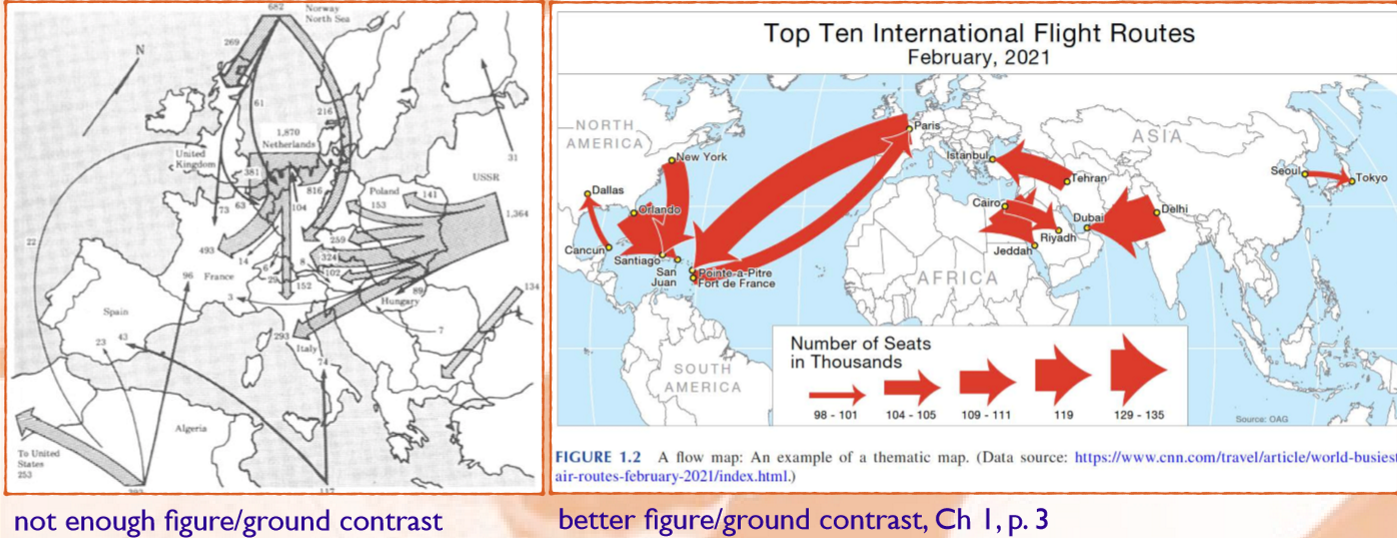
What are issues when designing flow maps?
visual clutter
→ better contrast, e.g. choose a different basemap and color arrows so that the flow sits on top of the map
→ inset map
map projection
→ global or local
line or arrow
→ arrow if direction matters
comprehensive legend
→ units, titles, year, explanation
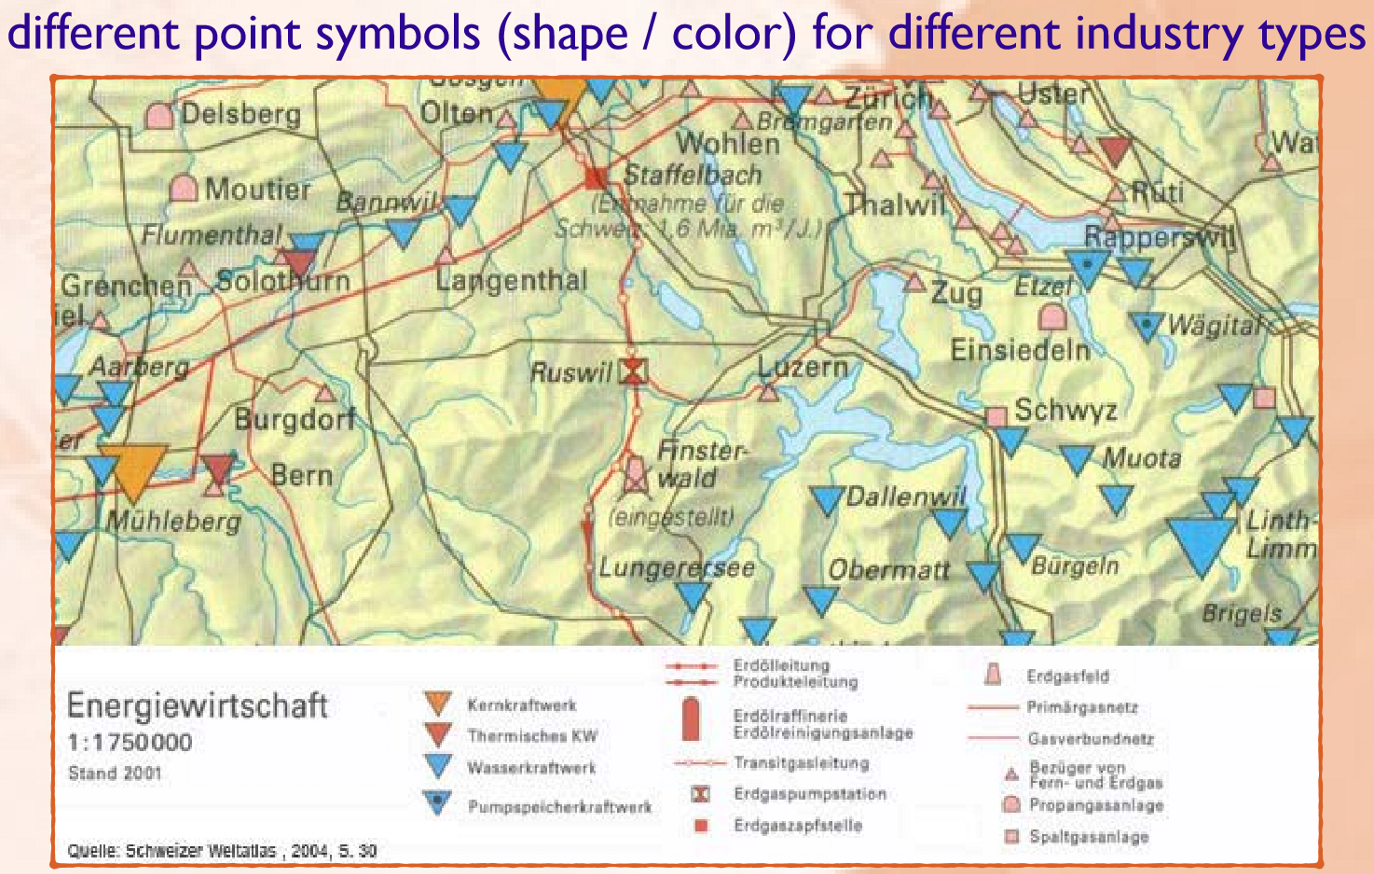
What visual variables (vv) can be used for point features?
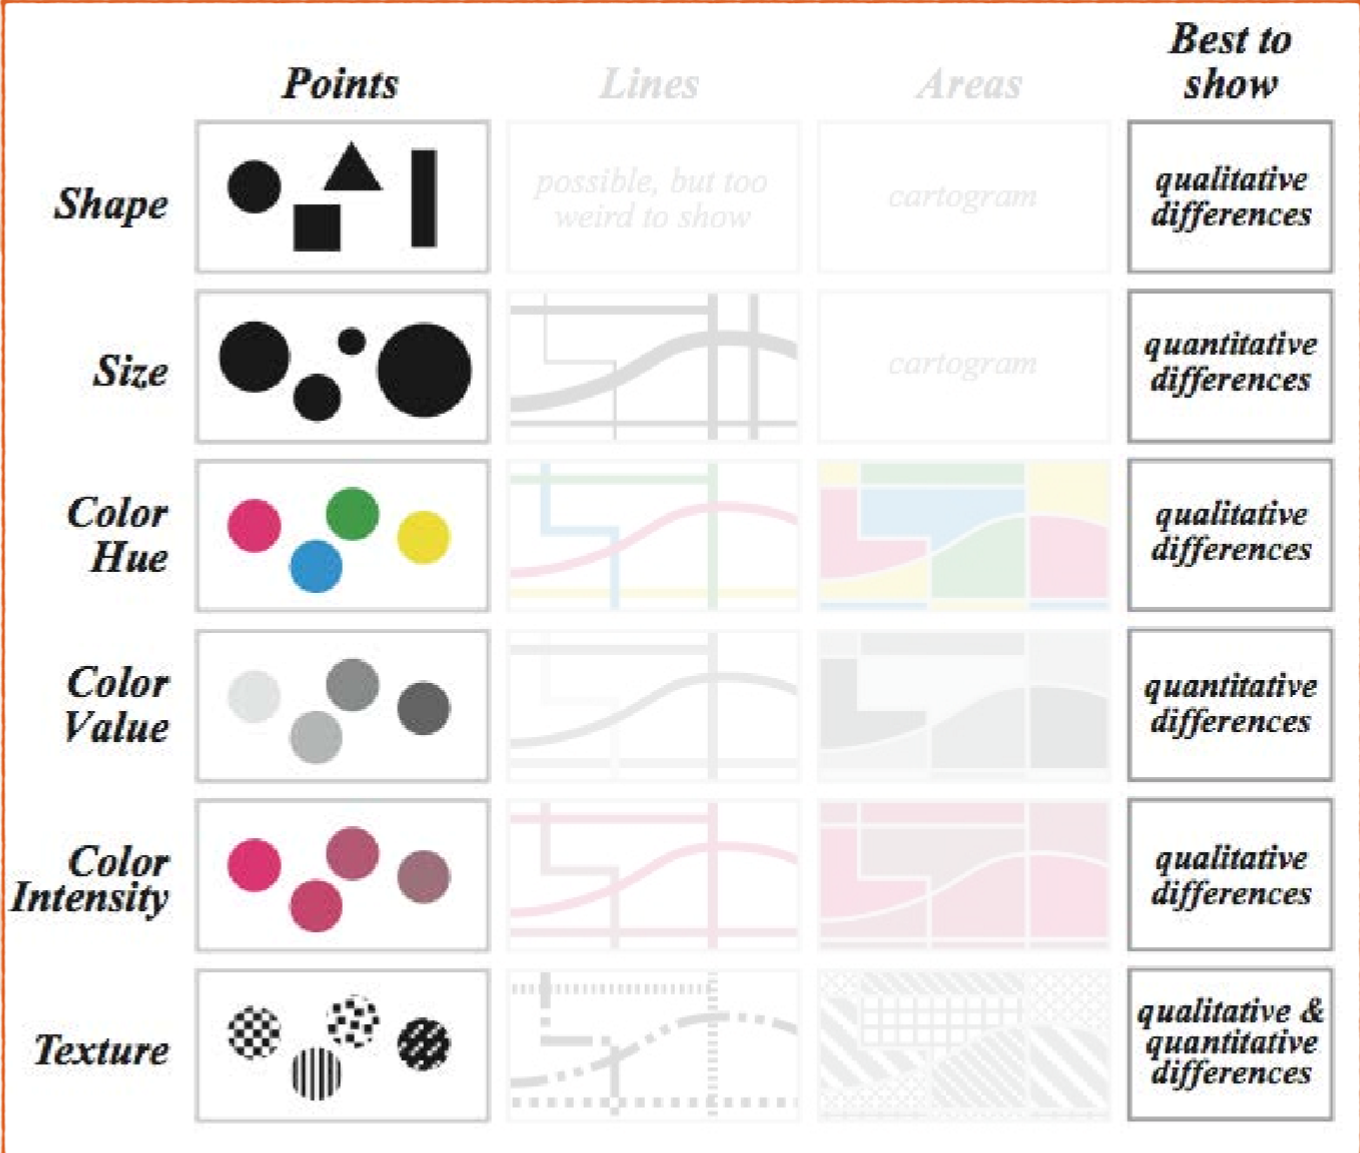
How do you map qualitative data as points?
What vv can be varied?
Examples?
Qualitative means feature qualites or categories
→ Vary visual variables:
colour hue
shape (geometric, mimetic)
orientation
texture
e.g. energy sources
How do you map quantitative data as points?
What vv can be varied?
Examples?
Quantitative means numbers, varying magnitudes
→ Vary visual variables:
size
colour hue / saturation
e.g. number of appartments, observed snow heights
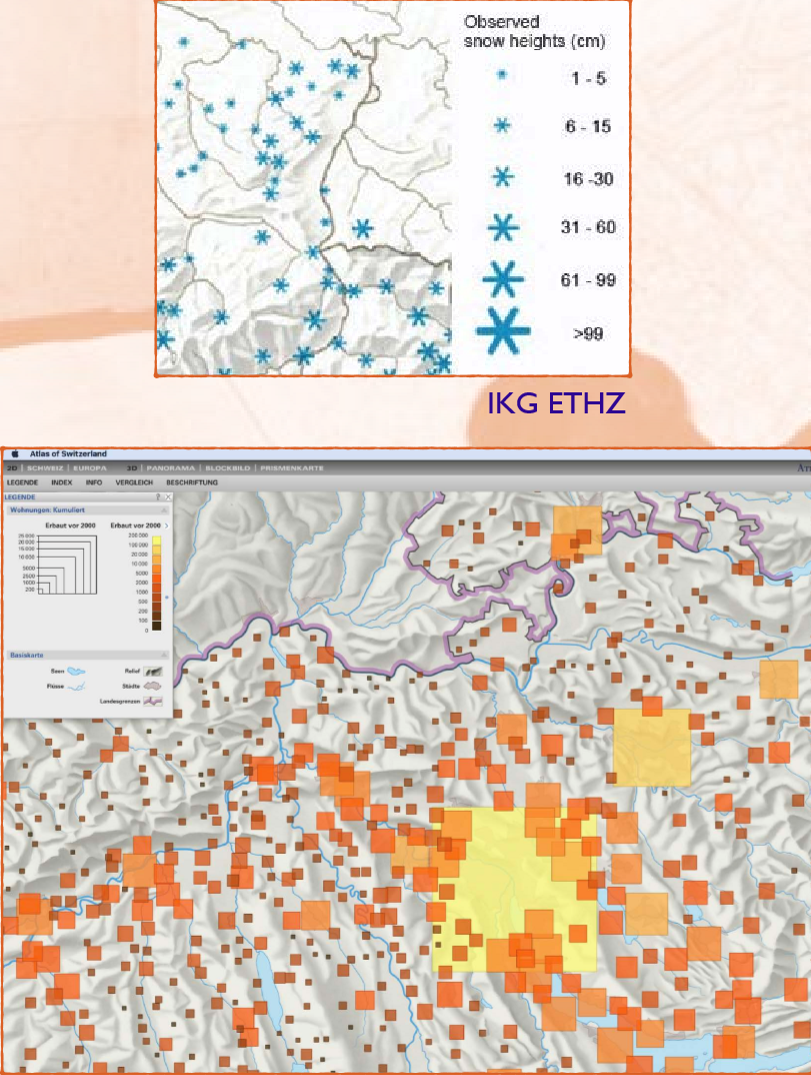
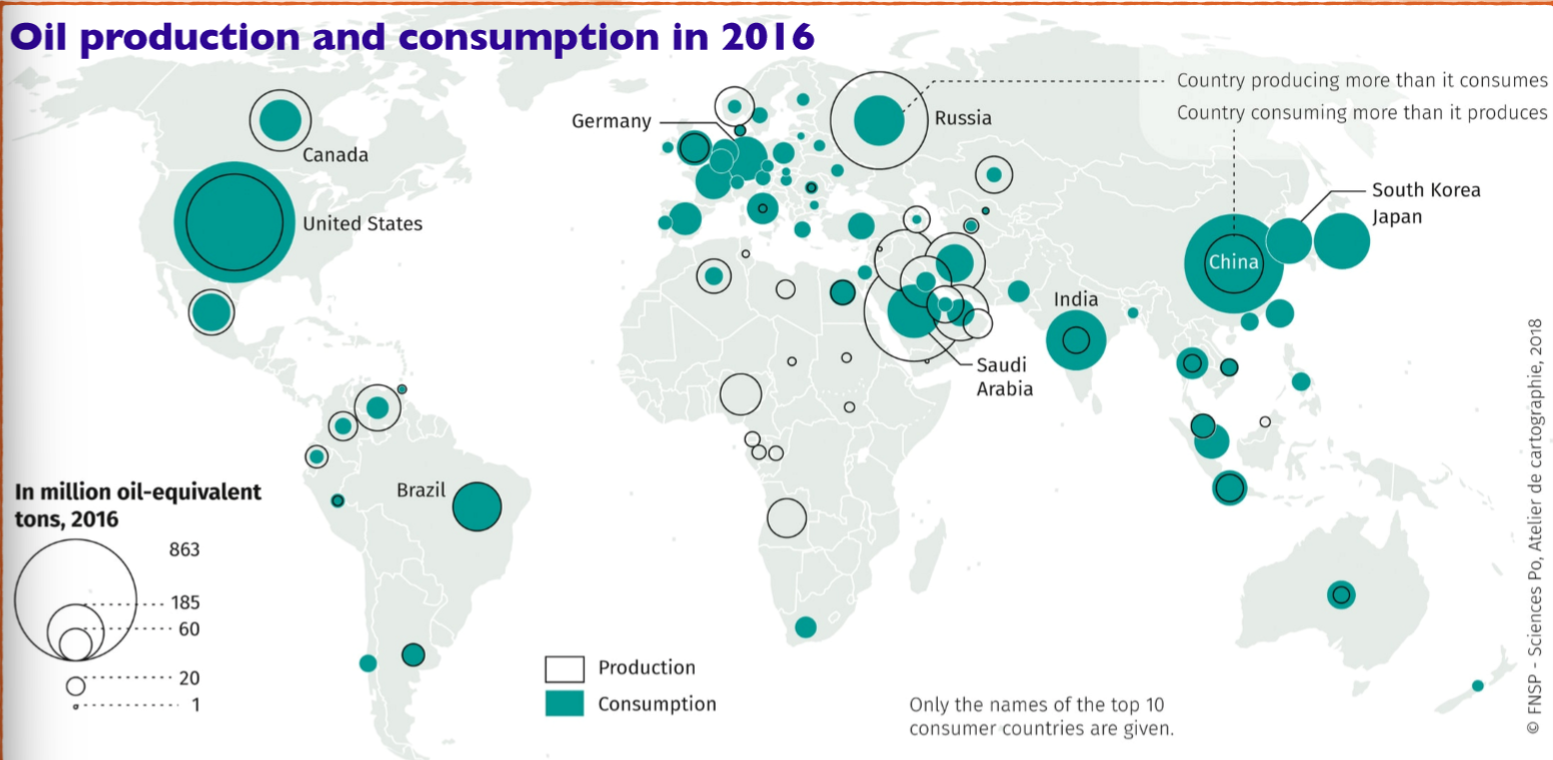
Proportional symbol maps
definition from glossary in book
lab example
a map in which point symbols are scaled in proportion to the magnitude of data occurring at point locations, such as circles of varying sizes representing city populations.
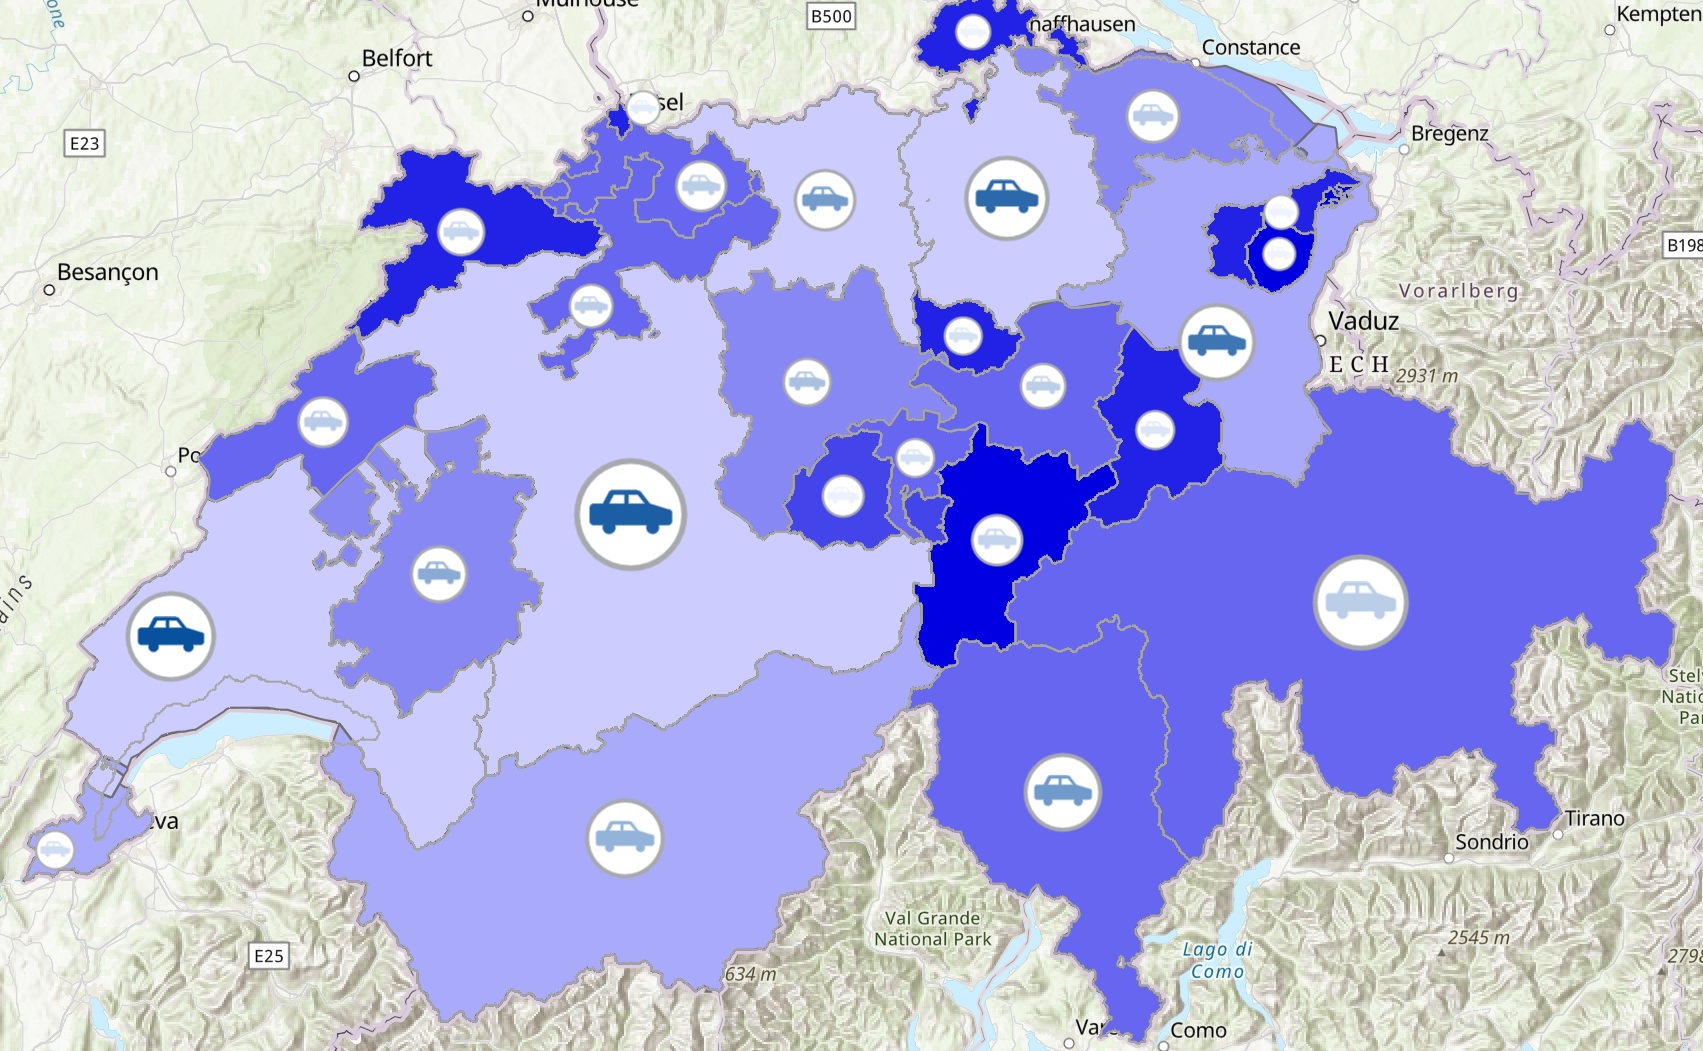
Graduated symbol maps
definition from glossary in book
example
a term used to describe a classed proportional symbol map.
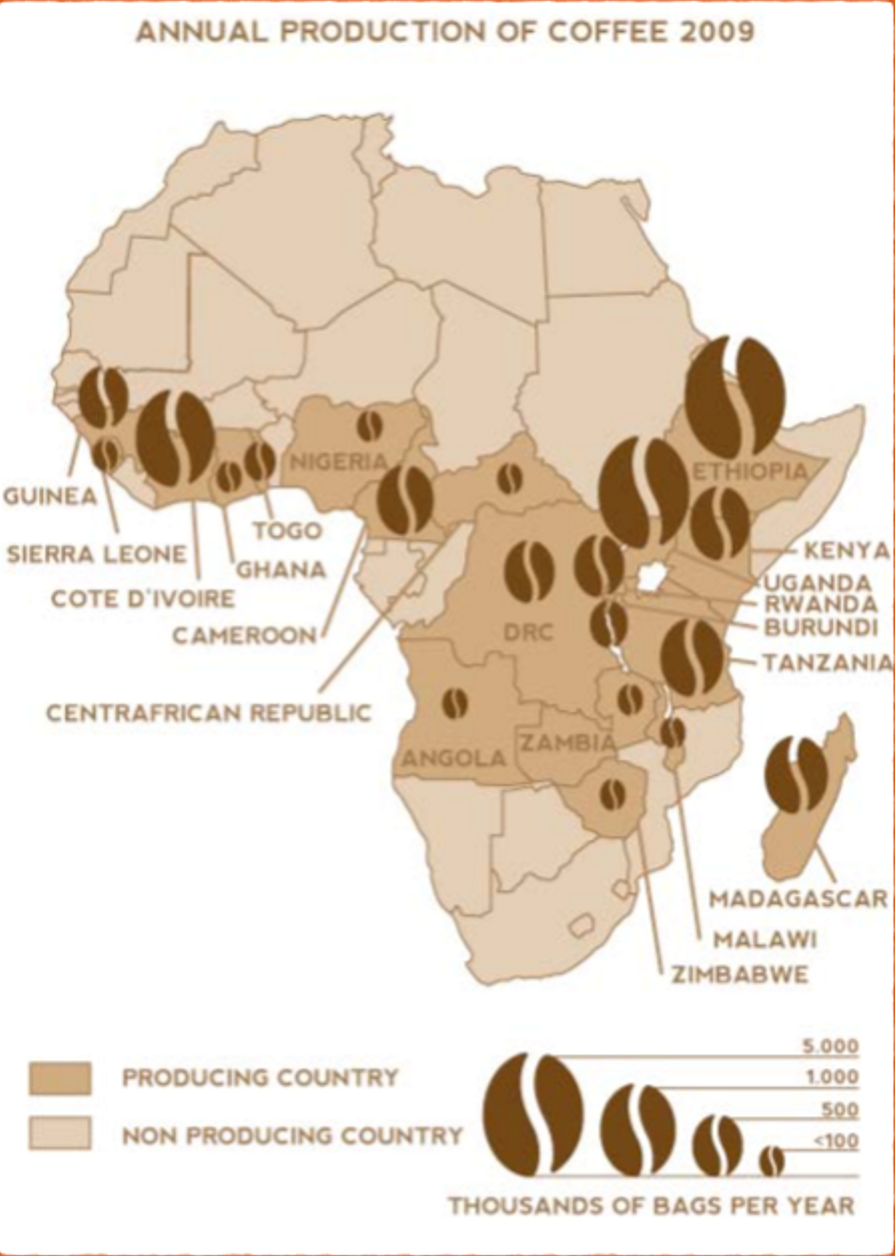
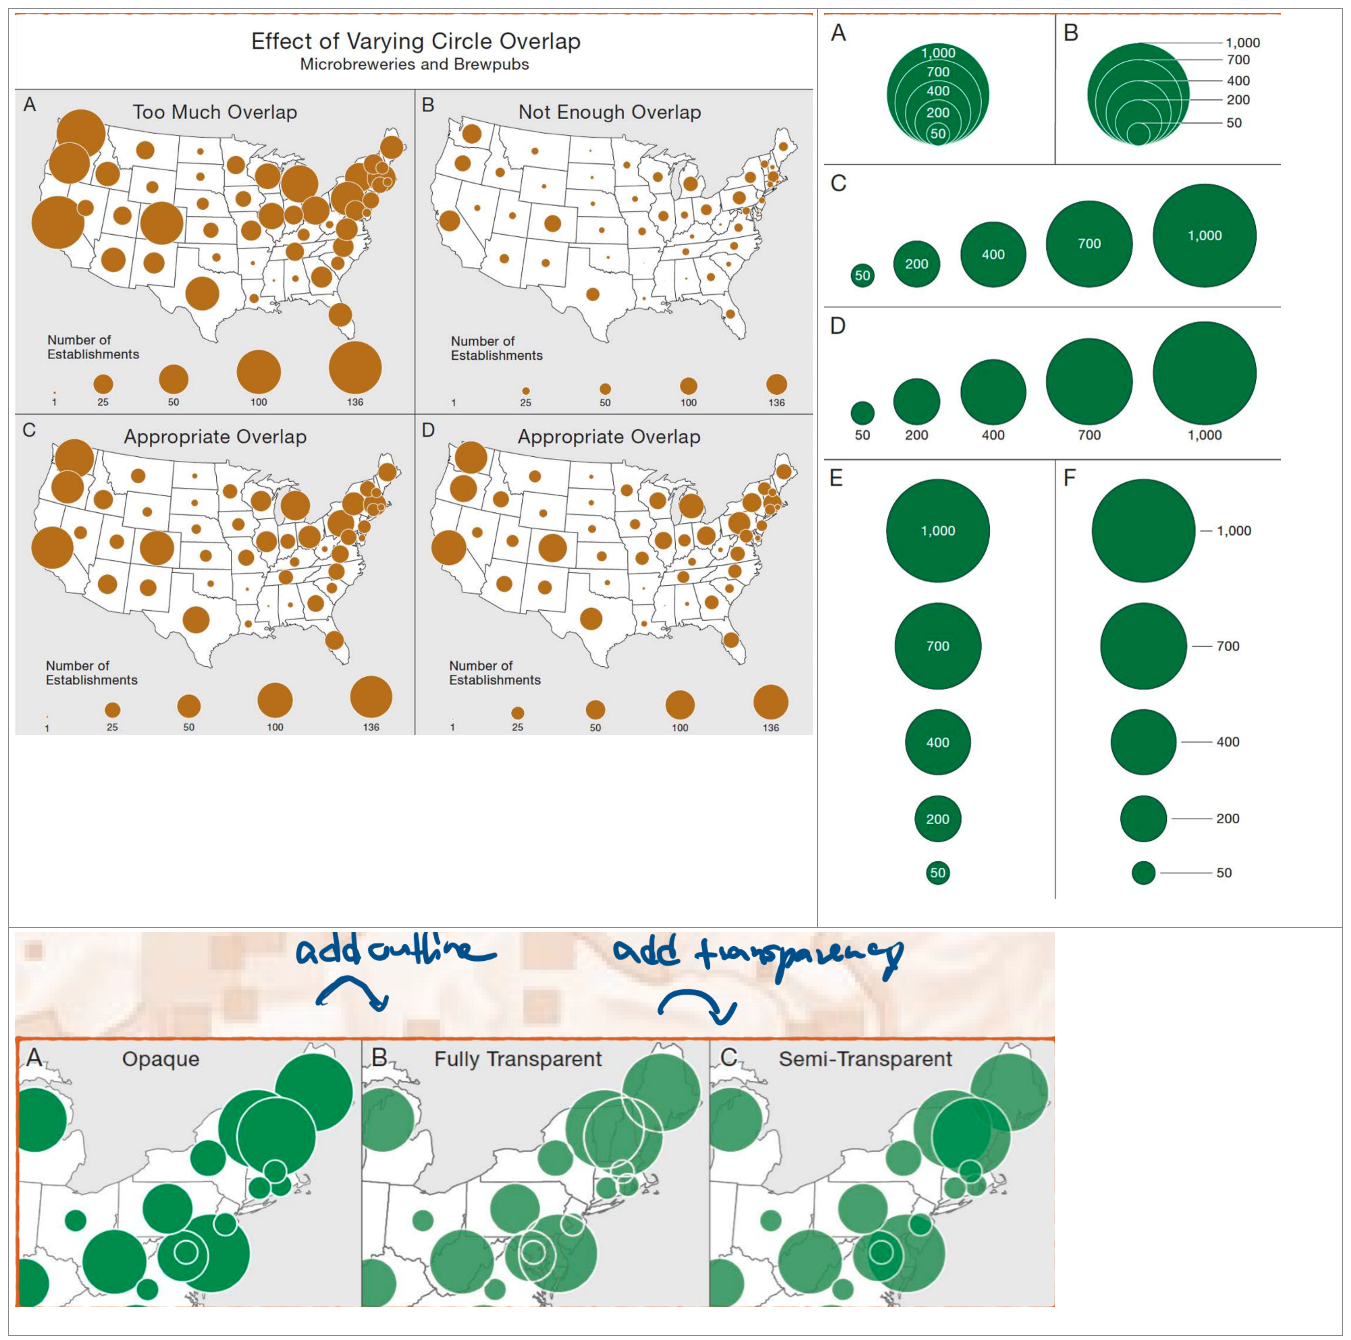
What are issues when designing graduated symbol maps?
figure-ground contrast (cut circles)
choice of min. / max. symbol size choice
overlapping symbols (add ouline and transparency)
legend types (circles horizontally, vertically, stacked inside of each other)
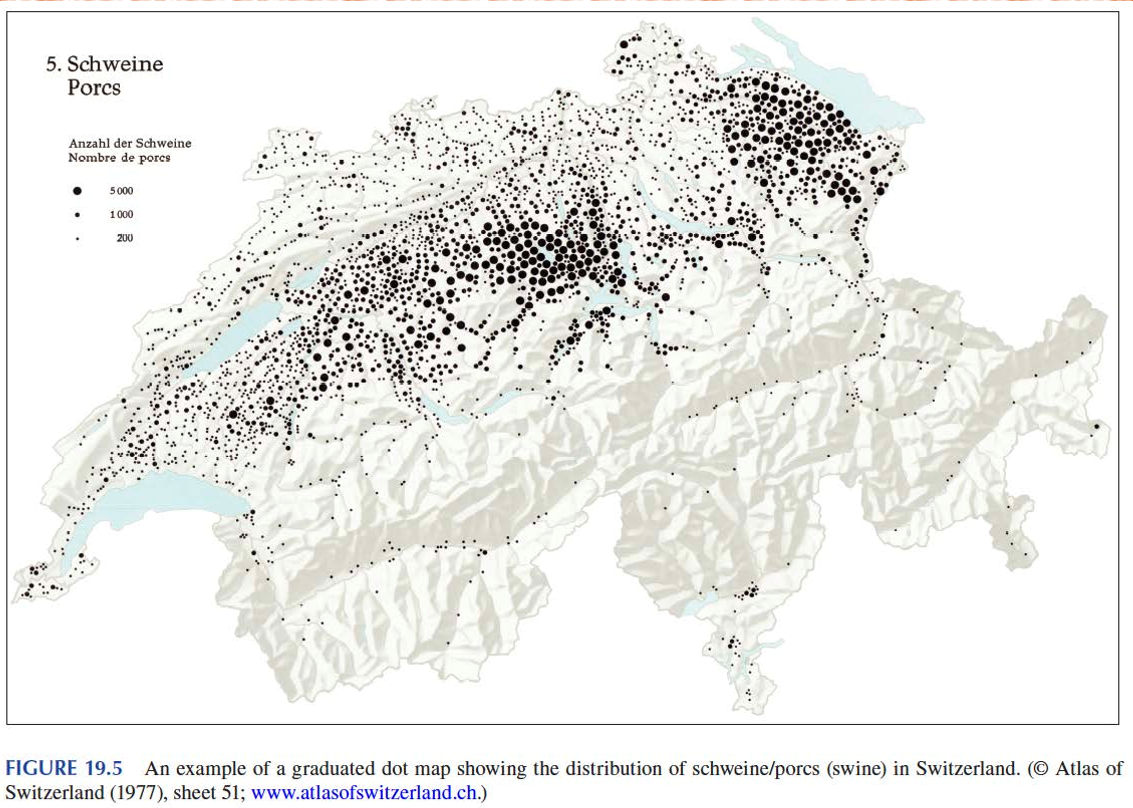
Dot density maps
definition
arrangement of number points with the same magnitude
small variation of size, colour, etc
a dot can represent 1 person or 3000 people
Dot density maps
Advantages
Disadvantages
Advantages
understandable
combine with other data
original data can be recovered
Disadvantages
dots are assigned randomly
original values can hardly be recovered
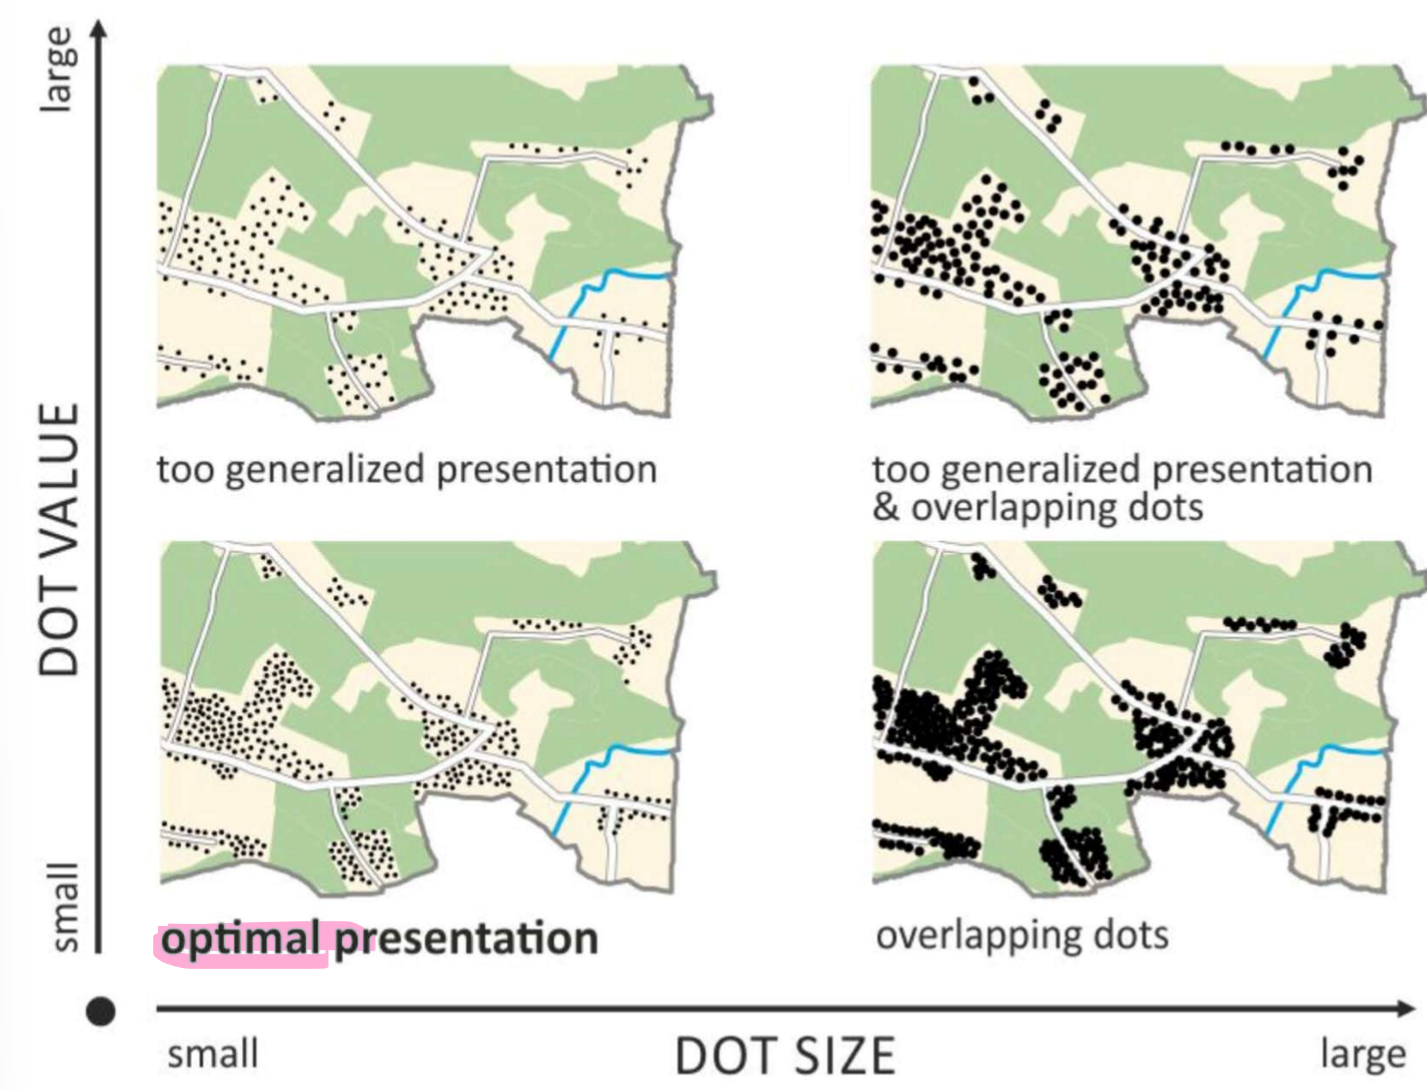
What are issues when designing dot density maps?
selection of number of dots
selection of dot values
dot size
map scale (not too detailed, not too general)
→ dots should touch
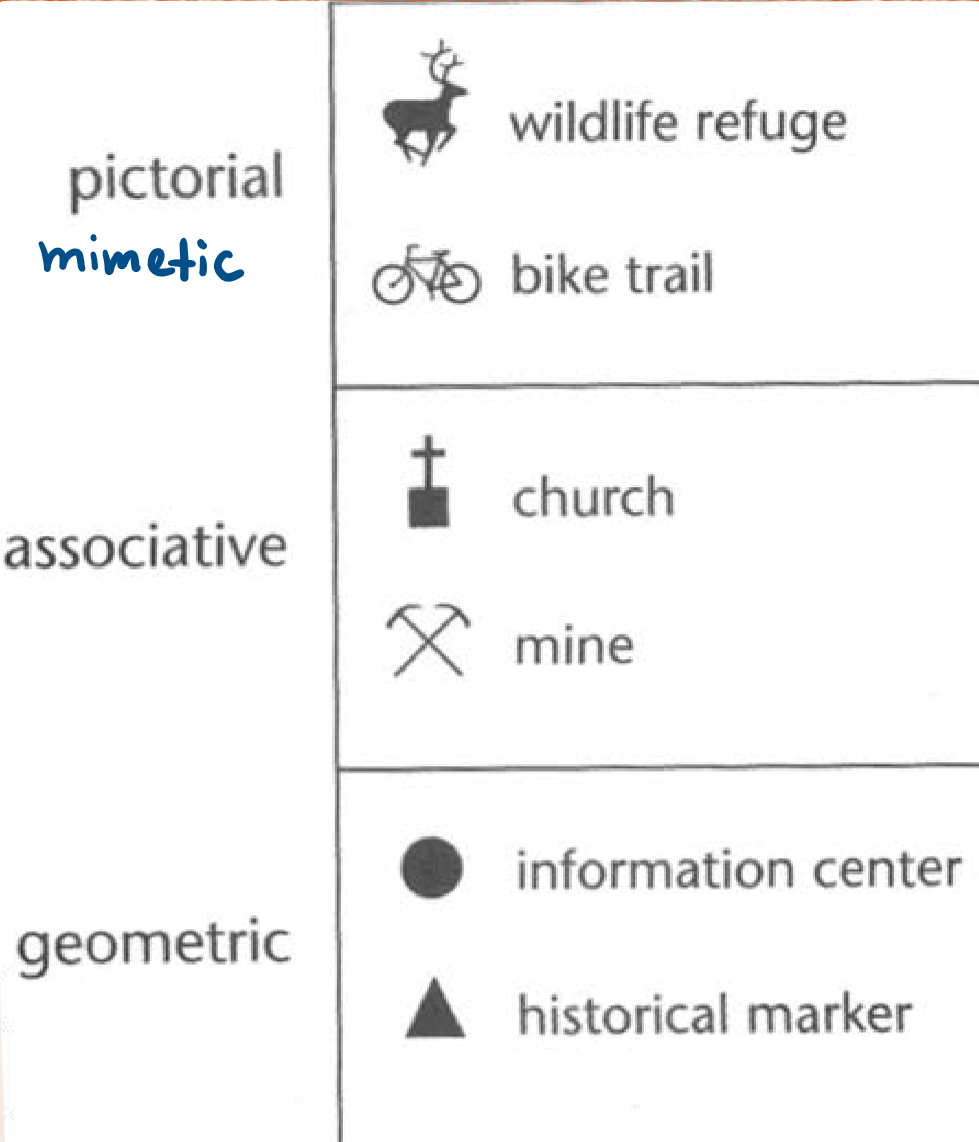
Point symbol types
mimetic, pictorial (graphic reduction)
associative (typical characteristics)
geomatric (abstraction, no relationship to represented feature)
Scaling:
Which visual dimension can be changed?
length
areas
volumes
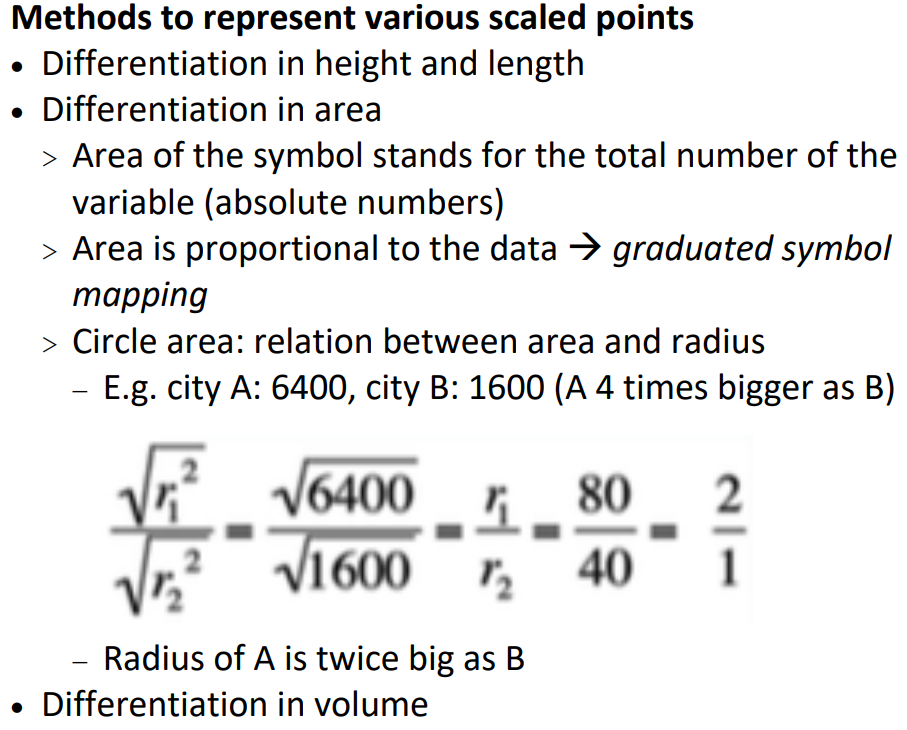
Scaling:
How are data values translated into those sizes?
Proportional/Not classed scaling
Range graded scaling
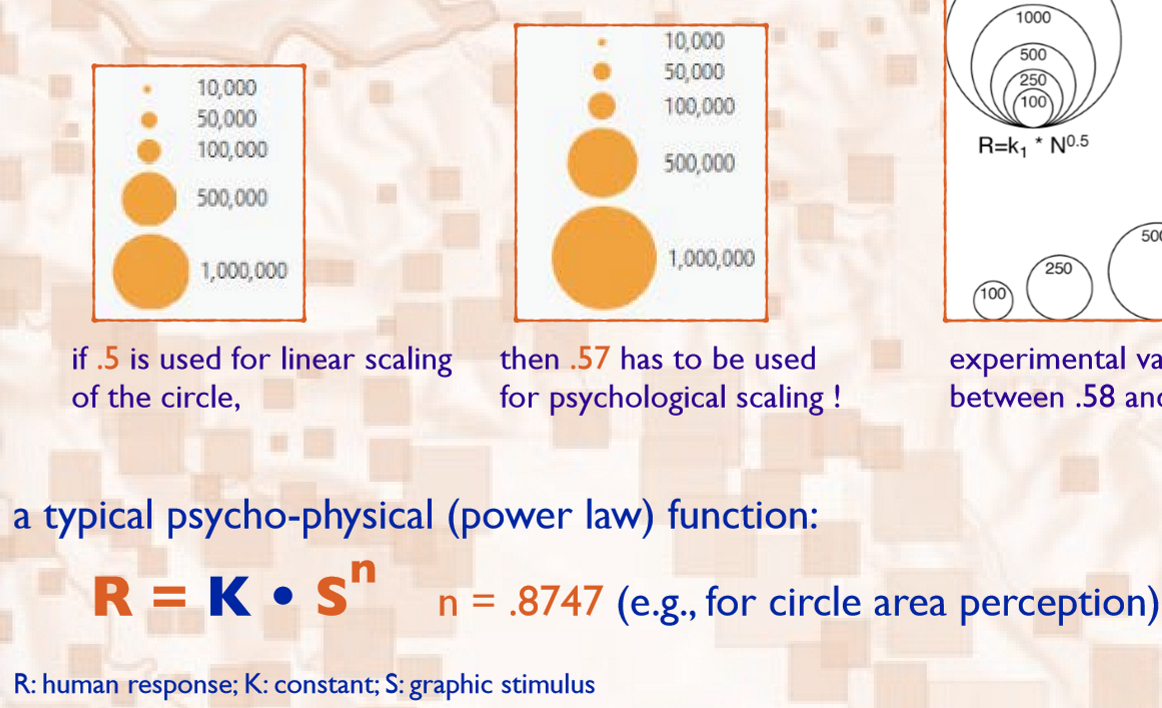
Psychophysical scaling
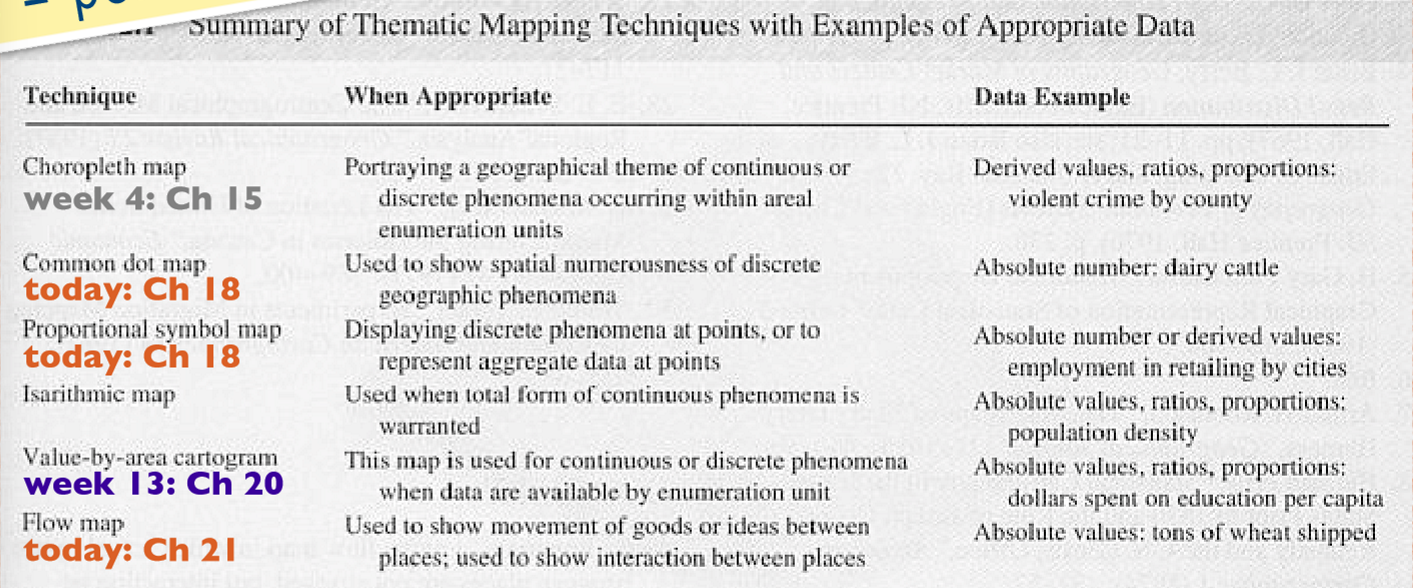
Summary: How do you create a good map (techniques learned so far)?
choose a mapping technique according to data properties and visual/perceptual properties
Techniques:
choropleth
dot density
proportional symbols
graduated symbols
flow map