Sea Level Change (almost finished)
1/16
There's no tags or description
Looks like no tags are added yet.
Name | Mastery | Learn | Test | Matching | Spaced | Call with Kai |
|---|
No analytics yet
Send a link to your students to track their progress
17 Terms
What are the drivers of sea level change
Thermal expansion of oceans and addition of meltwater from ice sheets and glaciers
How does thermal expansion cause sea level rise
The global oceans have absorbed around 90% of anthropogenic-driven warming (IPCC). This warming causes water to expand, leading to rising sea levels
How does addition of meltwater from ice sheets and glaciers affect sea level rise
Earth lost 28 trillion tonnes of ice between 1994 and 2017. This has increased the sea level by 34.6±3.1 mm
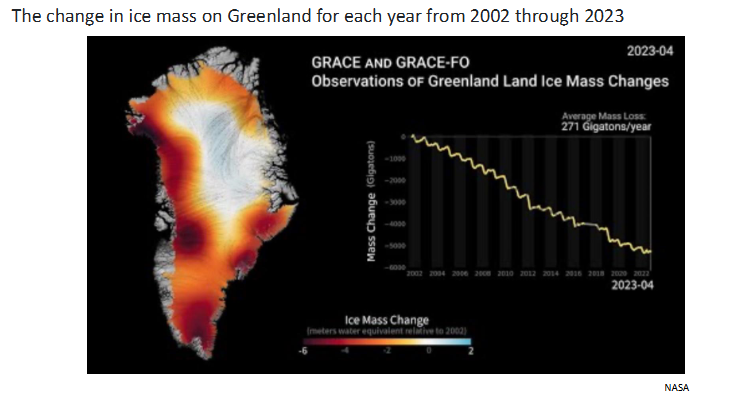
What is the change in ice mass on Greenland (2002-2023)
Graph shows decline in ice mass. In the last 20 years this warming has increased drastically. All freshwater tends to leave west of the island, but a lot leaves from the south as well.
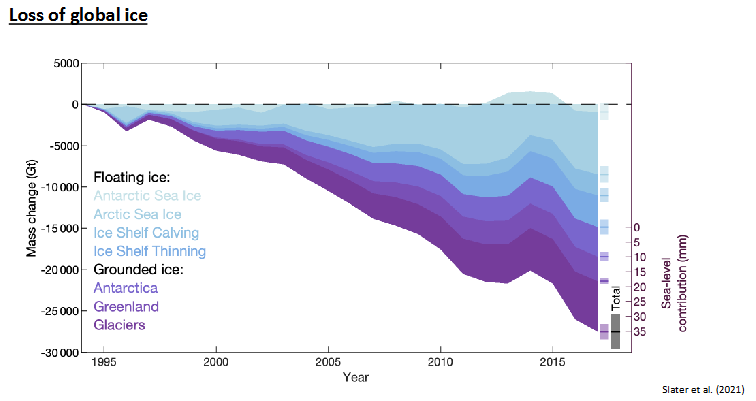
How is loss of global ice represented
Floating ice is sea ice and ice shelves (blues), and grounded ice (purples). Ground ice is contributing more to sea level rise. Between 2010 and 2015, the oceans were absorbing large amounts of air temperatures, rather than it contributing to ice melt, hence why there a quiet period.
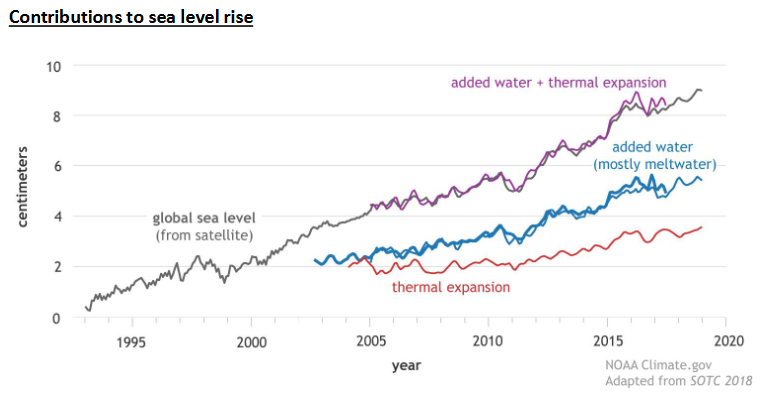
How is contributions to sea level rise represented
The combination of thermal expansion of water and melt water combined contribute to the most severe sea level rise
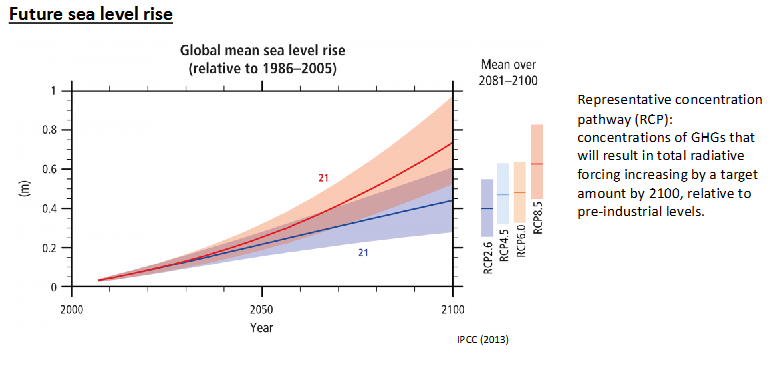
How is future sea level rise represented
Projections use concentration of greenhouse gasses
Lowest scenario=0.2-0.4m rise
Highest scenario=0.7-1m rise
How does sea level rise impact cities
Even a 50 cm rise in sea-levels can lead to:
• Major flooding during extreme weather events
• Damage to infrastructure (electrics, public transport, sewerage)
• Saline incursion into aquifers and soils
• Disruption to ports and other supply chains

How does sea level rise impact ecosystems
Many ecosystems and their services are highly vulnerable to SLR through soil salinisation, flooding and destruction of habitats:
• River Deltas
• Barrier Islands
• Coral Reefs
• Mangrove Forests
• Saltmarshes
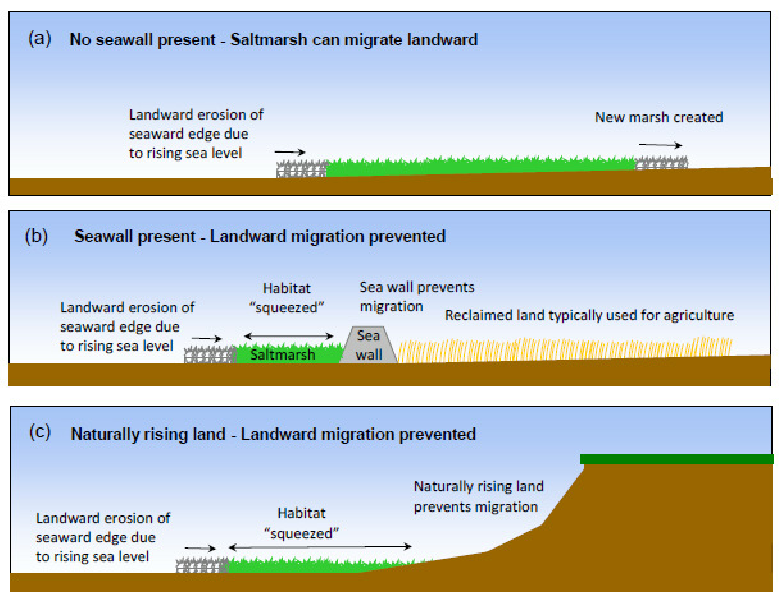
How can we help mangroves and saltmarshes survive
Managed retreat (see image)
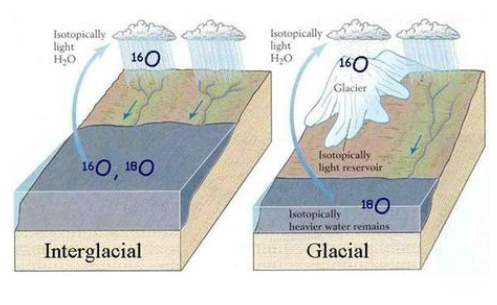
What is the ratio of δ16O and δ18O in sea water
Oxygen in sea water exists in three different, stable isotopic states: δ18O, δ17O and δ16O. Of these δ16O is by far the most common, followed by δ18O and finally δ17O . Because δ16O is isotopically lighter it is preferentially evaporated from the oceans. In cold stages δ16O becomes trapped in ice sheets, changing the ratio between δ16O and δ18O
What are foraminifera
Single-celled protists (very simple micro-organisms)
How do foraminifera use oxygen isotopes
They build shells from calcite in the water column that includes the ratio between δ16O and δ18O. When they die, they sink to the ocean bottom and are preserved in the sediments from millions of years. This process provides a record of changes between δ16O and δ18O, and therefore a record of global ice volume
What are isolation basins
Natural depressions that at different times are either connected to or isolated from the sea by changes in relative sea-level
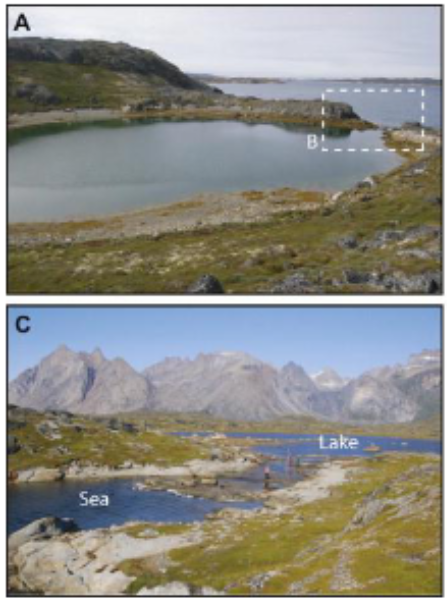
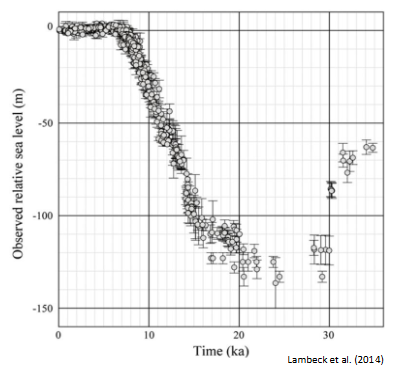
How can sediment cores map sea level changes
The SE coast of Norway can be used to map changes in sea level using sediment cores from their isolation basins. By dating coastal sediments and fossil coral reefs we can quantify sea level change. As we know the water depths coral species grow, we can measure the difference between that depth and their observed depth.
Together, these show that during the Last Glacial Maximum (around 20,000 years ago) global eustatic sea levels fell by around 120 meters. We can observe a rapid rise in sea level rise until around 8000 years ago (the final collapse of the North American ice sheets)
What is Doggerland
Lower sea levels exposed large areas of coastal shelf. These provided new environments for animals and Palaeolithic hunter communities. In Europe, much of the North Sea became terrestrial environments named Doggerland
What is Beringia
A sub-continent formed by lowered sea levels