AP Stat: Inferences about the Regression Model
1/20
There's no tags or description
Looks like no tags are added yet.
Name | Mastery | Learn | Test | Matching | Spaced | Call with Kai |
|---|
No analytics yet
Send a link to your students to track their progress
21 Terms
LRSL
computed from a sample of ordered pairs; estimates the true linear relationship between the variables
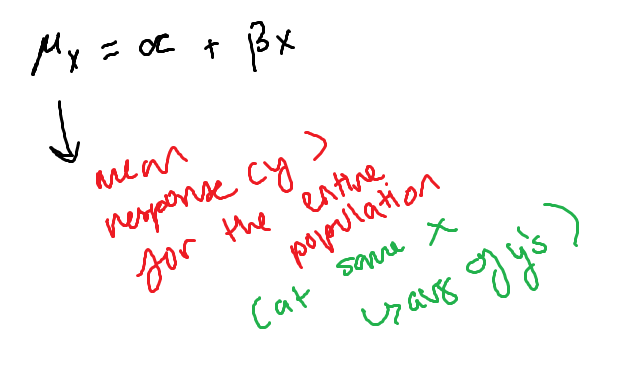
y = a + bx is equivalent to….
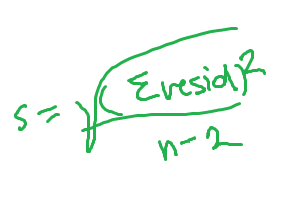
s (standard deviation of residuals/ standard error of the line)
s = how the y’s vary about the line OR estimates the typical difference in actual & predicted
s formula
interpretation of standard error of the line
The difference in actual and predicted (y values) using this model, vary with a standard deviation of (WHATEVER S EQUALS)
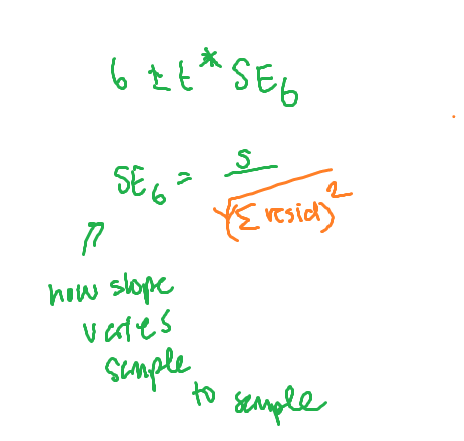
Formula for CI of the slope
Why do we use the t distribution for Confidence interval of the slope?
LRSL is about the “mean” of the y’s (making z score inappropriate as it discusses one samp/prop.)
data graph with x and y
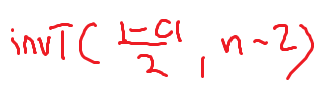
How to set up invT for confidence interval
How to interpret confidence intervals with LRSL
We can be (however many percents) confident that as acceptance rates (x) increases the graduation rates (y) decreases/increases by (CI interval)
OR
We can be (however many percents) confident that the true slope of the LRSL between x and y is between (CI interval)
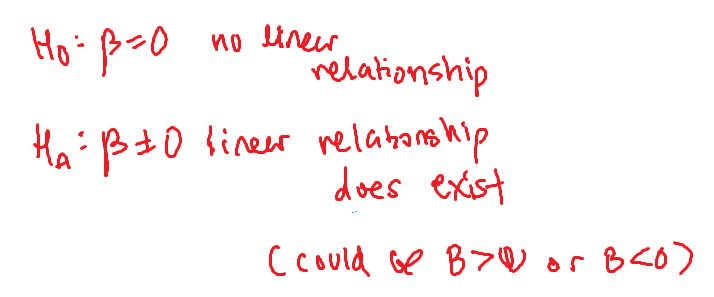
Hypothesis test: hypotheses
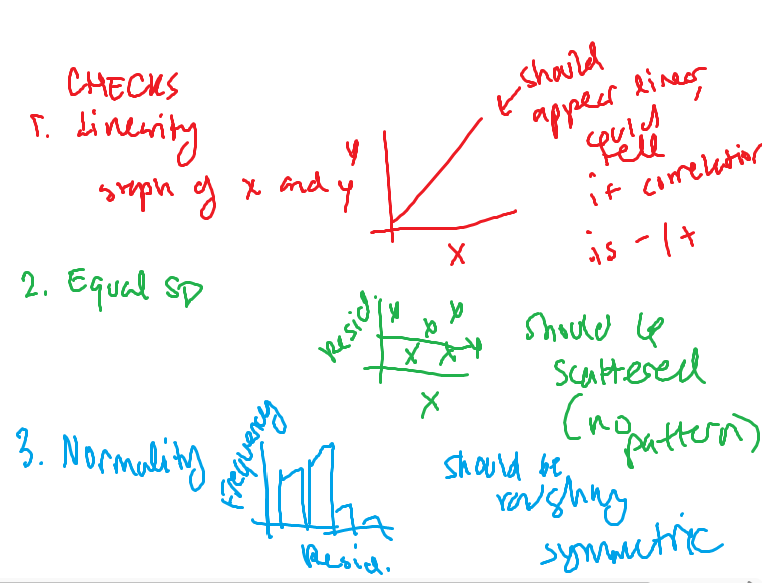
CHECKS AND ASSUMPTIONS
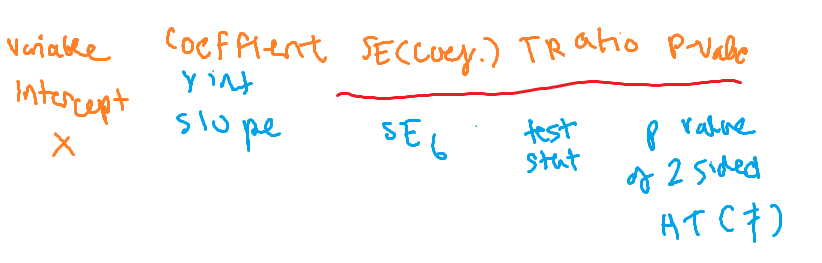
Test statistic for hypothesis test
b - 0/SEb (standard error of the slope) = t (MUST SOLVE FOR SEb WHEN GIVEN “data”; bot in table of stats the calculator outputs
OK to proceed w/
Linear regression t test
WHAT CALC FUNCTION AM I USING FOR HYPOTHESIS TEST?
LinRegTTest
Interpretation for hypothesis tests
Since the p value is (), we reject Ho at that level (can state level or don’t). There is/isn’t enough evidence to conclude there is a relationship between x and y.
For confidence intervals, to state interval, what variable do we use to state
B
parameter for hypothesis tests
the true slope of the regression line between x and y
Positive or linear relationship with B
B>0 positive linear relationship
B<0 negative linear relationship
(NO LONGER TWO SIDED)
What does SEb tell us?
telling us how reliably we can estimate the true slope
What is needed for hypothesis test vs. ci
HT = t stat and solving (b-0/SEb = t) AS WELL AS P and interpretation
CI = solving for confidence interval/interpretation