AQA A level Bio 4.5 Species and Taxonomy
1/28
Earn XP
Description and Tags
Name | Mastery | Learn | Test | Matching | Spaced | Call with Kai |
|---|
No analytics yet
Send a link to your students to track their progress
29 Terms
Courtship behaviour in the frog species, Xenopus laevis, involves male frogs
calling to:
• attract sexually active females – these are advertisement calls
• start and continue mating – these are mating calls
• signal when a male is not sexually active – these are rasping calls.
Scientists investigated frog courtship behaviour by feeding a population of
sexually active male frogs a diet containing the hormone EE2. The scientists also
fed a separate control population of sexually active male frogs a diet without
EE2.
They determined the percentage of males making advertisement calls or rasping
calls in each population
Suggest one change the scientists could make to both frog populations to
increase the number of mating calls. (1)
Add (sexually active) female(s) (1)
Courtship behaviour in the frog species, Xenopus laevis, involves male frogs
calling to:
• attract sexually active females – these are advertisement calls
• start and continue mating – these are mating calls
• signal when a male is not sexually active – these are rasping calls.
Scientists investigated frog courtship behaviour by feeding a population of
sexually active male frogs a diet containing the hormone EE2. The scientists also
fed a separate control population of sexually active male frogs a diet without
EE2.
Table 1
Population | Advertisement calls (%) | Rasping calls (%) |
|---|---|---|
Males fed EE2 | 94.0 | 4.0 |
Males not fed EE2 (control) | 97.0 | 0.5 |
The scientists also investigated the effect on female frog courtship
behaviour of feeding EE2 to male frogs.
Table 2 shows their results.
Population | Median time females spent in courtship (s) |
|---|---|
Males fed EE2 | 8 |
Males not fed EE2 (control) | 16 |
EE2 is contained in human contraceptive pills. Some EE2 is released in
human urine and collects in sewage. Untreated sewage pollutes the water
in frog habitats.
Suggest and explain the effect EE2 pollution in frog habitats will have on
frog breeding.
Use information from Table 1 and Table 2 in your answer. (4)
(Effect on breeding)
Less mating/breeding (1)
(Explanation)
Fewer advertisement calls, so females not attracted (1)
Fewer mating calls as males less (sexually) active (1)
More rasping calls as (more) males not (sexually) active (1)
The classification system used in the early 20th century grouped different species of bacteria according to the position and shape of flagella on bacterial cells and by the number of flagella per cell. These were observed using an optical microscope. Each species of bacterium has a characteristic cell shape and arrangement of flagella. These characteristics may be shared with other species within a genus. Flagella are fragile, difficult to stain and may extend from the cell at any angle.
Consider the accuracy and limitations of the early classification of bacteria using the arrangement of flagella (3)
Can not identify species (1)
Not all bacterial have flagella (1)
Flagella (are fragile so) broken/damaged (1)
Suggest why several bacterial species have been renamed in recent years. (1)
Amino acid sequencing (1)
Describe how organisms are grouped in a phylogenetic classification system. (2)
Hierarchy (of groups) with no overlaps (1)
(Grouped) according to evolutionary origins/relationships/history (1)
Scientists investigated a phylogenetic relationship between individuals of five
species of rhinoceros.
The scientists:
• determined the DNA base sequence of the cyt b gene of each rhinoceros
• compared each cyt b DNA base sequence with that of one Indian
rhinoceros (called the reference rhinoceros)
• calculated the percentage difference between each cyt b DNA base
sequence and that of the reference rhinoceros.
Investigated species of rhinoceros | Percentage difference in DNA base sequences compared with the reference Indian rhinoceros |
|---|---|
Indian | 2 |
Javan | 5 |
Sumatran | 13 |
White | 14 |
Black | 14 |
What can you conclude about the likely phylogenetic relationships between these species? Evaluate your conclusion. (4)
(Genetic) variation/difference (exists) between Indian rhinos (1)
Indian rhinos more related to Javan rhinos (1)
Comparisons only made to one Indian rhino (1)
(same) percentage differences may not refer to same base sequences (1)
A scientist obtained a rhinoceros horn confiscated from poachers and
wanted to identify the species of rhinoceros that was killed for its horn.
He used the procedure described in part (d) and calculated the difference
in cyt b DNA as 14%.
Investigated species of rhinoceros | Percentage difference in DNA base sequences compared with the reference Indian rhinoceros |
|---|---|
Indian | 2 |
Javan | 5 |
Sumatran | 13 |
White | 14 |
Black | 14 |
What can you conclude from this result? Explain your answer.
Suggest a change to the procedure that will more precisely identify the
rhinoceros species that provided the horn. (2)
(Likely) either White or Black (rhinoceros) as identical/same/14 percentage (1)
Use a different reference (species of) rhinoceros OR compare (DNA) base sequence (1)
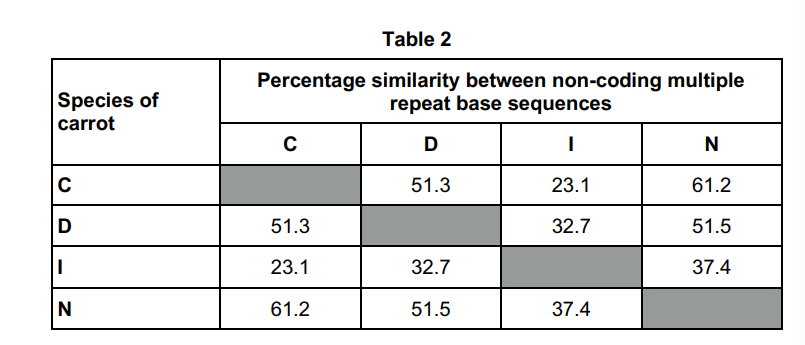
The percentage similarities in the non-coding multiple repeats of base sequences of four species of carrot are shown in Table 2.
The scientists studied five individuals from each species. Within the five individuals of species N they found a percentage similarity of 66%. Use Table 2 to evaluate how this information affects the validity of the phylogenetic tree (2)
(Supported) more similar than with any other species (1)
(Not supported) high (intraspecific) variation in species N (compared with variation between N and C) (1)

Figure 2 shows the recordings of the songs of three flies over the same time period.
D. erecta and D. willistoni are closely related species but different species. Describe evidence from Figure 2 that supports this statement(2)
Sine song is (very) similar / same length (for both, so closely related) (1)
(But) have different peaks / pulses (in pulse song) (1)
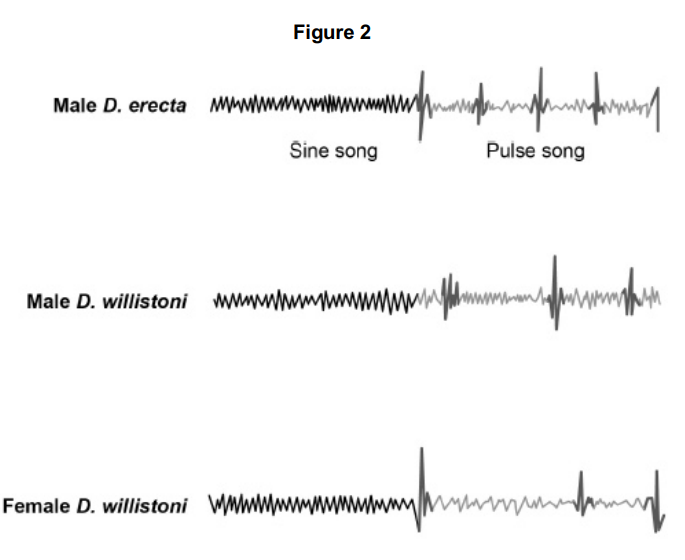
The scientists repeated their experiments, using female fruit flies as the visual stimulus. When a male and female D. willistoni were together, their songs led to mating.
When two female D. willistoni were together, their songs did not lead to any attempt to mate.
Use information from Figure 2 to suggest why the two females did not attempt to mate. (2)
(Three) peaks (in pulse song) occur at the same time (since both female) / songs identical (1)
(Therefore) no male (song) to stimulate / cause mating (1)
The St. Kilda field mouse lives only on one island off the coast of Scotland. It is very similar in appearance to the long-tailed field mouse but is larger and has lighter coloured fur.
Biologists wanted to find out if the St. Kilda field mouse and the long-tailed field mouse populations belonged to different species. They measured the length of the same features of a large number of individuals from the two populations.
The results are shown in Table 2.
Population | Mean Head and Body Length (±SD) / mm | Mean Tail Length (±SD) / mm |
St. Kilda field mouse | 112.3 (±9.3) | 105.5 (±8.4) |
Long-tailed field mouse | 95.2 (±8.2) | 90.2 (±7.3) |
Do the data in Table 2 provide evidence that the two populations belong to different species? Use calculations of ratios to support your answer. (3)
(No) SDs of means of body sizes / sizes of parts of bodies overlap (1)
Calculation of correct head and body: tail ratios (1)
Almost identical, so same body shape / proportions (1)
Explain what is meant by a species (2)
Able to reproduce (1)
to produce fertile offspring (1)
Organisms can be classified using a hierarchy. Explain what is meant by a hierarchy (2)
Smaller groups within bigger groups (1)
with no overlap (1)
The variety of colours displayed by catfish is important in courtship. Give two ways in which courtship increases the probability of successful mating (2)
Can recognise members of the same species via certain behaviour, preveneting interbreeding (2)
Explain what is meant by a phylogenetic group (1)
Grouped according to evolutionary links/common ancestor (1)
Explain what is meant when two species are described as closely related (1)
They share a more recent ancestor (1)
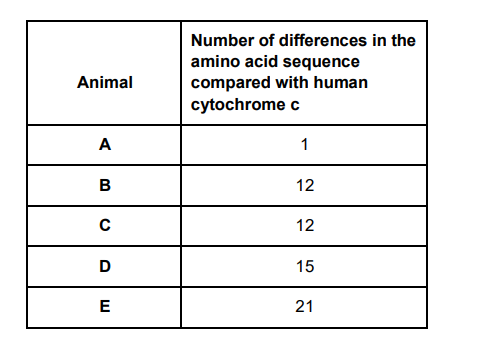
Cytochrome c is a protein involved in respiration. Scientists determined the amino acid sequence of human cytochrome c. They then:
• determined the amino acid sequences in cytochrome c from five other animals
• compared these amino acid sequences with that of human cytochrome c
• recorded the number of differences in the amino acid sequence compared with human cytochrome c
Explain how these results shown on the table suggest that animal A is the most closely related to humans. (2)
similar amino acid sequence (1)
(so) similar DNA sequence (1)

Cytochrome c is a protein involved in respiration. Scientists determined the amino acid sequence of human cytochrome c. They then:
• determined the amino acid sequences in cytochrome c from five other animals
• compared these amino acid sequences with that of human cytochrome c
• recorded the number of differences in the amino acid sequence compared with human cytochrome c
A student who looked at these results concluded that animals B and C are more closely related to each other than to any of the other animals. Suggest one reason why this might not be a valid conclusion. (1)
Differences may be at different positions / different amino acids affected / does not show where the differences are (in the sequence) (1)
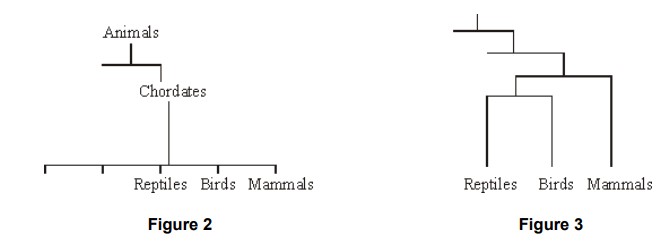
The diagrams show two systems of classification of mammals. Figure 2 shows a simple hierarchy. Figure 3 shows a phylogenetic system
By reference to Figures 2 and 3, explain how a phylogenetic system differs from a simple hierarchy. (3)
(phylogenetic) based on evolutionary history (1)
shows ancestry of groups (1)
(hierarchical) based on shared characteristics (seen today) (1)
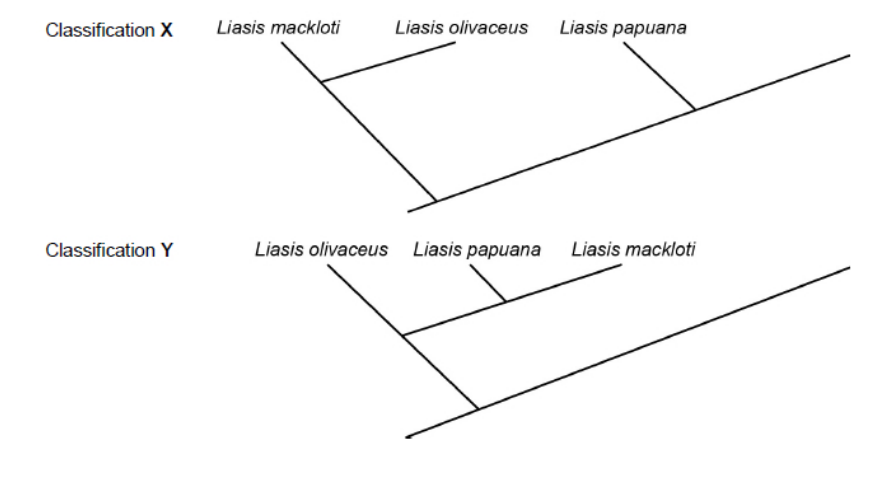
The diagram shows two different ways of classifying the same three species of snake.
• Classification X is based on the frequency of observable characteristics
• Classification Y is based on other comparisons of genetic characteristics.
All three species of snake belong to the Python family.
What do these classifications suggest about the evolutionary relationships between these species of snake? (2)
(Classification X) - (without genetic analysis) mackloti and oliraceus have a more recent common ancestor with each other)
(Classification Y) - papuana and mackloti have a more recent common ancestor with one another (than with olivaceus);

The diagram shows two different ways of classifying the same three species of snake.
• Classification X is based on the frequency of observable characteristics
• Classification Y is based on other comparisons of genetic characteristics.
All three species of snake belong to the Python family.
State three comparisons of genetic diversity that the scientists used in order to generate Classification Y. (3)
the base sequence of DNA (1)
the base sequence of mRNA (1)
the amino acid sequence (of proteins) (1)
Explain the principles which biologists use to classify organisms into groups (3)
Large groups are divided into smaller groups (1)
Members of a group have features in common based on anatomy (1)
reflects evolutionary history (1)
Scientists investigated the effect of hunting on the genetic diversity of otters. Otters are animals that were killed in very large numbers for their fur in the past. The scientists obtained DNA from otters alive today and otters that were alive before hunting started. For each sample of DNA, they recorded the number of base pairs in alleles of the same gene. Mutations change the numbers of base pairs over time.
The scientists obtained DNA from otters that were alive before hunting started.
Suggest one source of this DNA. (1)
Bone / skin / preserved remains / museums (1)
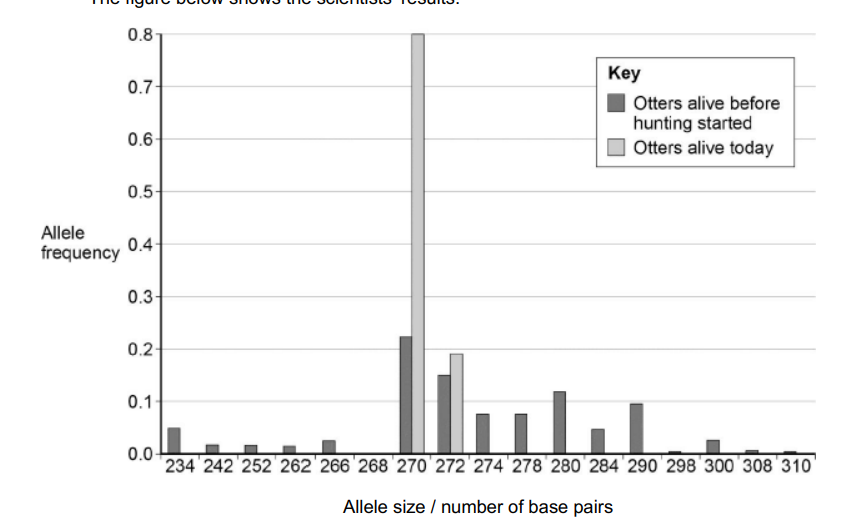
Scientists investigated the effect of hunting on the genetic diversity of otters. Otters are animals that were killed in very large numbers for their fur in the past. The scientists obtained DNA from otters alive today and otters that were alive before hunting started. For each sample of DNA, they recorded the number of base pairs in alleles of the same gene. Mutations change the numbers of base pairs over time.
What can you conclude about the effect of hunting on genetic diversity in otters? Use data from the figure above to support your answer. (2)
(Hunting) reduced population size(s), so (much) only few alleles left (1)
Otters today from one / few surviving population(s) (1)
Some populations of animals that have never been hunted show very low levels of genetic diversity. Other than hunting, suggest two reasons why populations might show very low levels of genetic diversity (2)
Population might have started with small number of individuals (1)
Interbreeding (1)
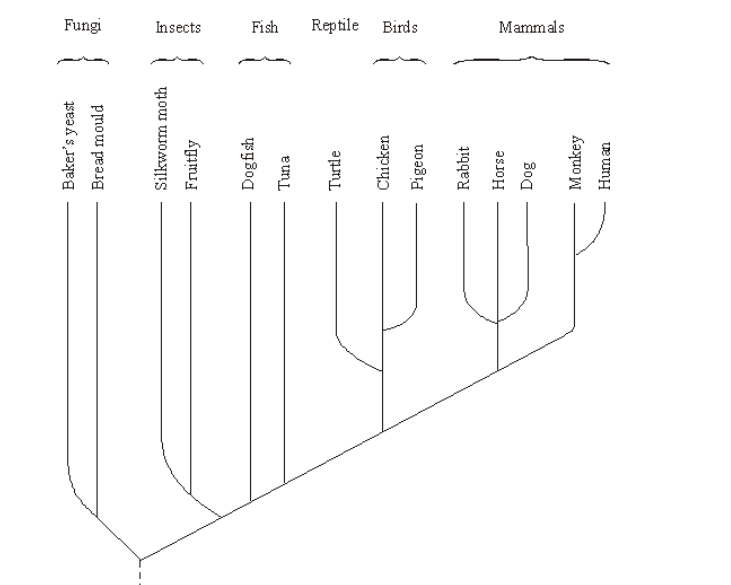
Cytochrome c is a protein with about 100 amino acids and is present in all eukaryotic organisms. It has the same three-dimensional shape in all species, but only 30 of the amino acids are the same in all species. The amino acid sequence of cytochrome c has been used to construct the phylogenetic tree shown below
What does the phylogenetic tree show about the evolutionary relationship between fungi and insects? (2)
(insects and fungi) have common ancestor (1)
they diverged a long time ago (1)
Suggest how information on amino acid sequences is used to construct a phylogenetic tree (2)
those with similar sequences put in same groups / are more closely related (1)
the greater difference in amino acid sequence the longer ago the groups diverged (1)
Cytochrome c is a protein with about 100 amino acids and is present in all eukaryotic organisms. It has the same three-dimensional shape in all species, but only 30 of the amino acids are the same in all species. The amino acid sequence of cytochrome c has been used to construct the phylogenetic tree shown below
Suggest one advantage and one disadvantage of using cytochrome c to construct a phylogenetic tree (2)
A - present in all (eukaryotic) species or organisms / quantifiable (1)
D - extinct species not considered (1)
Haemoglobins are chemically similar molecules found box in many different species. Differences in the primary structure of haemoglobin molecules can provide evidence of phylogenetic (evolutionary) relationships between species. Explain how. (5)
Mutations change base/ nucleotide (sequence) (1)
(causing) change in amino acid sequence (1)
Mutations build up over time (1)
More mutations (in amino acid sequence) between distantly related species (1)
Distantly related species have earlier common ancestor (1)