Lecture 8: Designing a water quality monitoring program (incl. QA and QC)
1/37
There's no tags or description
Looks like no tags are added yet.
Name | Mastery | Learn | Test | Matching | Spaced | Call with Kai |
|---|
No analytics yet
Send a link to your students to track their progress
38 Terms
Why monitor water quality?
Without monitoring it is difficult to find the source of water quality issues. Water monitoring information is also used to guide improvements or prevent further degradation.
Monitoring programs
All monitoring programs are different because they reflect the environment and issues being faced.
Rationale for monitoring
Research
test hypothesis (experiment resulted in a significant change)
Regulatory compliance or enforcement
chemical industrial plant does not exceed specified emission
effluent characterisation/ reporting
Response to an event
identify specific issues (of significance)
identify what and who is responsible (forensic)
Routine monitoring
spatial and temporal trends
Managing a waterbody
can involve any of the above
Knowns and unknowns
Known knowns (e.g. contaminants that are measured)
Known unknowns (e.g. contaminant known to be used but are not monitored)
Unknown unknowns (e.g. contaminants we are not aware of and therefore can not or do not monitor for)
Non-targeted analysis
Uses advanced analytical instruments such as
high performance liquid chromatogram
mass spectrometer
mass spectrometer (HPLC-MSMS)
quadrupole time of flight mass spectrometer (QTOF)
Any organic chemical can be detected (based on mass of fragments) then you need to identify the chemical from libraries and quantify them
The objective is to identify chemicals present
Can also use non-targeted to survey chemicals not already analysed and determine if they should be added to suite of targeted chemicals
Limitation of non-targeted analysis
Without standard the chemical can only be identified and semi-quantified '
you can still determine if the concentration is increasing over time
Concentration of chemicals can only be determined if a standard is available and a concentration response relationship (calibration curve) has been developed
if you know the peak area and have a calibration curve you can determine the conc
Framework for monitoring program design
Regular review (3 to 5 years) to recommend improvements
is the program still fit for the purpose?
has the situation changed?
could additional stressors or objective be included?
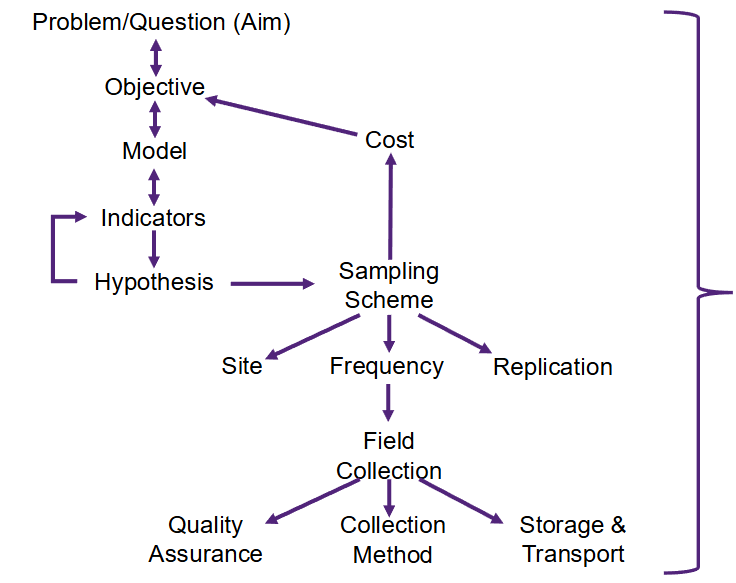
Considerations in a sampling program
Objectives
baseline monitoring?
trend detection?
search for hotspot?
margin of error allowable?
Variability
spatial variation
temporal variation
Cost factors
sampling cost
analytical costs
fixed vs. minimum cost
Nontechnical factors
sampling convenience
accessibility
availability of resource
regulations
Underlying principle of water sampling
Samples must be representative
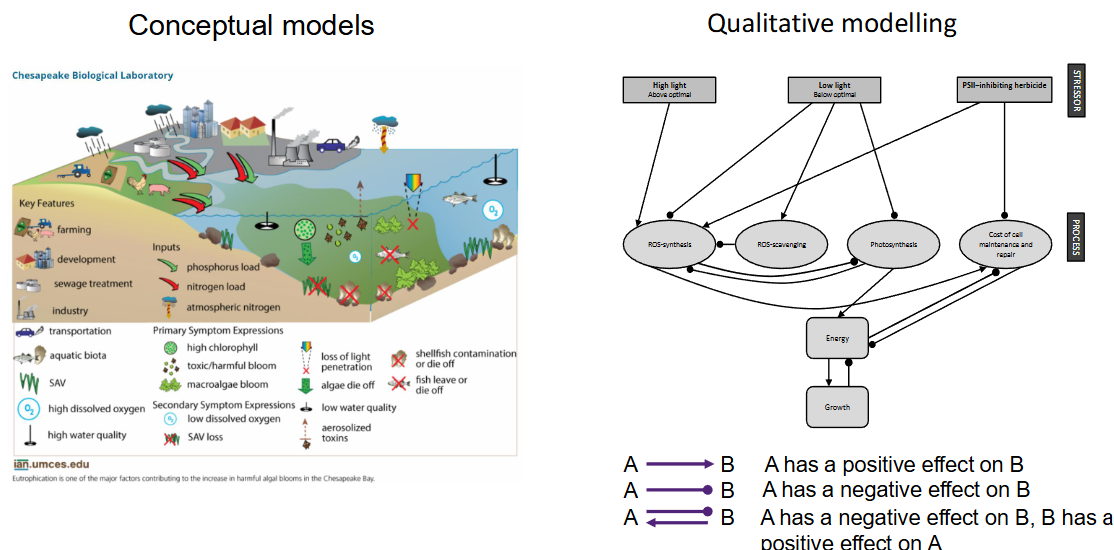
Developing a conceptual model
A conceptual model (diagram or figures) of the area to be monitored includes:
known stressors
transport pathways
organisms that may be affected and how
They express ideas about components and processes deemed important in a system, document assumption about how they are related and identify knowledge gaps
Examples of conceptual models
Conceptual models
Qualitative models
Site selection
A site monitors water passing through that point
water is a combination of water from all land and land uses upstream of site
Thus, site selection must reflect:
questions to be answered, objectives and hypothesis to be tested
processes that reflect water quality
natural and man-made features
an area where water is well-mixed and representative (i.e. not stratified, still or slow moving)
good logistics (i.e. accessibility, susceptibility to flooding, availability of electricity)
Environmental Protection (Water and wetland biodiversity) Policy 2019
The purpose of this policy is to achieve the objective of the Environmental Protection Act in relation to waters and wetlands by:
identifying EVs for waters and wetlands
identifying management goals for waters
stating WQGs and objectives to enhance or protect the environmental values
providing a framework for making consistent, equitable and informed decisions about waters
monitoring and reporting on the condition of waters
Quality Assurance and Quality Control (QAQC)
QAQC is essential to the success of a monitoring program. If the data is not accurate then wrong conclusions, decisions and investments may be made.
Pros and cons of grab samples
Pros
can collect many samples
can monitor temporal and spatial changes of contaminant concentrations
cheaper per sample
manual grabs have high labour costs but low capital and maintenance costs
automated grabs have high capital and maintenance costs but low labour costs
Cons
measure the conc at a point in time (could miss contaminants)
Pros and cons of passive samplers
Pros
measure average aqueous conc during deployment
conc chemicals from water — can detect more chemicals at lower aqueous concentrations
Cons
cannot monitor short-term temporal variation of contaminant concentrations
more expensive per sample
a lost sampler means no data for the deployment period (e.g. one month)
Real-time monitoring with probes
Measure pH, dissolved oxygen, temperature, conductivity, turbidity, nitrogen and phosphorus, discharge (direction and velocity of flow), pesticides (not yet), toxicity (possible but complicated)
The sampling frequency can be selected from secs to weeks (this reduces sampling labour)
Need to develop relationships between real-time and
traditional measurements, potential role of real-time
measurement to provide estimates of traditional measures
Spatial considerations
Avoid sampling where the following occur:
riffles
backwaters
confluences (200 m downstream on major rivers)
Stratification occurs in little a 2 m
Tidal mixing zones (fresh over salt)
High-low temperature
Stagnant waters (lakes and dams)
Plume buoyancy (density/temperature issue)
Always collect samples from control sites
Temporal considerations
Tidal fluctuations
always collect sample on outgoing (ebb) tide
river mouth to upstream, otherwise you might be following the water downstream (i.e. collecting the same water)
Releases
e.g. on an ebb tide as for some STP discharges
historical monitoring points
EHP/ other agencies
Papers/reports/universities
Facility under investigation
Diurnal changes
e.g. DO
Identifying background sources of contamination
E. coli and enterococci are used to indicate contamination from human faeces but could be the result of birds, wildlife and livestock
differentiate using DNA test
Nutrients (ammonia, nitrogen and phosphates) can be introduced from farms, gardens, constructure activities
Be aware of stratified water bodies
bottom layers may have anoxic conditions which release bioavailable nutrients from sediments
Total Petroleum Hydrocarbons (TPH) and zinc introduced from roads
this is why it is important to take control samples
Quality Assurance (QA)
Preventing quality issues through written processes and implementation of these processes, training, audits and what tools are used. A proactive approach includes root-cause analysis to investigate errors so that we can modify processes to ensure it is not repeated (e.g. staff training programs, calibration processes, written procedures and record keeping).
This also includes a quality control program.
Quality Control (QC)
The focus is on testability, checking and testing results (e.g. making sure there is no contamination in field gear, that laboratories are producing good quality results, that sampling processes are fit for purpose, sampling coverage is adequate to address quality needs).
Precision vs. accuracy
Precision and accuracy are two ways to think about error
accuracy — how close a measurement is to an accepted value/tolerance
precision — how close measurements of the same item are to each other
Note that precision is independent of accuracy
Sampling plan
Select the correct analytes, understand holding times, preservation etc.
consider correct type and number of sampling containers and analysis
adhere to correct holding times and preservation
consider lab quality control requirements and accredited labs/tests
prepare field filtration required (ammonia, dissolved metals, DOC)
do samples need to be filled to ‘zero headspace’?
consider storage and transport methods
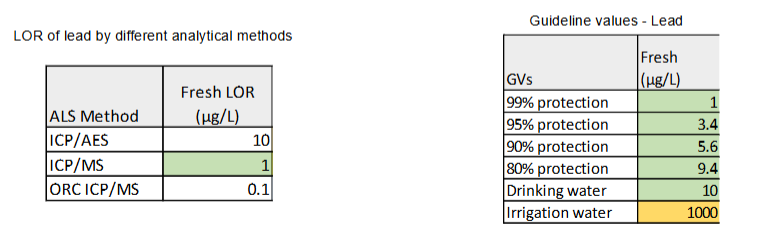
Consider Limits of Reporting (LOR) or Practical Quantification Limits (PQL)
Obtain a representative sample/s of a water body
Account for variability
temporal and spatial variation
understand background influences
Collection evidence
Limits of Reporting (LOR) or Practical Quantification Limits (PQL)
Limits of Reporting (LOR) are the lowest concentration that the laboratory can quantify a chemical with certainty. The LOR of the laboratory should be below the guideline value for the analytes of interest.
Replicates to assess variability
Water bodies are not homogenous temporarily or spatially but typically heterogeneous
Three replicates across a stream at different depths (minimum)
good approach if sampling requires high defensibility or variability needs to be assessed
In situ readings can indicate if a waterbody is well mixed vertically
Sample ID
Unique ID should include:
date
location description
sample number
Always ensure that:
samples names are not too long
naming system is consistent and suitable
use waterproof marker and write label before taking sample (avoid sharpie PFAS)
Types of QC blanks
Container blank
used to quantify and trace contamination problems associated with the sample containers and preservation
Trip or transport blanks
contamination due to shipping and laboratory sources;
usually for Volatile Organic Carbons (VOCs) analysis and when using ice.
Equipment blanks
contamination due to intermediate sampling tools (bucket, bailer etc.)
Field blanks
contamination due to field conditions, filtration, transport and container
*only ultra-pure water provided by the analysing laboratory should be used for blanks
Multiparameter Water Quality Meter
Always be calibrated pre and post sampling (i.e. dissolved oxygen, electrical conductivity, pH) particularly for investigations:
calibrate the meter for expected EC range (freshwater/brackish/marine)
EC varies with temp; hence data are corrected to 25°C (specific conductance)
check instrument to see if it corrects EC
Keep moving probe if membrane – needs flow), luminescent
Meters should be occasionally cross-checked using another meter
Record calibration details (defence may request records) in a meter logbook with:
maintenance
repair
calibration
Ensure suitable supplies of standard calibration solutions are maintained and shelf-life is monitored
Filtering
Ensure syringes/filters are new and appropriate for analysis
cellulose acetate filters are used for metals
polyethersulfonone (PES) for nutrients
use 0.45 micron for dissolved ammonia/metals
do not use glass fibre pre-filters for metals
use filters that have been sealed
check expiry dates
perform blank checks
Equipment preparation
Prepare sample bottles (group for ease of use)
Have documents, record keeping logbooks ready:
appropriate Chain-of-Custody documentation
appropriate check lists and contemporaneous notes
Have ice-bricks and/or ice ready, dry ice if freezing samples
eskies on standby
YSI meters correctly maintained, calibrated and working
calibration solutions should be present if away overnight
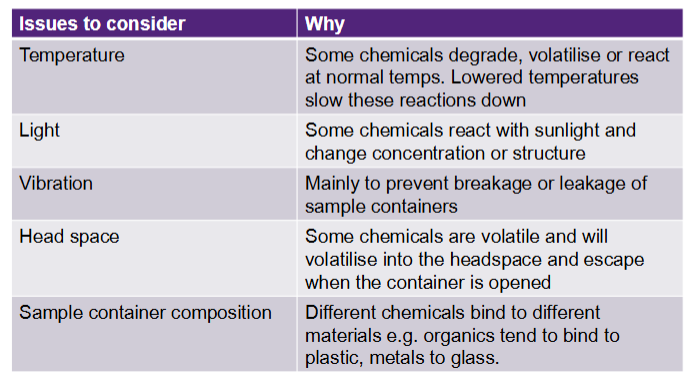
Sample bottle information
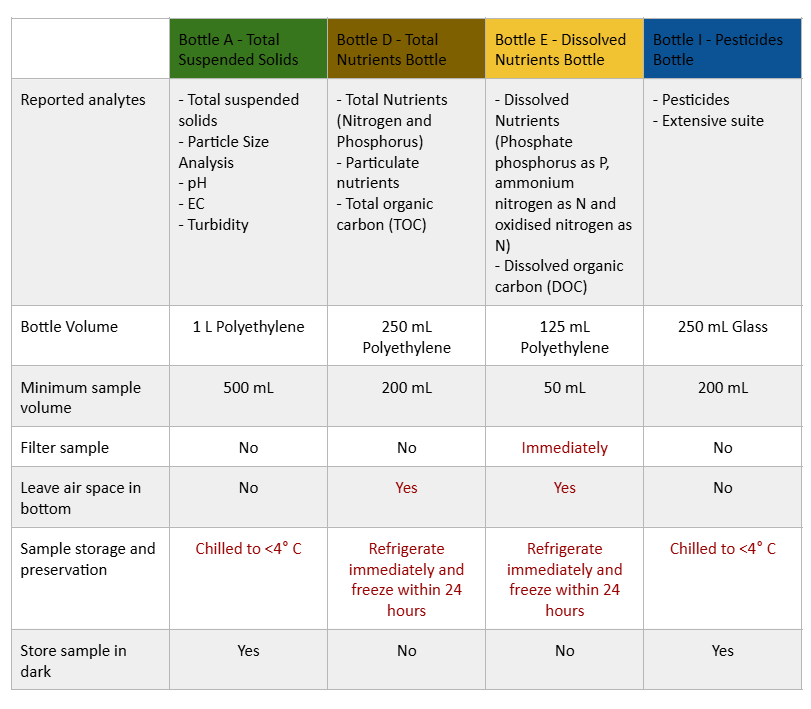
Container, storage and transport
Observations
Important to capture as much detail on both incident location and waterway as possible
Officers should take GPS waypoints of each sample site
Photos
Videos
Records of general observation (contemporaneous notes):
water colour and clarity
odours
water flow, velocity/direction
weather conditions
surface scum
algal/plant growths
dead or dying fish
proximity to earthworks, construction, agricultural, industrial or water treatment activities, weirs '
maps or drawings
In situ measurements
In situ measurements should be taken at all sample locations first
gives an indication of stratification
Turbidity should be measured in situ
probe should be 0.3 m below surface, but use middle of water column for very shallow waters, the 1 m intervals in fresh, 2 m in estuaries
readings should be taken as close to middle of channel as possible
probe should be kept in gentle motion whilst the meter stabilises
record mg/L and % for dissolved oxygen
pH (holding time 6 hours) and turbidity/conductivity (holding times 24 hours) can be done in lab but in situ preferred
Chain of Custody (COC)
A legal term used to describe the ability to guarantee the identity and
integrity of the sample from field sampling through to receipt at the lab. A process used to preserve and document the chronological history of a sample from person-to-person because test results are regularly used as evidence in legal proceedings (disprove tampering or unintentional misconduct). Breaks in COC discredit data.
Checking data
Data should be checked ASAP after receiving results
check original field sheets vs lab report (time, date, location, site IDs)
Sign off QC’ed data once passed
Check blanks for contamination
field blank (FBLK) concentration values should be equal to or less than two times the corresponding Practical Quantitation Limit (PQL) values
trip blank (TBLK) concentration values should be equal to or less than two times the corresponding PQL values
Relative Percent Difference (RPD) for duplicates
RPD of ≤ 20% is an acceptable result for duplicate aqueous samples, provided the result is 5-10 x the LOR. Where the result is close to the LOR, RPD may exceed 20%.
The Australian Standard for Soils (AS 4482.1-2005), which can be applied to sediments, gives an acceptance criteria RPD of 30-50%