Thẻ ghi nhớ: Lesson 4: Describing graphs | Quizlet
1/22
There's no tags or description
Looks like no tags are added yet.
Name | Mastery | Learn | Test | Matching | Spaced | Call with Kai |
|---|
No analytics yet
Send a link to your students to track their progress
23 Terms
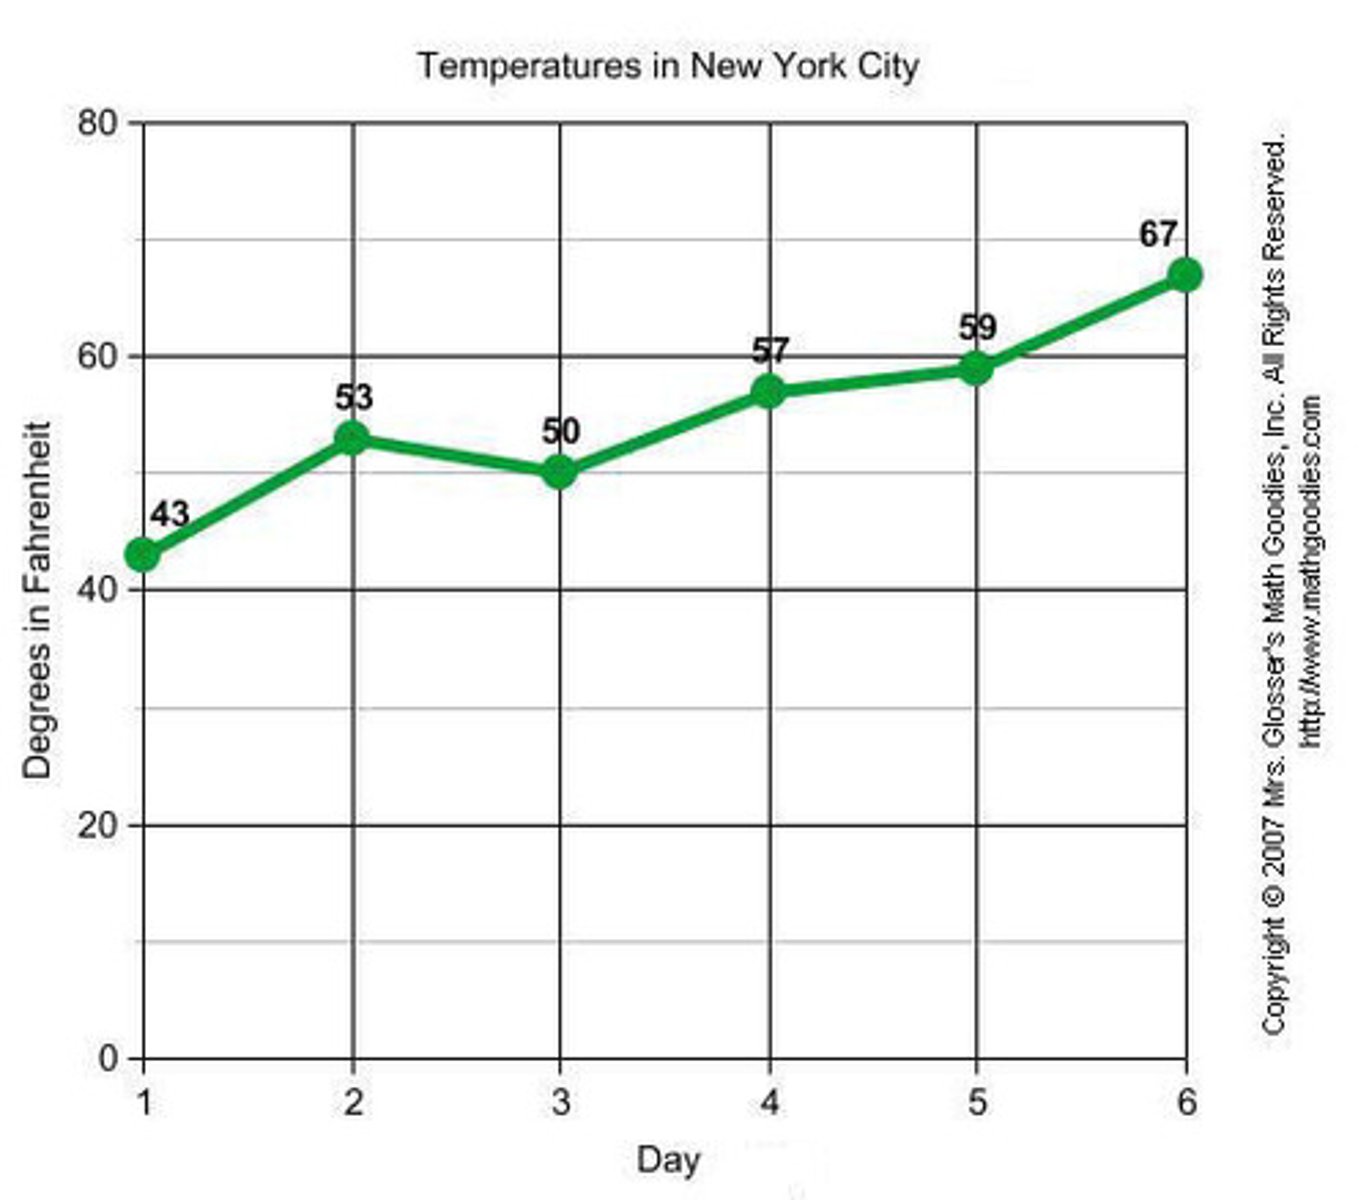
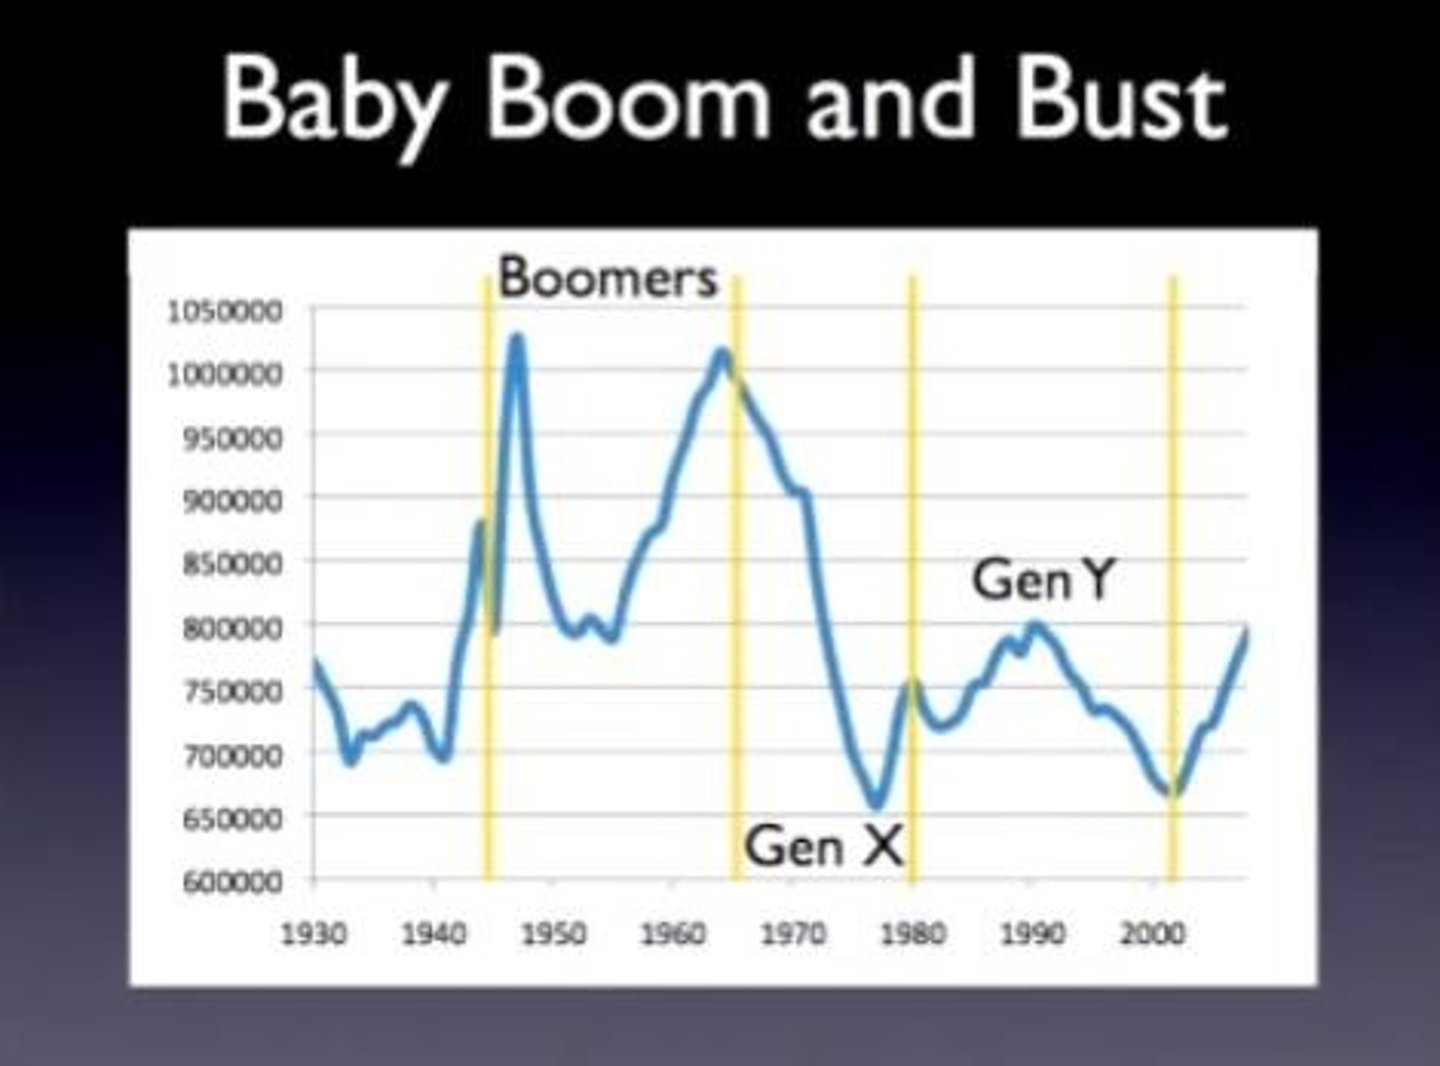
line graph
a graph in which points are connected by a line and which usually shows quantities over a certain time period.
e.g. This _________ _________ we can see a steady increase in temperature over a 6-day period.
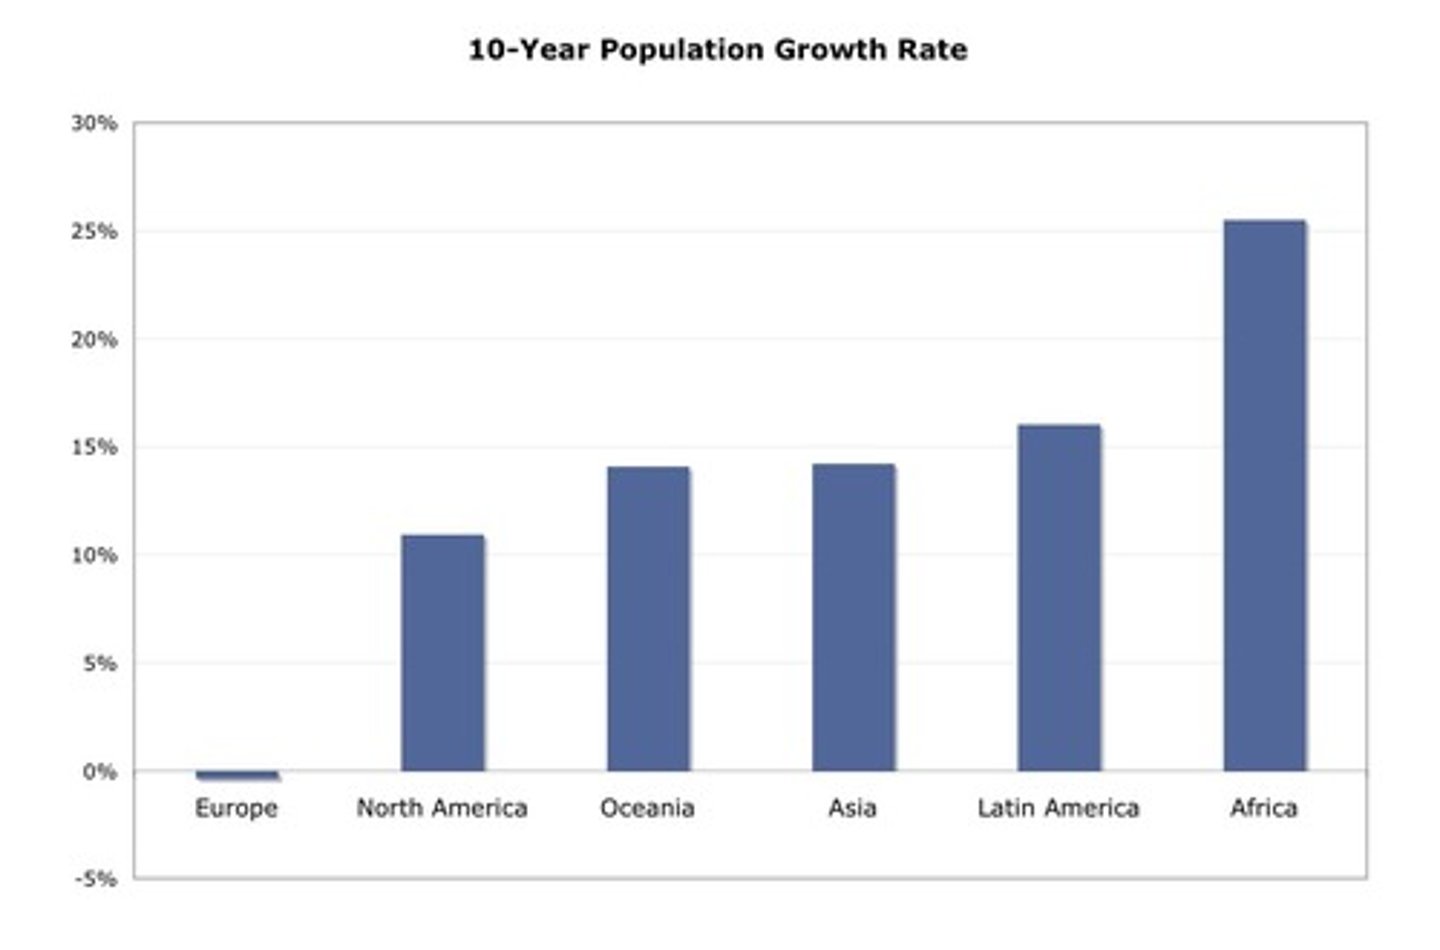
bar chart
a graph using blocks to represent amounts of data.
e.g. The _________ _________ illustrates the population growth rate on each continent over the last ten years.
rapidly
very fast change, focussing on the speed of change over a period.
e.g. Streaming subscriptions increased ____________ from 1.2 million in January 2019 to 4.5 million in December 2021.
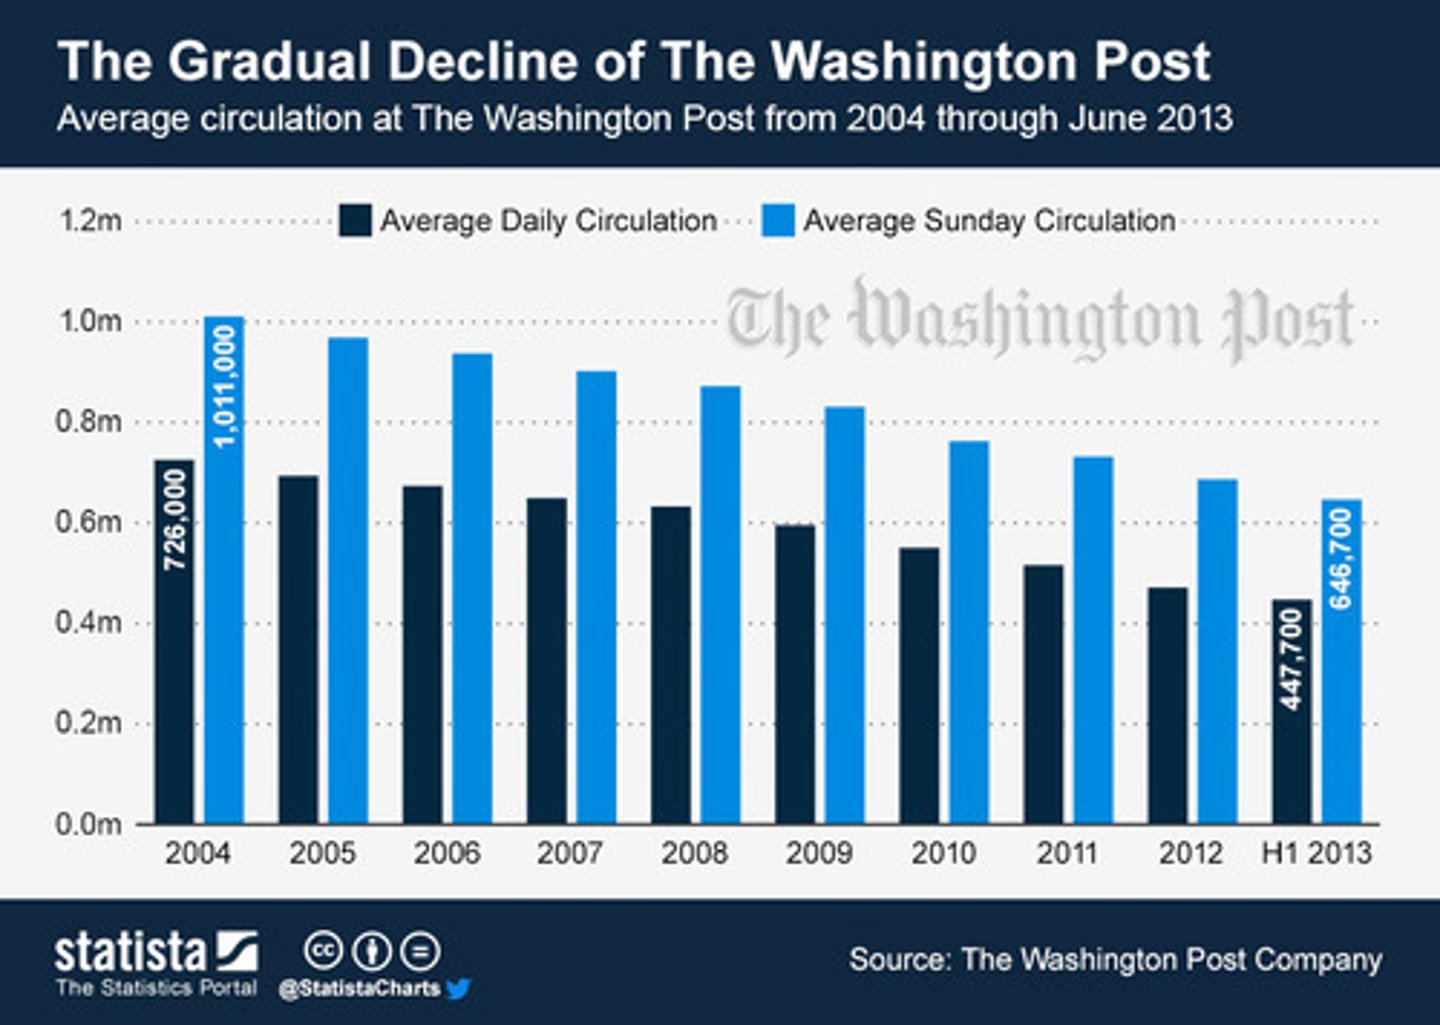
gradually
slow and steady change
e.g. Sunday circulation declined ____________ in from 2004 to 2013.
slight / modest / marginal
small change
e.g. Advertising revenue saw a ____________ / ____________ / ____________ increase from $1.2 million in Q1 2024 to $1.25 million in Q2.
moderate
mid-sized change
e.g. Online news traffic showed a ____________ decline from 2.5 million visits in June to 2.1 million in August.
considerable
large change
e.g. Social media engagement saw a ____________ increase from 150,000 interactions in January to 450,000 in March.
alarming
worryingly large change
e.g. The fall in print subscriptions was ____________, dropping from 400,000 in 2019 to 250,000 in 2021.
substantial
important, large change
e.g. There has been a ____________ increase in the number of smartphone users.
sharply
sudden change; emphasises how abrupt the change rather than how long it lasts.
e.g. Shockingly, streaming viewership fell ____________ from 3.2 million in April to 2.1 million in May.
dramatic
striking or extreme change.
e.g. The decline in DVD sales was ____________ , falling from 2 million units in 2018 to 500,000 in 2020.
to increase / to rise
to become larger or greater in size, amount, number, etc.
e.g. Online advertising revenue ____________ / ____________ from $1.5 million in Q1 2023 to $2.1 million in Q4 2023.
to fall / to drop / to decrease
to go down
e.g. Cinema attendance fell / dropped / decreased from 1.8 million tickets in March to 0.9 million in April 2020.
to stay the same / to remain steady
no significant change
e.g. Social media engagement ____________ ____________ / ____________ ____________ ____________ at around 200,000 interactions per week from January to March.

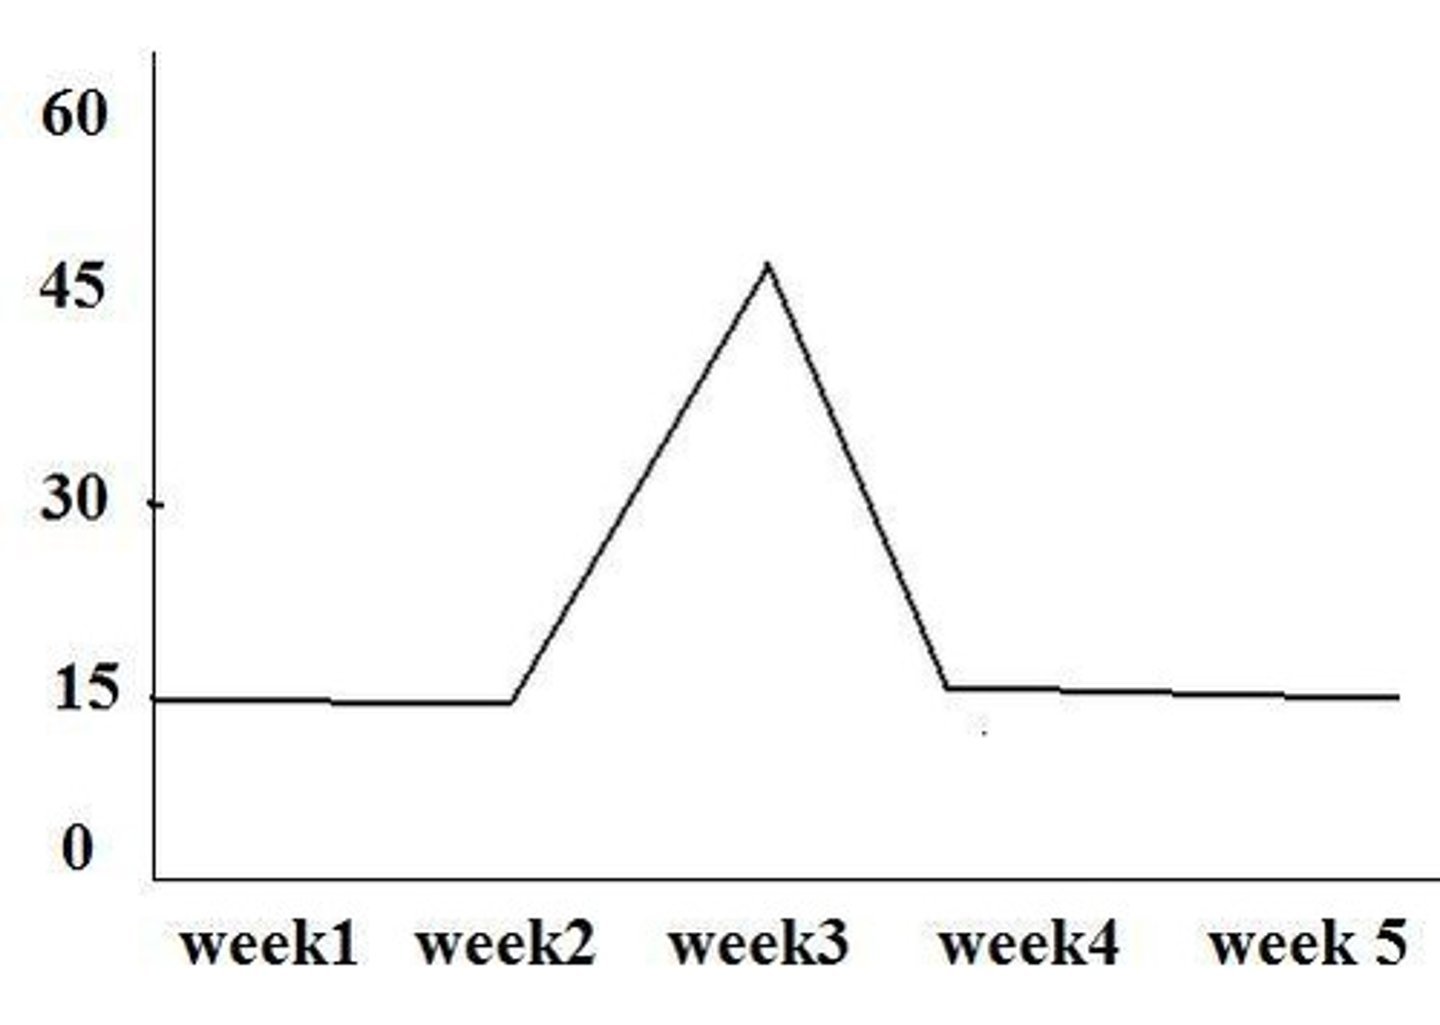
to reach a peak
hit the highest point, mostly used when describing line graphs.
e.g. Streaming subscriptions ____________ ____________ ____________ of 5 million in December 2022.
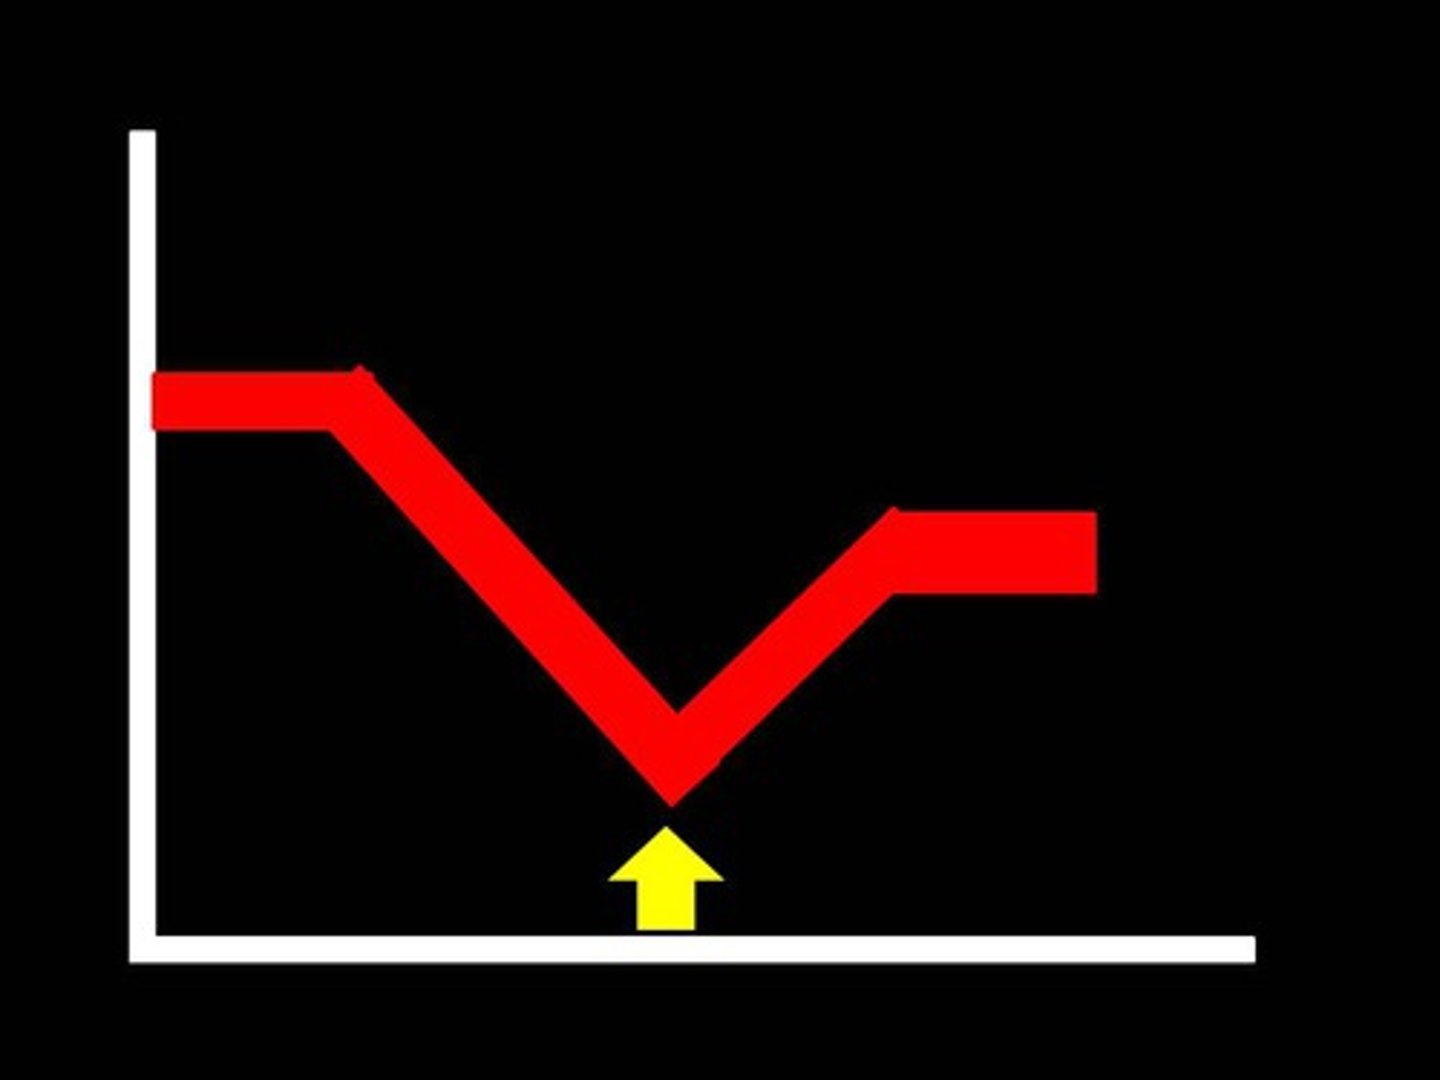
to hit a low / to bottom out
reach the lowest point.
e.g Print media circulation ____________ ____________ ____________ / ____________ ____________ of 220,000 in 2021.
to recover
to return of a previous level
e.g. Podcast downloads ____________ from 60,000 in June to 95,000 in August after a temporary decline.
to stand at
the current value at a particular point.
e.g. Monthly ad revenue ____________ ____________ $2 million as of October 2023.
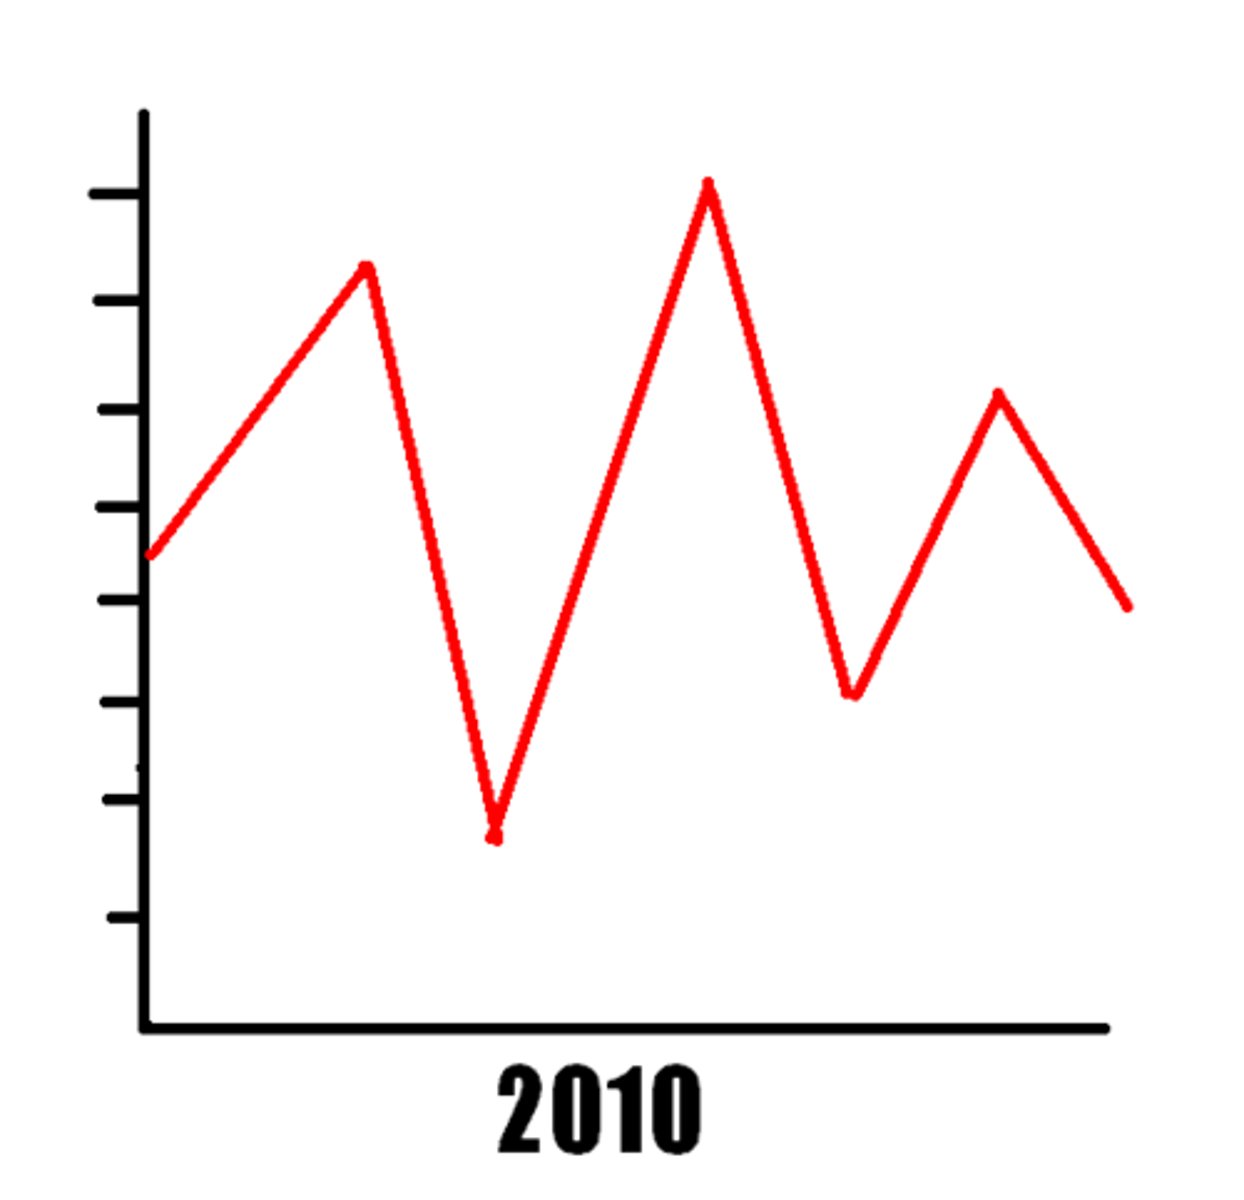
to fluctuate
move up and down irregularly.
e.g. TV ratings ____________ between 1.2 million and 1.8 million viewers throughout the week.
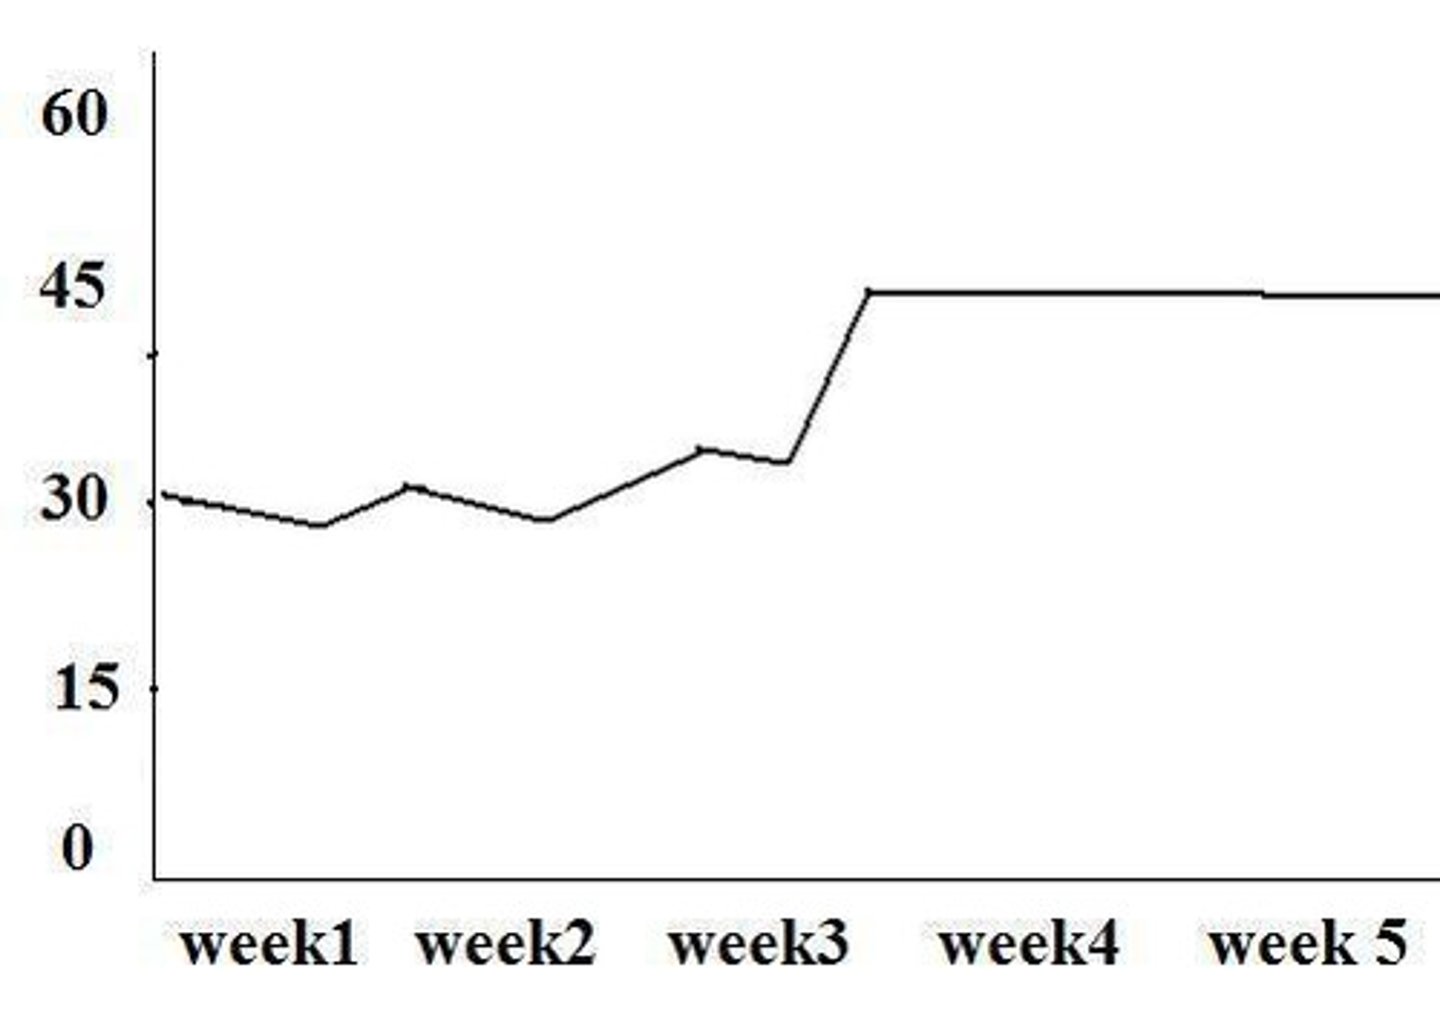
to level off (at)
stabilise after a period of increase or decrease.
e.g. Online news visits ____________ ____________ ____________ 2 million per week after rising from 1.2 million in January.
to plummet
to decrease quickly and steeply.
e.g. Cinema attendance ____________ from 1.8 million in March to 0.9 million in April 2020 due to the pandemic lockdown.
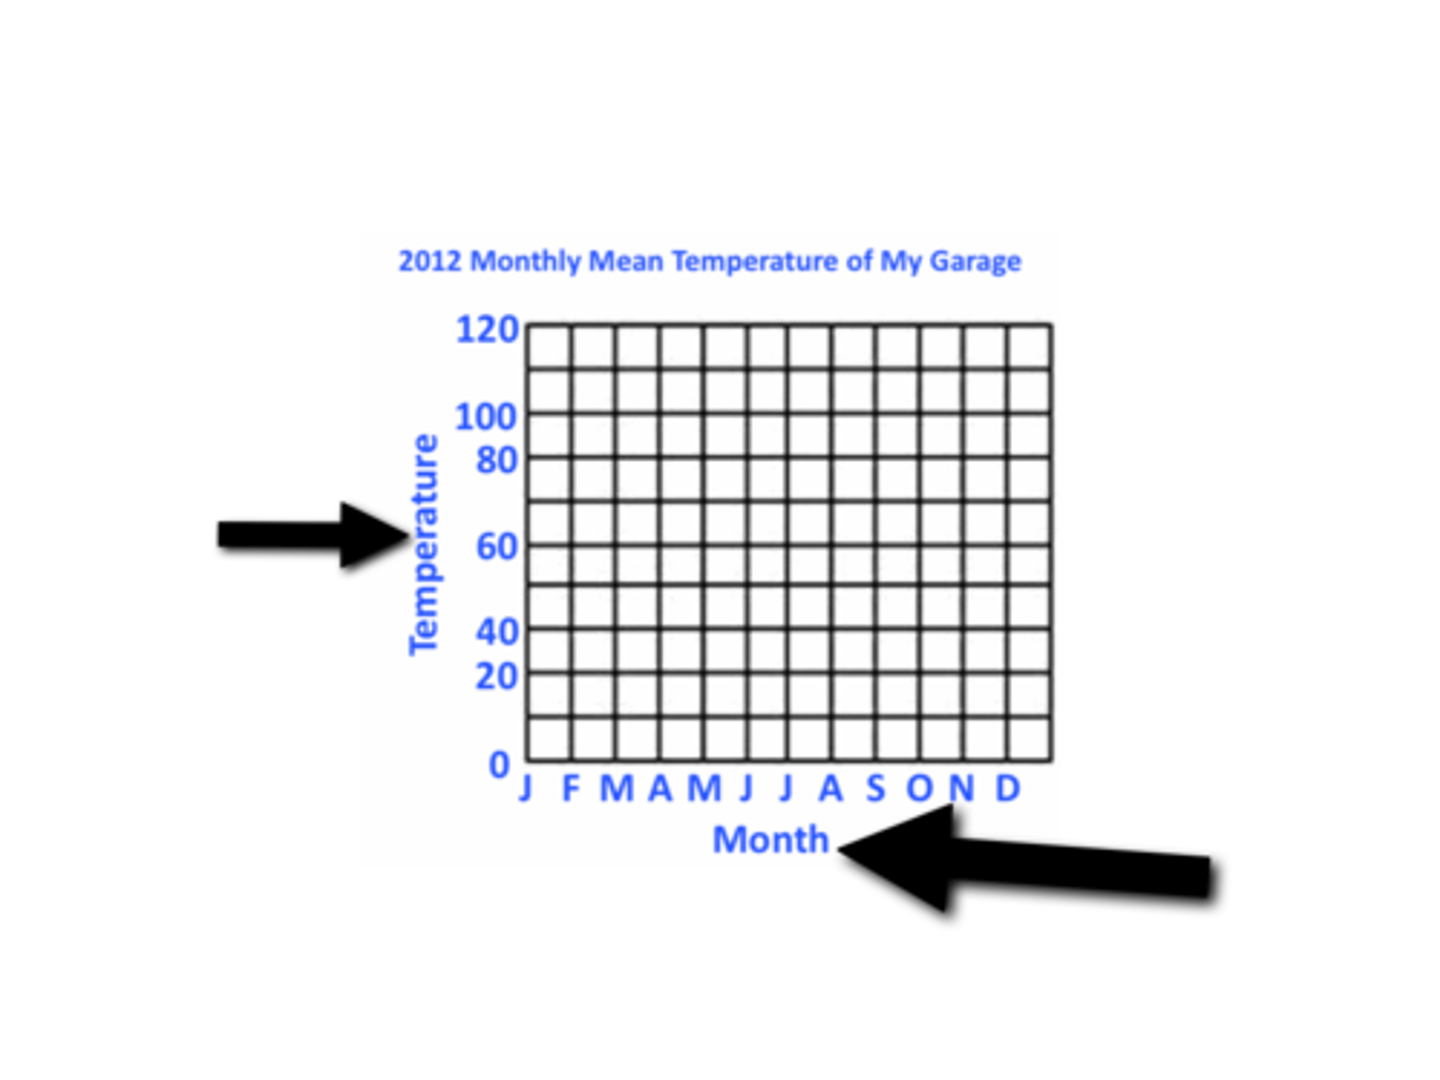
Axis labels
the titles describing what each axis represents. X-axis (horizontal) – usually shows categories, time periods, or independent variables.
Y-axis (vertical) – usually shows values, percentages, or quantities.
e.g On the x-____________ , the chart shows different types of media platforms, while the y-____________ represents the percentage of audience reach.
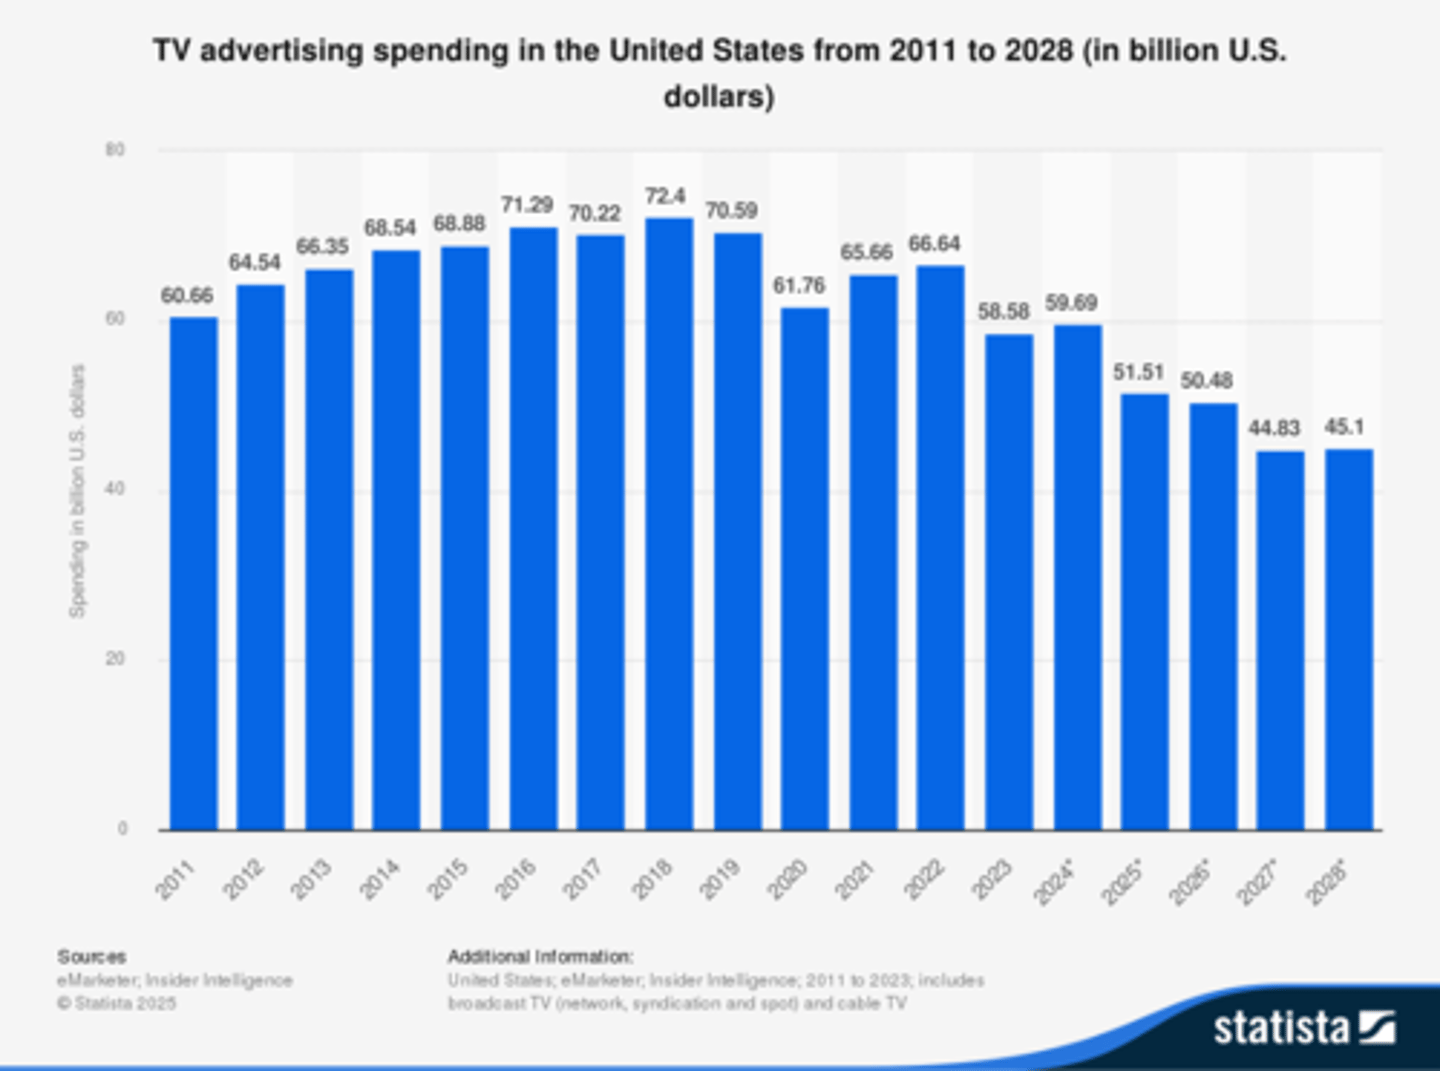
bars
rectangular shapes representing values in a bar chart.
e.g. The ____________ in the chart illustrate the TV advertising spending in the U.S. from 2011 to 2028.