SCM Exam 3
1/43
There's no tags or description
Looks like no tags are added yet.
Name | Mastery | Learn | Test | Matching | Spaced | Call with Kai |
|---|
No analytics yet
Send a link to your students to track their progress
44 Terms
Product-based layout v Functional layout
Product-based: Resources are arranged sequentially, according to the steps required to make a product
Functional: Resources are physically grouped by function (ex. car shop: rims, tires, engines, etc.)
Classic manufacturing processes (5)
Production lines
Continuous flow
Job shops
Batch manufacturing
Fixed position
Production line
Used to produce a narrow range of standard items with identical or highly similar designs
Continuous flow
Basically a production line process but the product cannot be broken into discrete units
(ex. yarns/fabric, food, chemical products like oil/gas)
Job shops
Used to make a wide variety of highly customized products in quantities as small as one
Batch manufacturing
Items are moved through the different manufacturing steps in groups, or batches
Fixed position
The position of the product is fixed; Materials, equipment, and workers are transported to and from the product. (Ex. large products like a ship or plane)
Hybrid manufacturing processes (3)
Combine the characteristics, and hence advantages, of more than one of the classic processes.
- Machining center
- Group technology
- Flexible manufacturing systems (FMS)
Machining center
completes several steps without removing an item from the process, or performing multiple steps at once
Group technology (+ sub layouts)
Dedicating equipment and personnel to the manufacture of products with similar manufacturing characteristics
Group together similar mft steps/ppl
Cellular layout: Resources are physically arranged according to the dominant flow of activities for the product family (a set of products with very similar manufacturing requirements)
Additive mft: 3d printing to add something where needed
Flexible manufacturing systems (FMS)
Highly automated processes that can reduce the cost of making groups of similar products
Highly automated
Product customization (4)
Make-to-stock (MTS): No customization
Assemble-to-order (ATO): products are assembled quickly from pre-stocked components only after a customer order is received
Make-to-order (MTO): Use standard components but have customer-specific final configuration of components
Engineer-to-order (ETO): Produced from the start to meet unusual customer needs or requirements
Service processes (3)
Three dimensions on which services can differ:
Service package
Service customization
Customer contact
Service package
A package that includes all the value-added physical and intangible activities that a service organization provides to the customer
Physical: FedEx / Ford
Intangible: law firm
Customer contact
Front room: Customer has direct contact with service organization (front desk/online shopping website)
Back room: No customer contact (warehouse/workshop)
Layout decision models (2)
Line balancing: Assigning tasks to workstations to minimize number of workstations and idle time
Assigning department locations in functional layouts: arranging departments to ensure departments that should be close together are and others that don't need to be close are not
Line balancing (6 steps)
1) Identify all process steps, their times, and their predecessors
2) Draw a precedence diagram
3) Determine the Takt Time for the line
4) Compute the theoretical minimum # of workstations needed
5) Assign tasks to each workstation until takt time is reached
6) Calculate performance measures
Takt Time equation
Available production time /
required output rate (demand)
Quality
The characteristics of a product or service that bear on its ability to satisfy stated or implied needs
Value perspective
Conformance perspective
Value perspective: Quality must be judged by how well the characteristics of a product or service align with the needs of a specific user (fits the user's needs)
Conformance perspective: Focuses on whether or not a product was made or a service was performed as intended (made right)
Costs of quality (4)
Internal failure costs: failure before delivery to customers (scrap/repair costs)
External failure costs: failure after delivery to customers (returned goods/warranty costs)
Appraisal costs: Costs related to evaluating products, processes, and parts/services (testing labs + inspectors)
Prevention costs: Cost of reducing potential internal failures (training employees, investing in new processes)
Traditional + Zero defects view
Traditional defects view: As defect rate inc, failure cost inc, as defect level dec, prevention cost inc (need to find the balance)
Zero defects view: Once defects reach near zero, there is no need to inspect so prevention costs hold steady or dec
Total quality management (7 components)
A managerial approach in which an entire organization is managed so that it excels in all quality dimensions that are important to customers
1) Customer focus: Every employee has a customer whose expectations must be met (even if not final customer)
2) Leadership involvement: Managers must express quality importance to all employees
3) Continuous improvement
4) Employee empowerment
5) Quality assurance: SQC
6) Supplier partnerships
7) Strategic quality plan: Provide vision, guidance, and measurements
Statistical quality control (SQC) (4)
The application of statistical techniques to quality control
Process capability
Six sigma quality
Control charts
Acceptance sampling
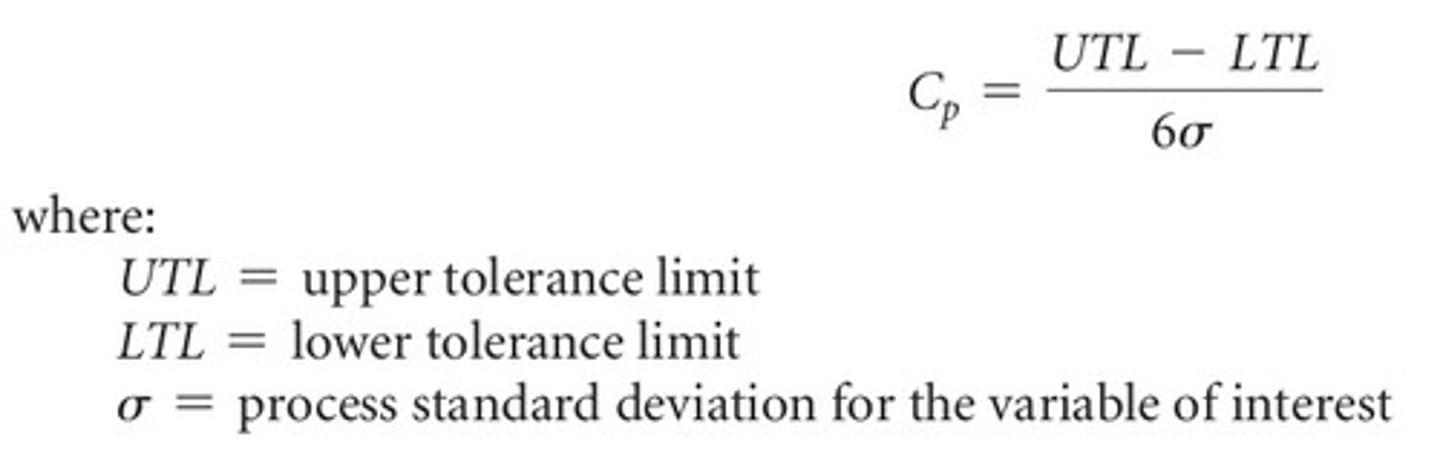
Process capability
Capability of a process to meet certain quality standards
C >= 1 means process is capable of meeting standard

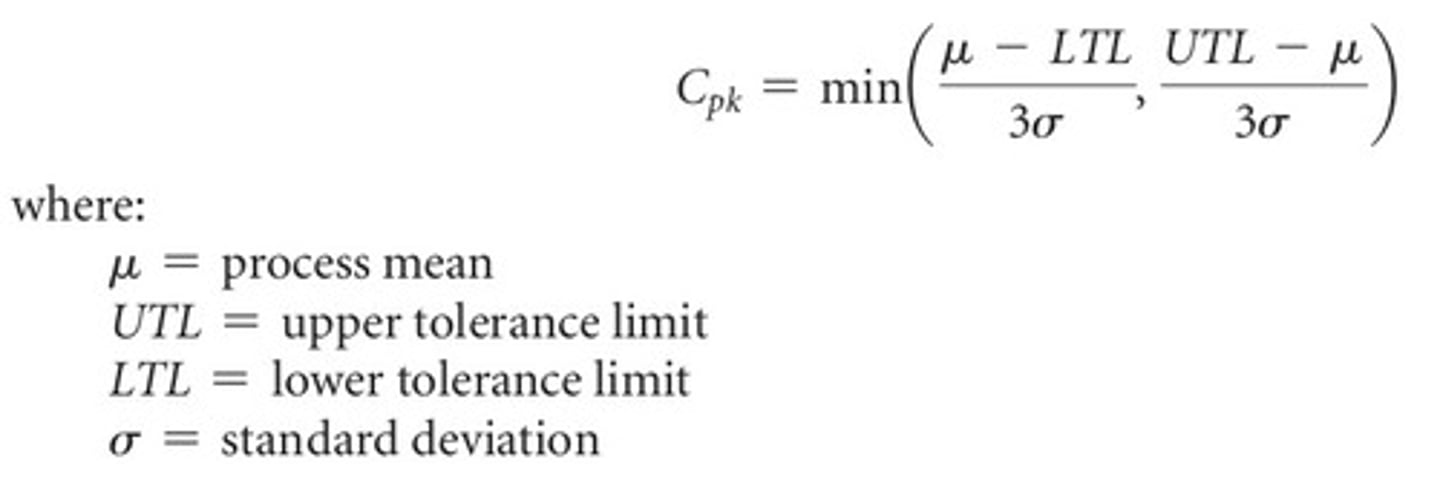
Process capability index
an index that measures the potential for a process to generate defective outputs relative to either upper or lower specifications
Six sigma quality
A level of quality that indicates that a process is well controlled
- Goal is to make the process capability ratio >= 2
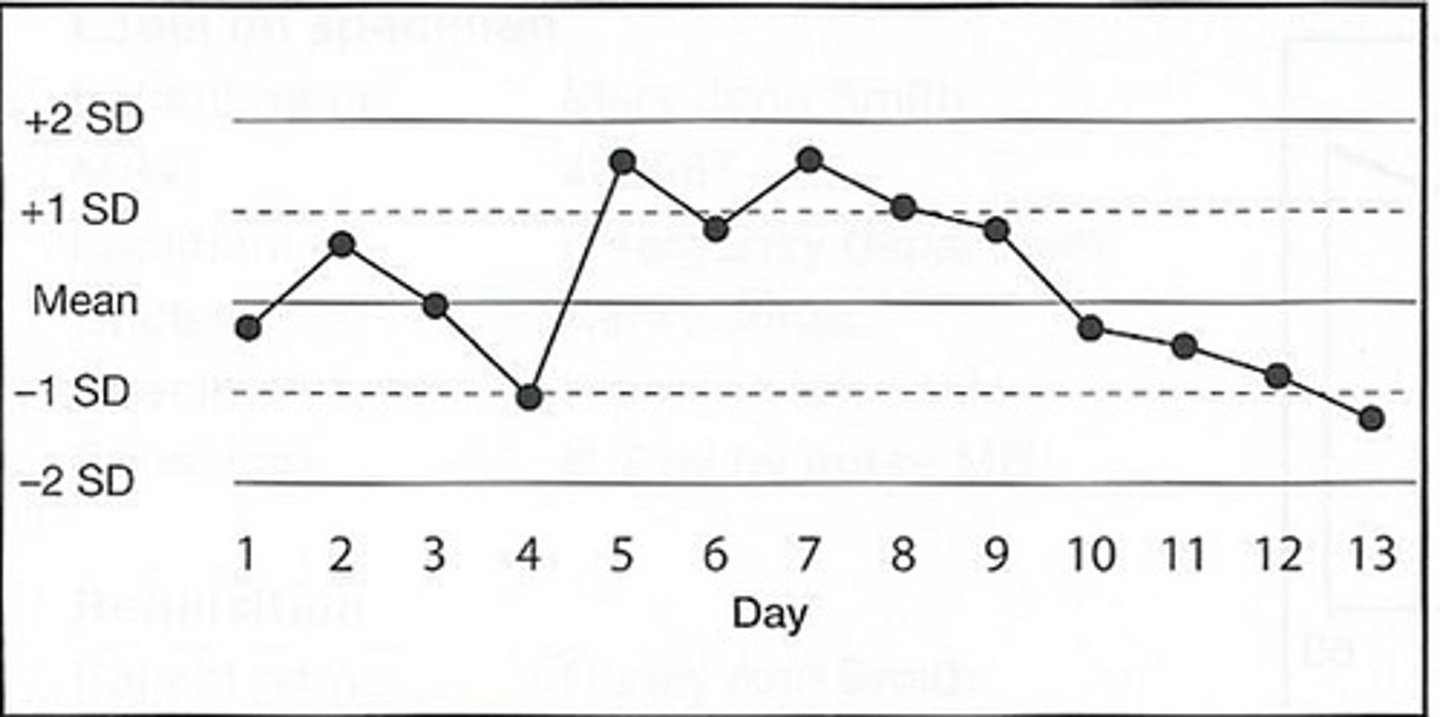
Control charts (3)
a specialized run chart that helps an organization track changes in key measures over time
Control charts for variables:
X-bar chart: Avg value (Is my average changing?)
R chart: Range = max-min (Is my consistency changing?)
Control chart for attributes:
P chart: tracks % defective rate (How many are bad?)
Sampling
Using carefully selected samples to get an idea of how well a process is working
Purposes of Inventory (5)
1. To maintain independence of operations
2. To meet variation in product demand
3. To provide a safeguard for variation in raw material delivery time (protect from supply delays, shortages, and quality problems)
4. To allow flexibility in production scheduling
5. To take advantage of quantity discounts
Inventory types (6)
Cycle stock: Planned inventory for expected sales
Safety stock: Extra to protect against uncertainties in demand
Anticipation inventory: Extra held in anticipation of demand inc
Hedge inventory: Extra held in anticipation of a future supply issue
Transportation inventory: Inv. currently in transit between locations
Smoothing inventory: Extra inventory held to maintain stable production or operations despite fluctuations in demand (level-production)
Demand types (2)
Independent demand
- Inv items whose demand levels are determined by outside customers
- Beyond a company's complete control, requires forecasting
- Demand comes from customers
(Ex. truck dealership)
Dependent demand
- Inv whose demand levels are determined by a company's planned production of a finished product
- Company has complete control
- demand comes from own production needs
(Ex. truck manufacturing plant)
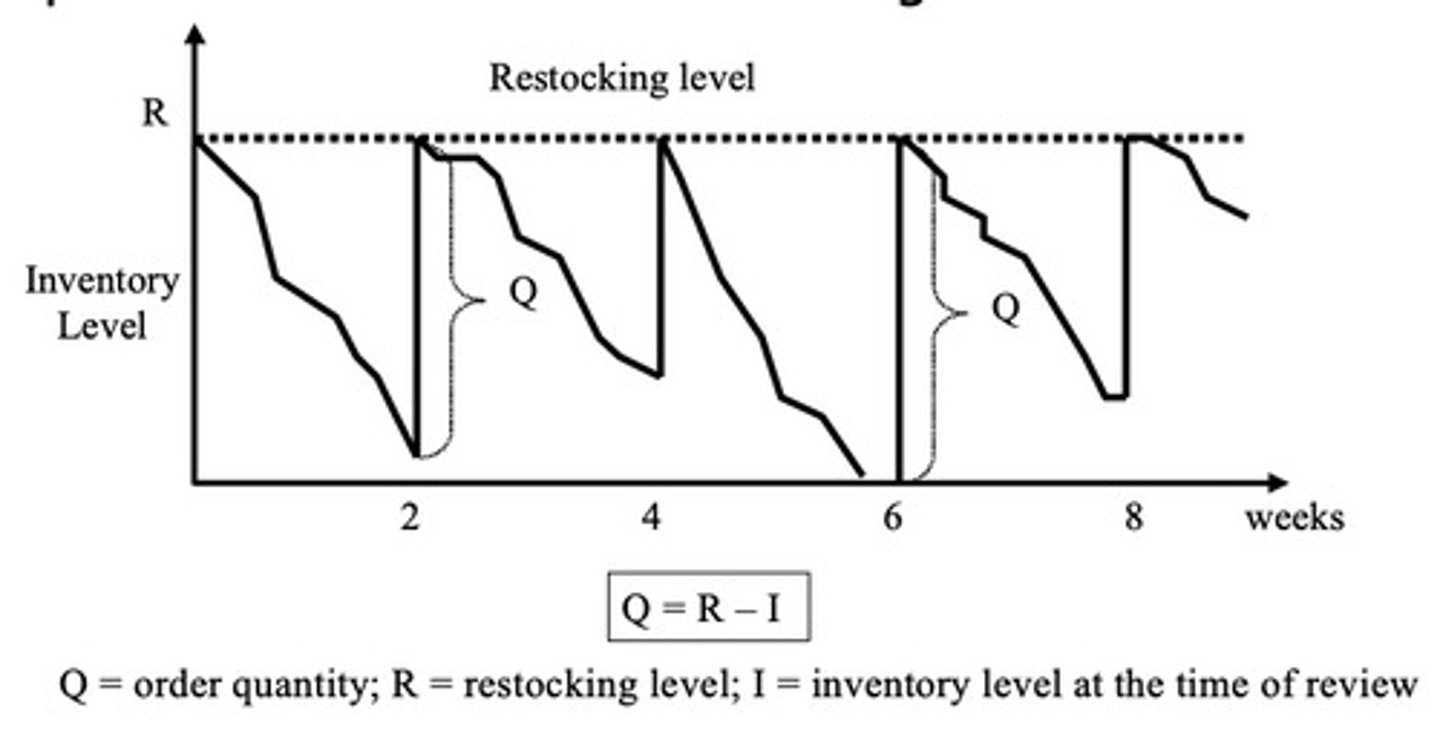
Periodic review system
Inventory level for an item is checked at regular intervals and restocked to some predetermined level. reviewed periodically, around every 1-2 weeks
Q = R - Inv
Restocking level
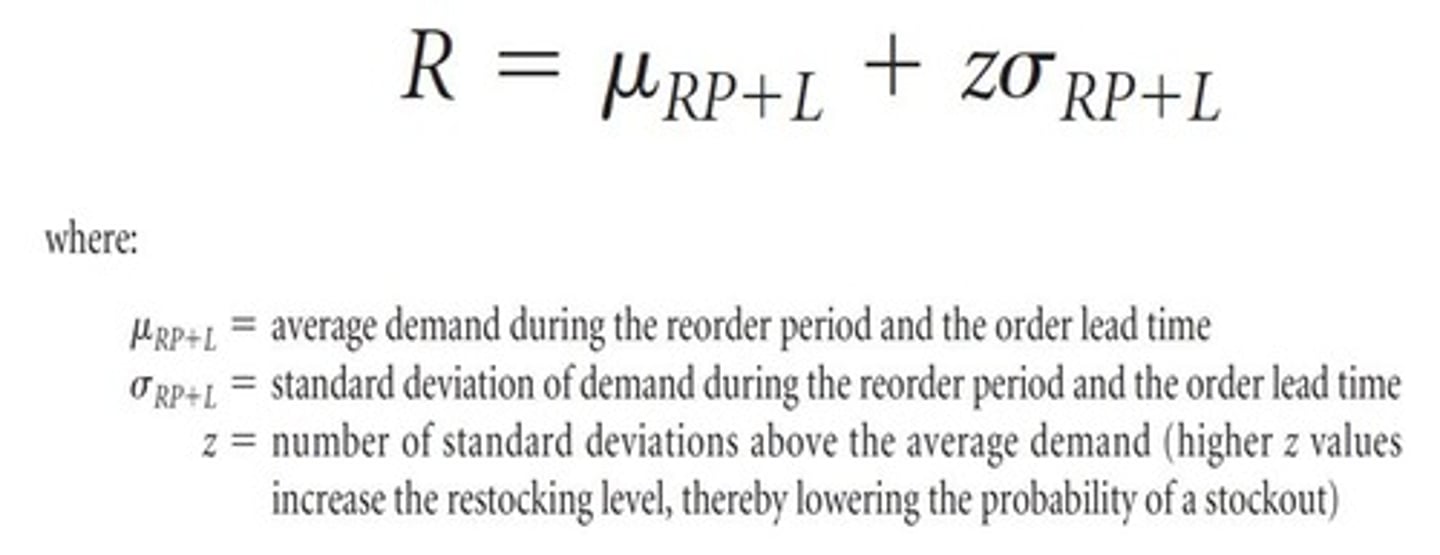
Restocking level example
Avg d = 250
SD = 50
demand should be met 90% of time: z = 1.28 (found on provided chart)
250 + 50(1.28)
= 314
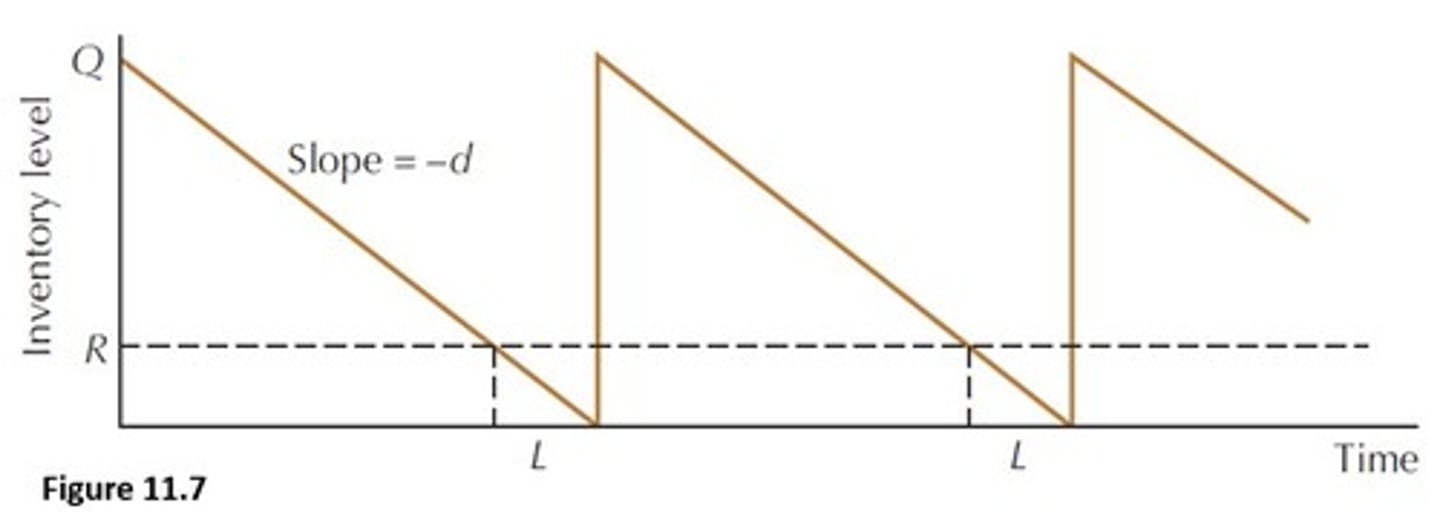
Continuous review system
Inventory level for an item is constantly monitored, and when the reorder point is reached, an order is released
L = lead time (ordered not when Q=0 or else there will be some time with no inv)
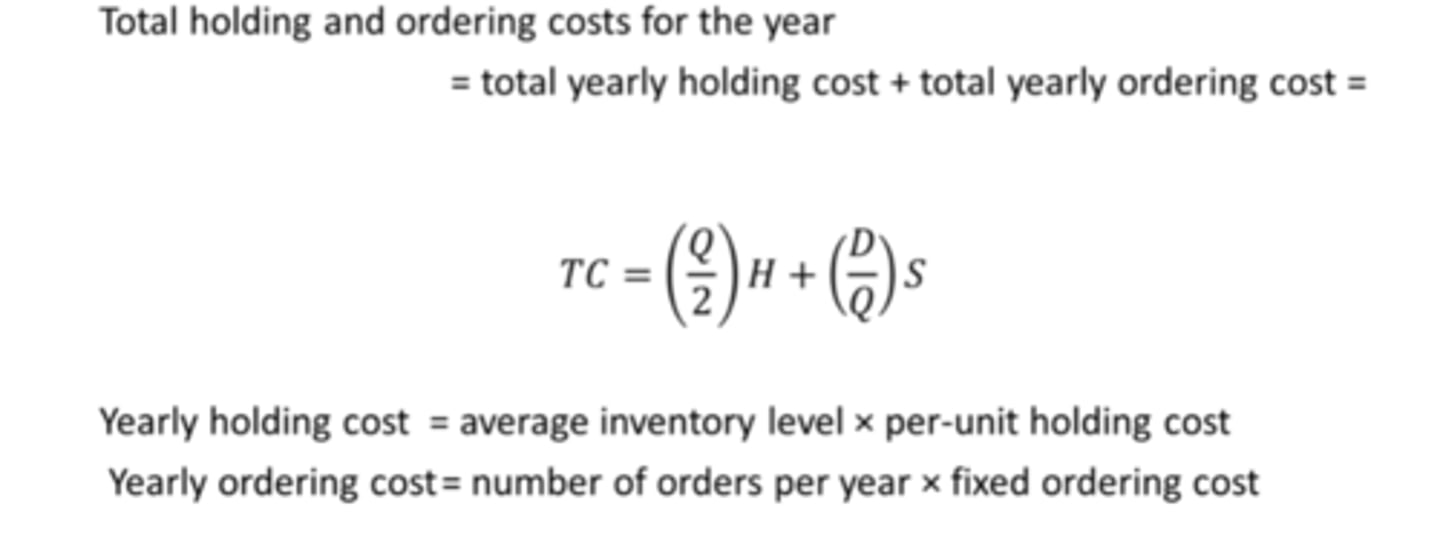
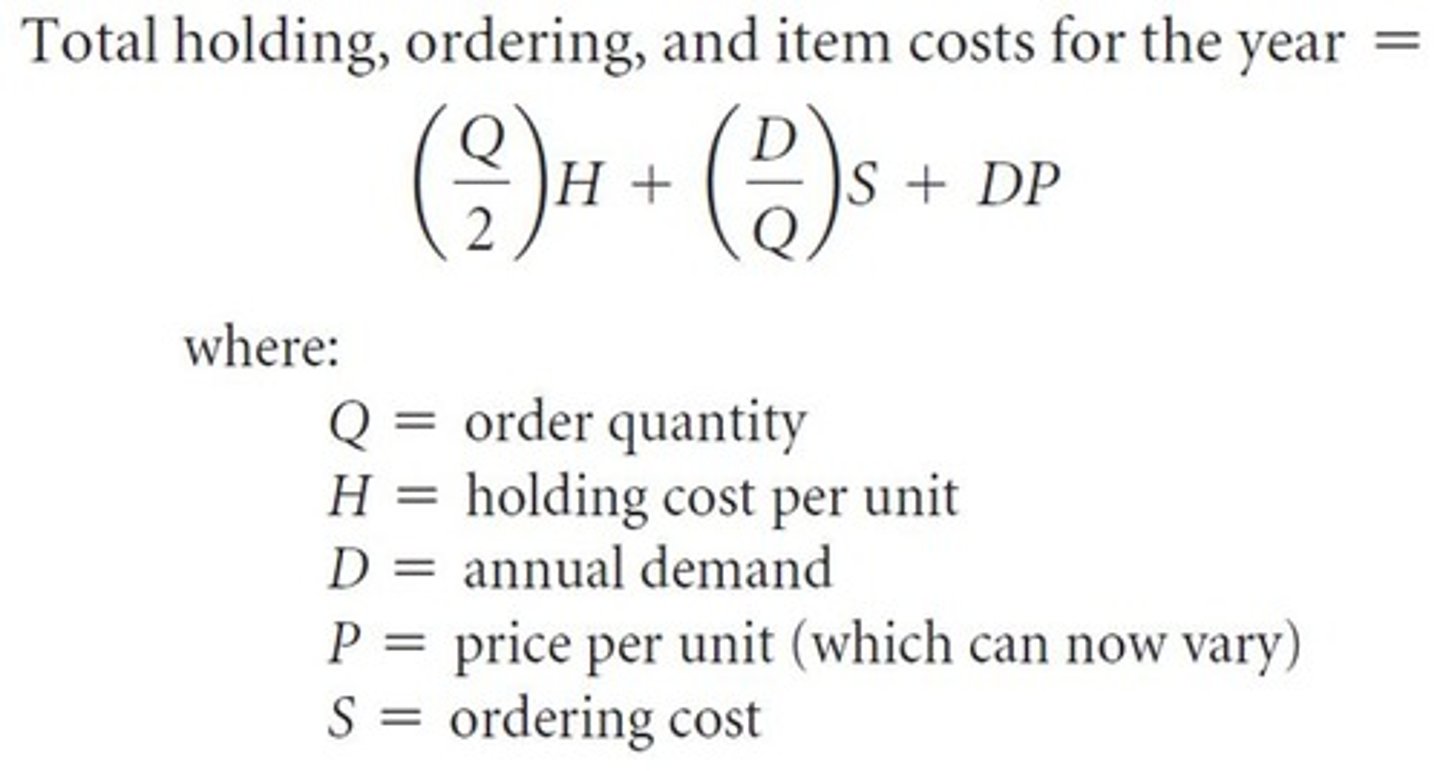
Continuous review system: Total Cost (TC)
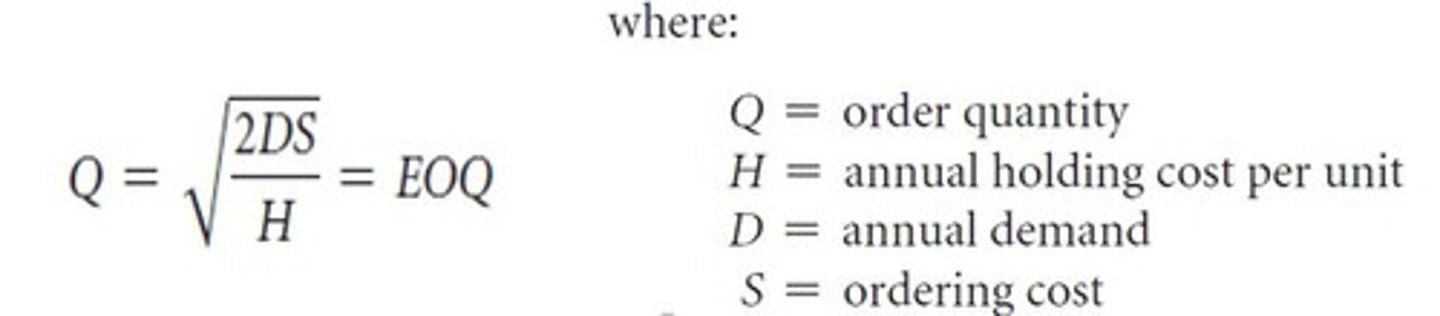
Continuous review system: Economic Order Quantity (EOQ)
Continuous review system ex
Demand = 2000
Annual holding cost = $10
Ordering cost = $25
Order quantity = ?
Total Cost = ?
EOQ:
SQRT[2DS / H] = SQRT[2(2000)($25) / $10]
= 100 units
TC = (Q/2)H + (D/Q)S = (100/2) $10 + (2000/100) $25
= $1000
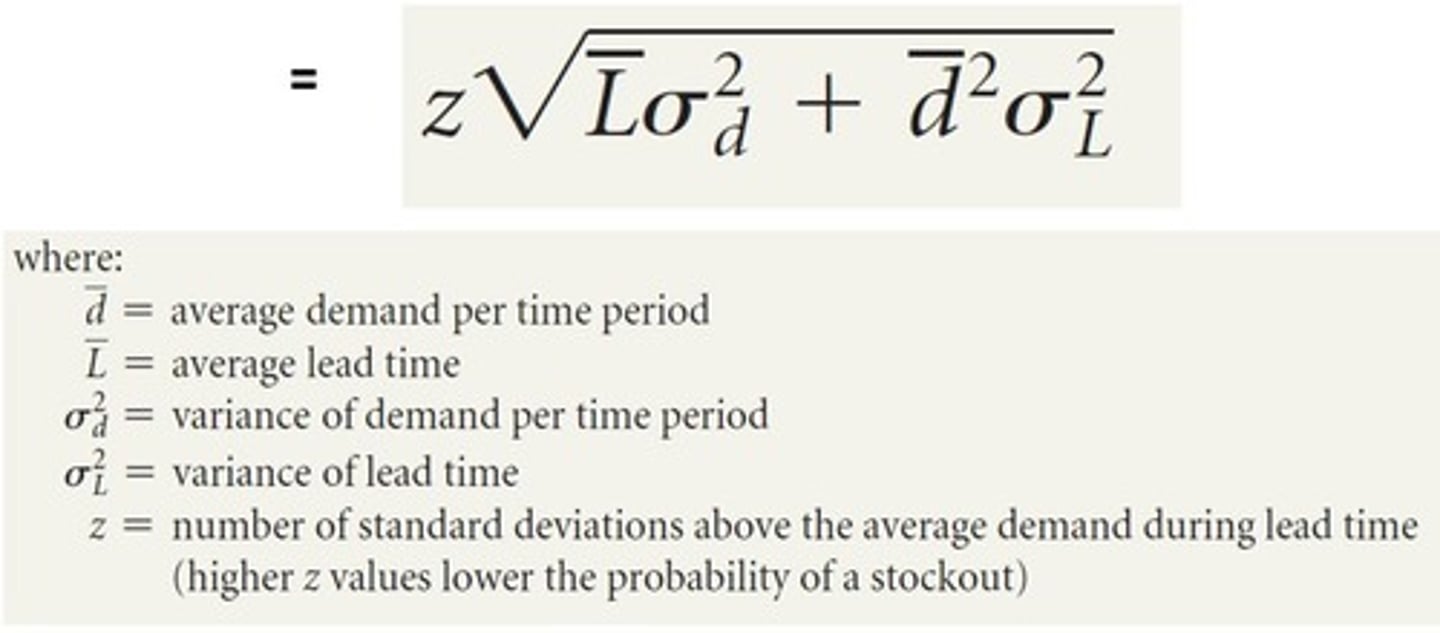
Safety Stock SS
the extra inventory held by businesses to mitigate the risk of stockouts caused by demand surges, supply delays, or inaccurate forecasts
reorder point (ROP) = dL * SS
Quantity discounts
Bullwhip effect
An extreme change in the supply position upstream in a supply chain generated by a small change in demand downstream in the supply chain
small fluctuations in consumer demand cause progressively larger, amplified fluctuations in orders upstream
Inventory positioning
The cost and value of inventory increase as materials move down the supply chain
The flexibility of inventory decreases as materials move down the supply chain
Transportation, packaging, and material handling considerations
There is more to determining order quantities than just holding, ordering, and item cost