Lectures #13-19
1/153
There's no tags or description
Looks like no tags are added yet.
Name | Mastery | Learn | Test | Matching | Spaced | Call with Kai |
|---|
No analytics yet
Send a link to your students to track their progress
154 Terms
Mendel’s Principle of Segregation
each diploid organism has two alleles for each gene (locus)
these alleles separate during meiosis, so each gamete receives only one allele
explains why offspring inherit one allele from each parent
Mendel’s Principle of Independent Assortment
alleles at different loci (different genes) assort independently during gamete formation
The separation of one pair of alleles does not affect how another pair separates
leads to genetic recombination: new combinations of traits
Recombination
Def: the process of sorting alleles into new combinations
In F1, (AaBb) individuals
Parental gametes (nonrecombinant): AB and ab
Recombinant gametes: Ab and aB
Recombination occurs when crossing over happens between homologous chromosomes
Result: new combinations of alleles that differ from those found in the parent (now have recombinant gametes)
Recombination frequency helps geneticists measure the distance between genes on a chromosome
Recombinant Gametes
Gametes that contain new combinations of alleles
Non-Recombinant Gametes
Gametes that contain only the original combinations of alleles that were present in the parents
Connecting Mendel to Chromosomes
Walter Sutton (1903): proposed that genes are located on chromosomes
explains the physical basis for Mendel’s principles
Segregation: homologous chromosomes separate during meiosis I → each gamete gets one chromosome with one allele per gene
Independent Assortment: each pair of homologous chromosomes aligns and separates indepdently of others during meiosis
HOWEVER: most organisms have fewer chromosomes than genes, so some genes must share the same chromosome
If genes are on the same chromosome, they can violate independent assortment and tend to be inherited together
Linked Genes
genes located close together on the same chromosome (likelihood of crossing over between these two genes is very low)
tend to be inherited together
these genes form a linkage group and do not assort independently
During meiosis:
linked genes usually travel together into the same gamete
only crossing over can separate them and create recombinant gametes
Degree of linkage
Close together → strong linkage, few recombinants
Far apart → weaker linkage, more recombinants
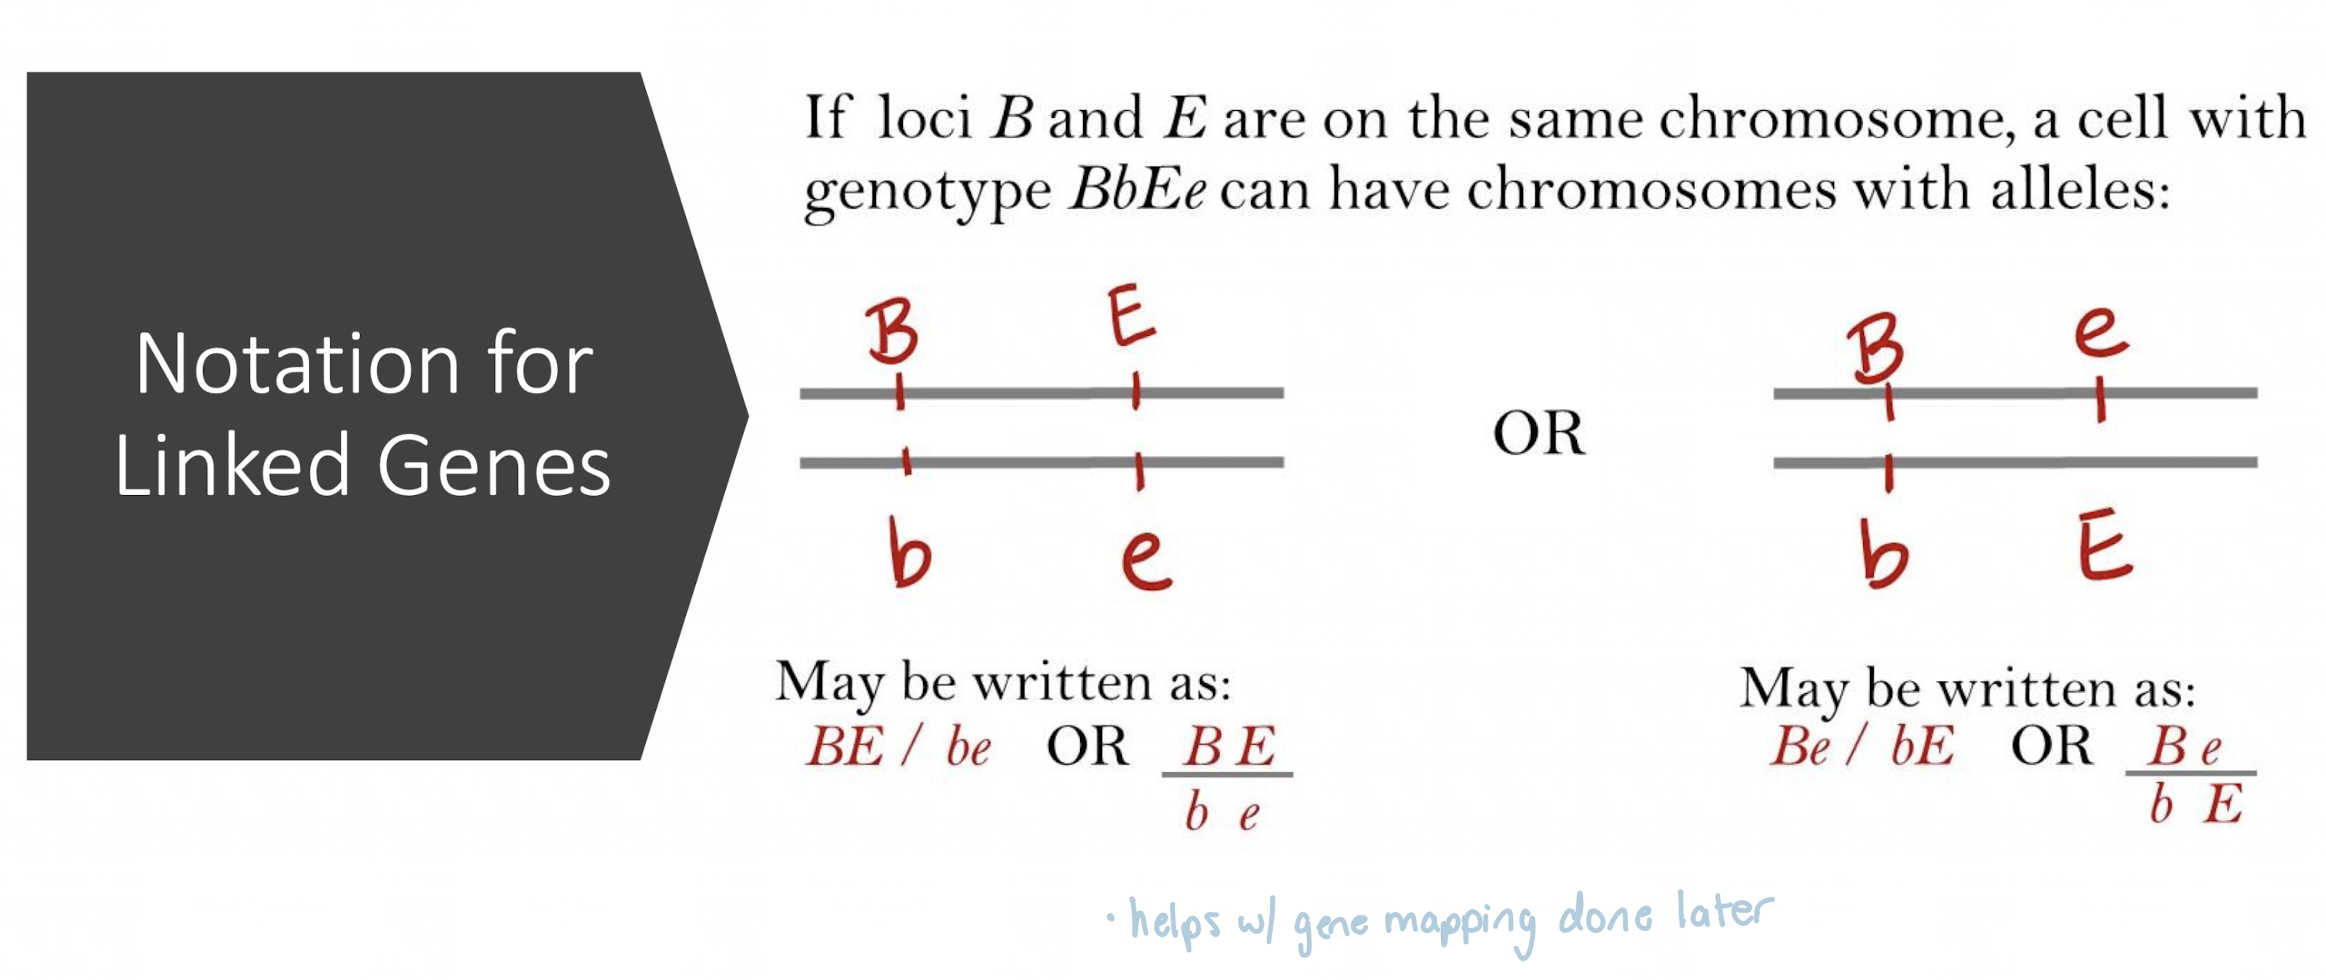
Notation for Linked Genes
BE / be
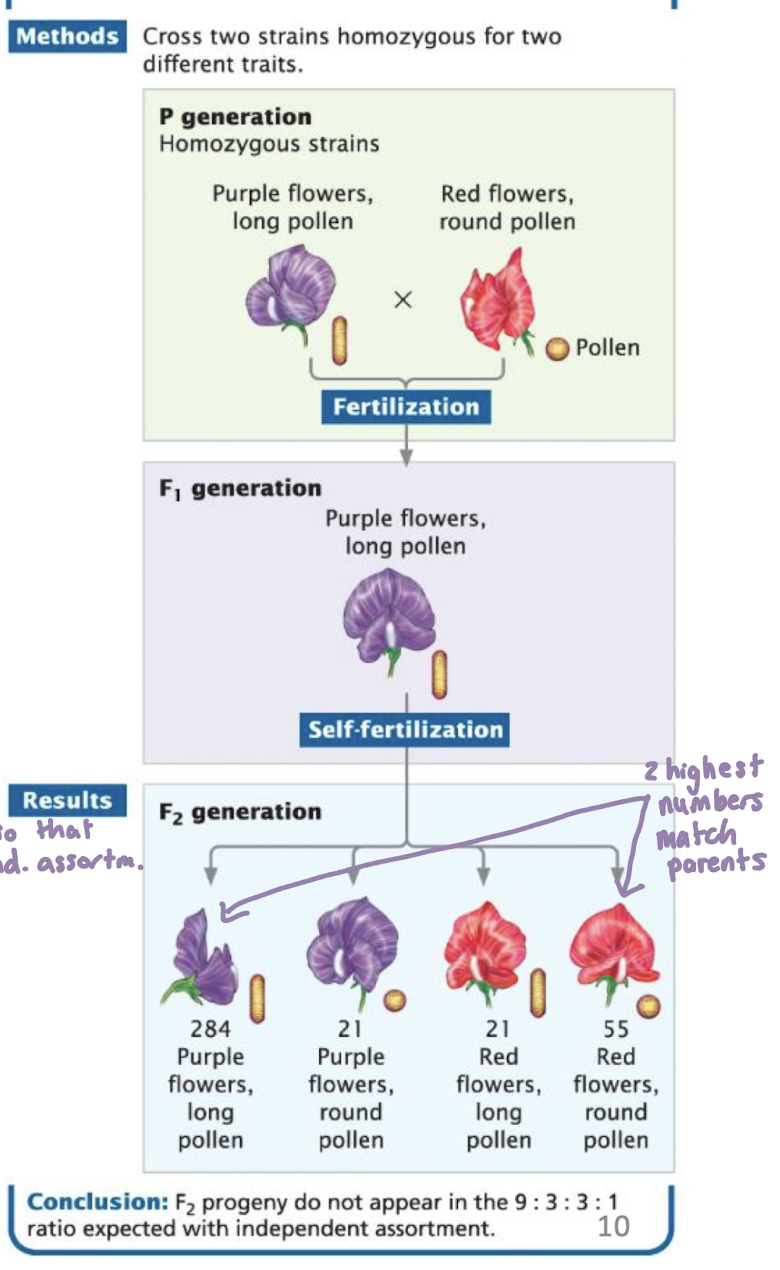
Linkage in Sweet Peas (Lathyrus odoratus)
parental cross
P1: Purple flowers, long pollen
P2: Red flowers, round pollen
F1: all purple and long (dominant traits)
F2: ratios did not match expected Mendelian 9:3:3:1
Conclusion: the genes for flower color and pollen shaped are linked on the same chromosome
they did not assort independently
recombination between them was limited
How Crossing Over Breaks Linkage
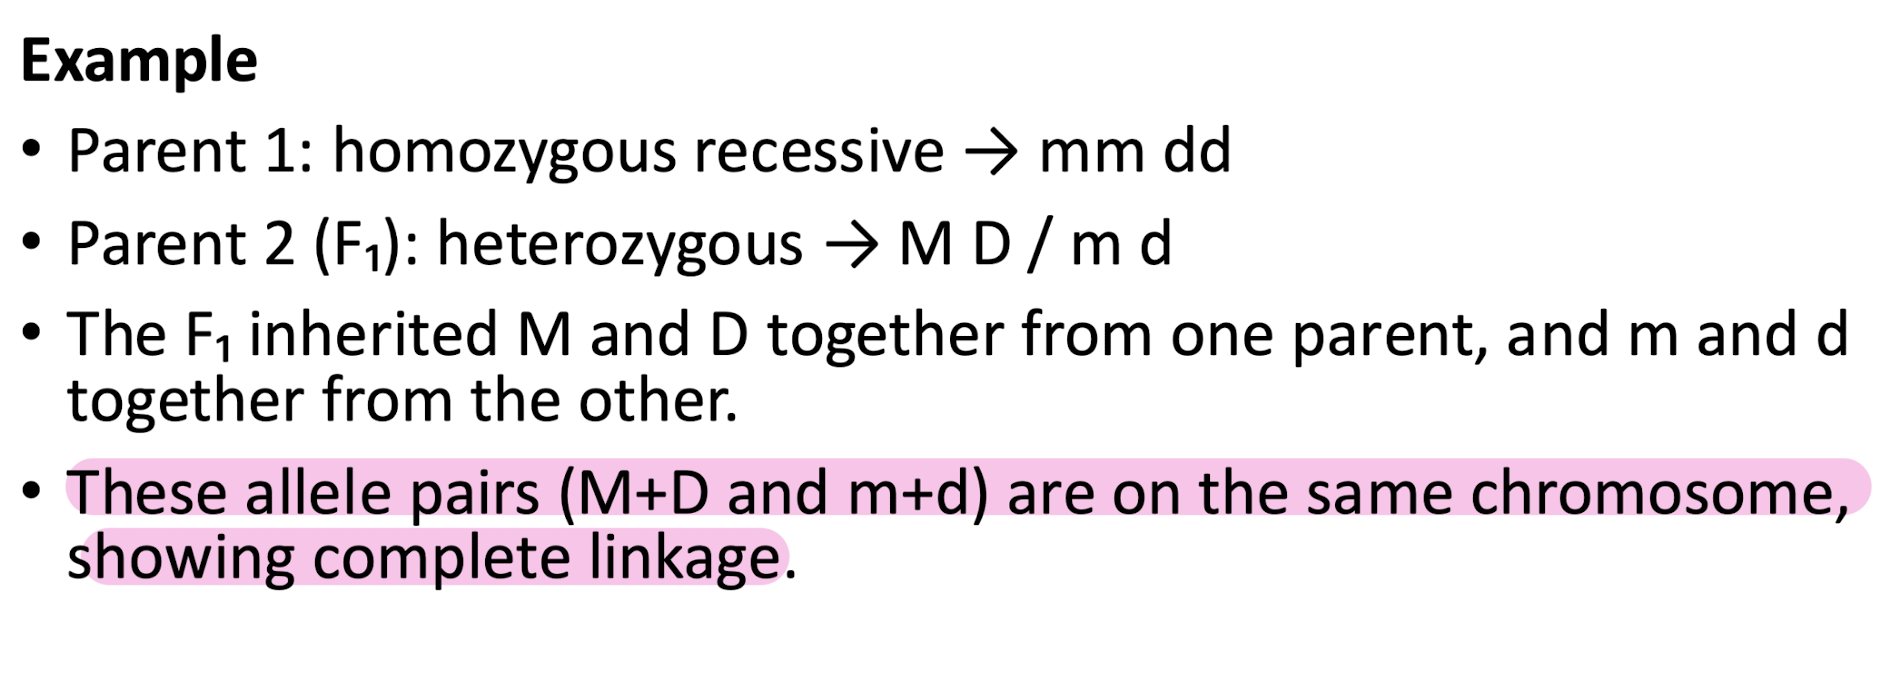
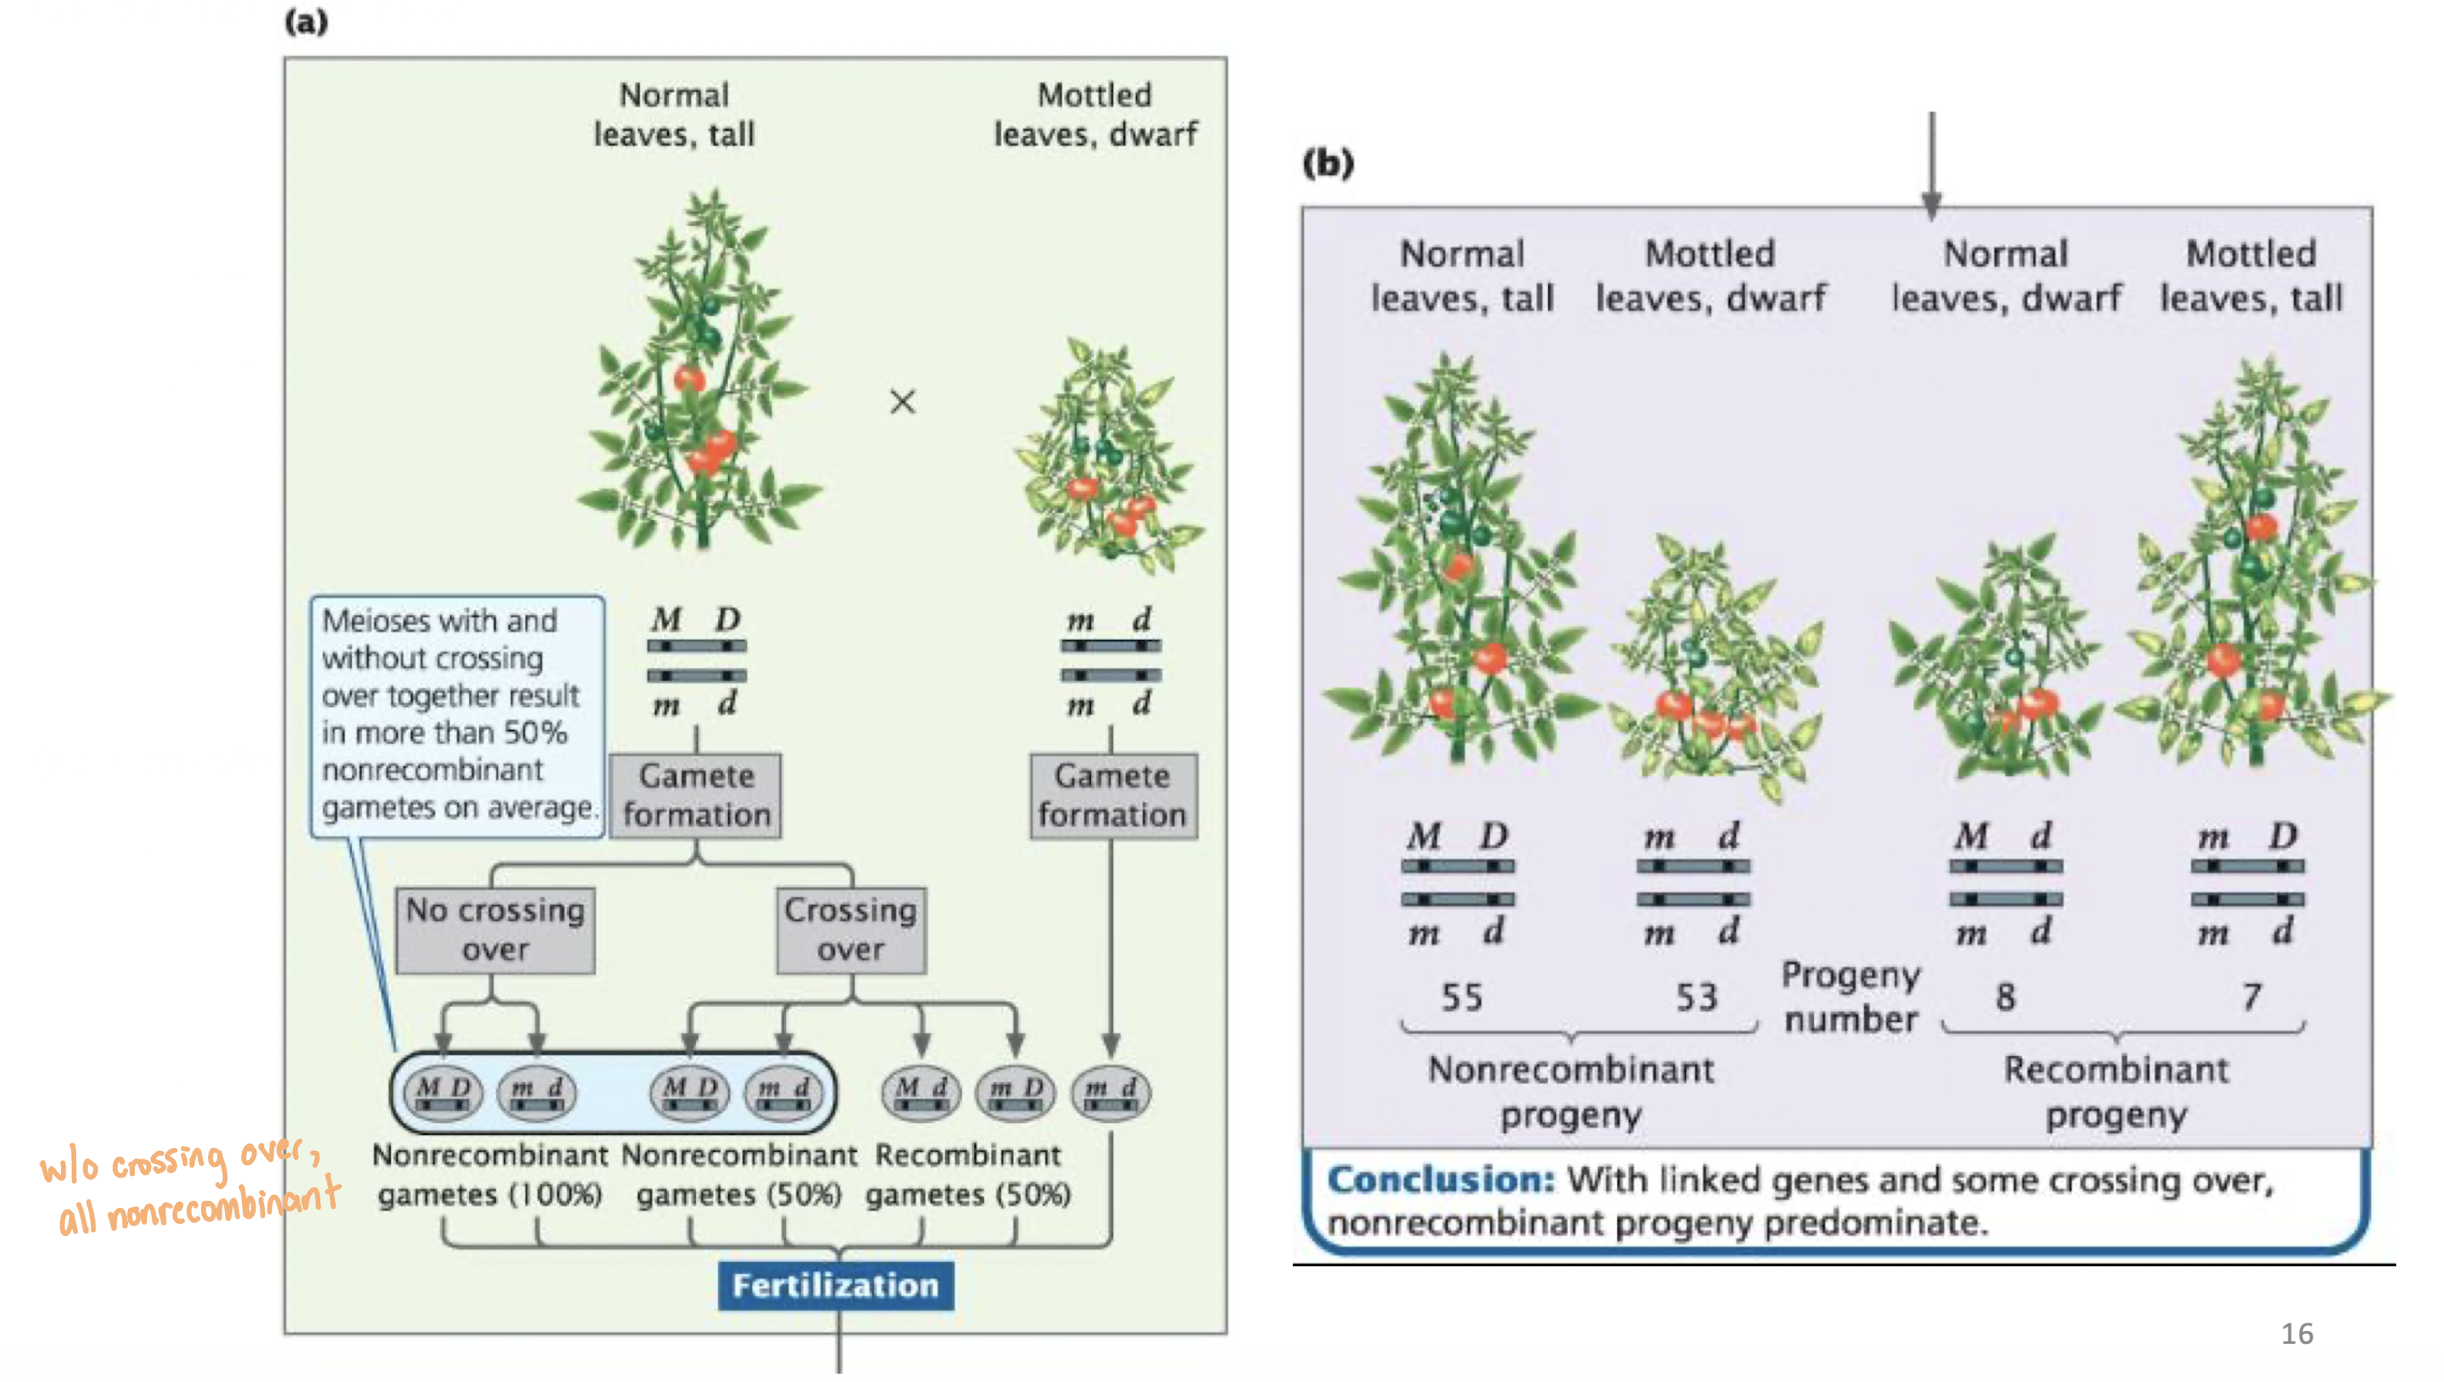
Complete Linkage
genes very close together on the same chromosome that do not cross over
Effect: only parental (nonrecombinant) gametes are produced
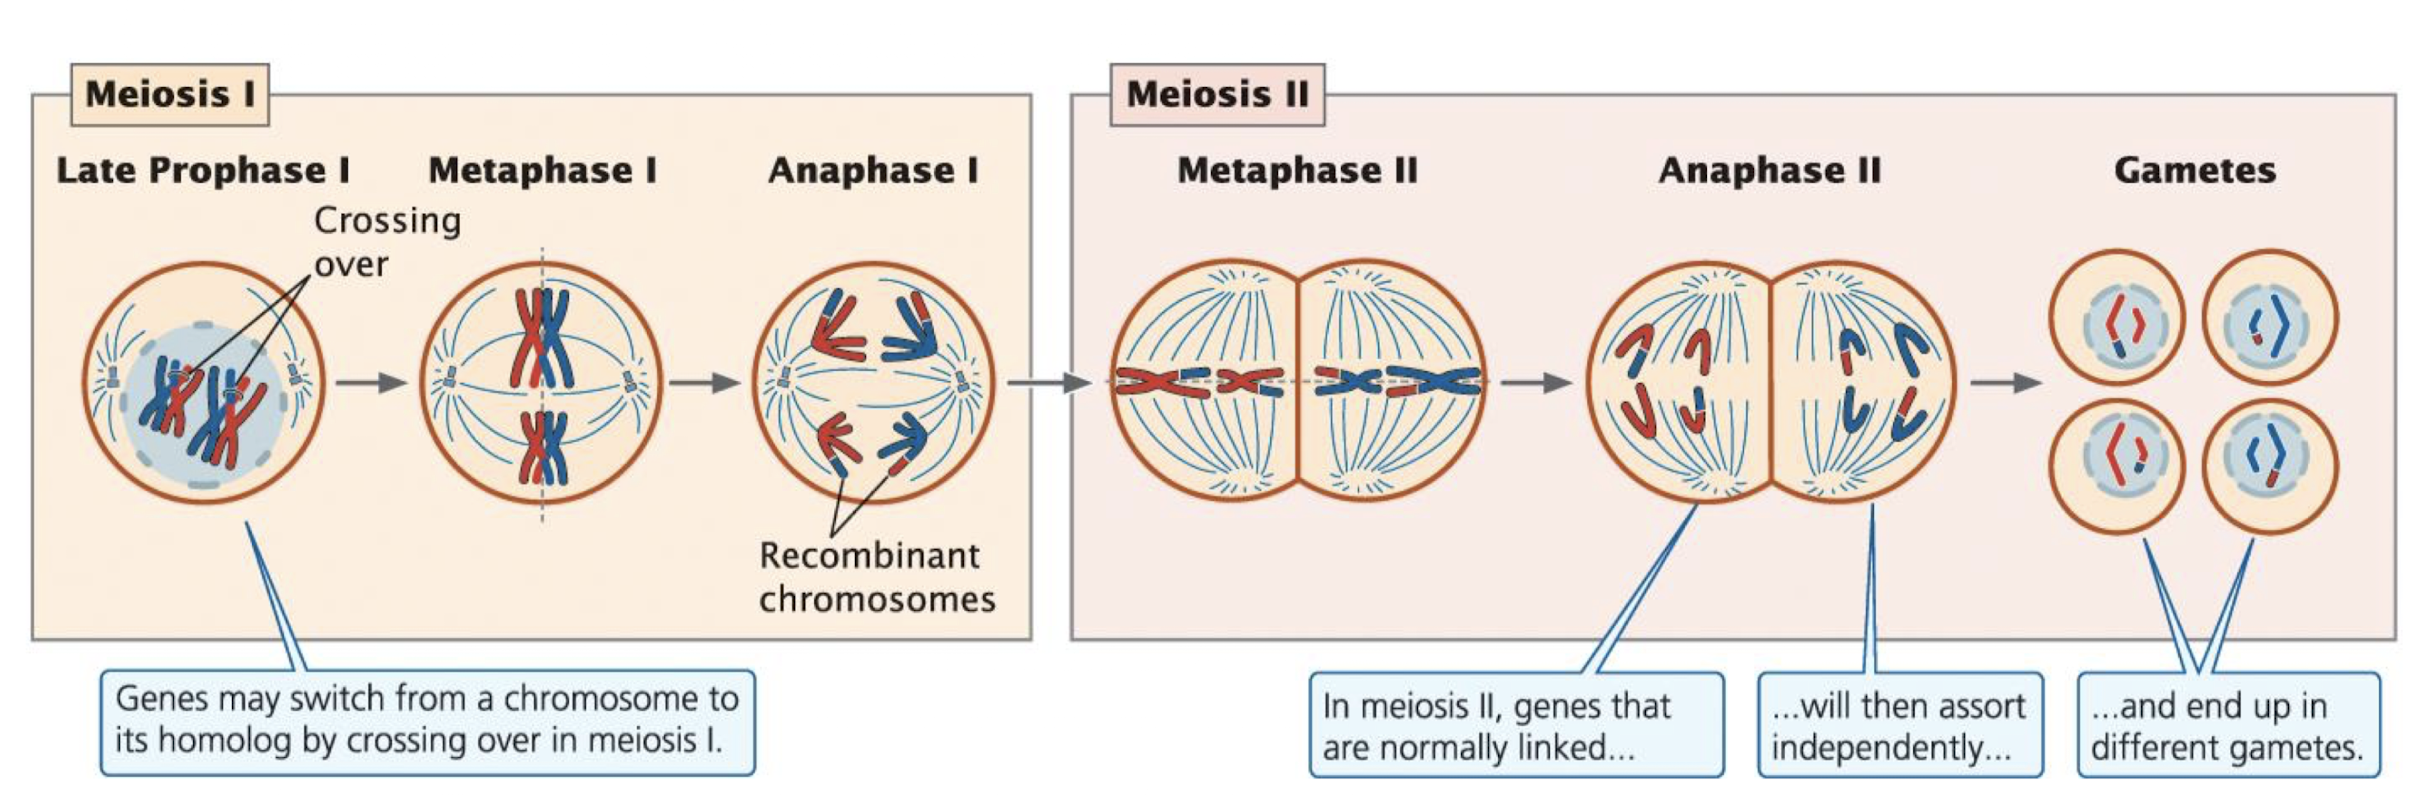
Crossing Over and Linked Genes
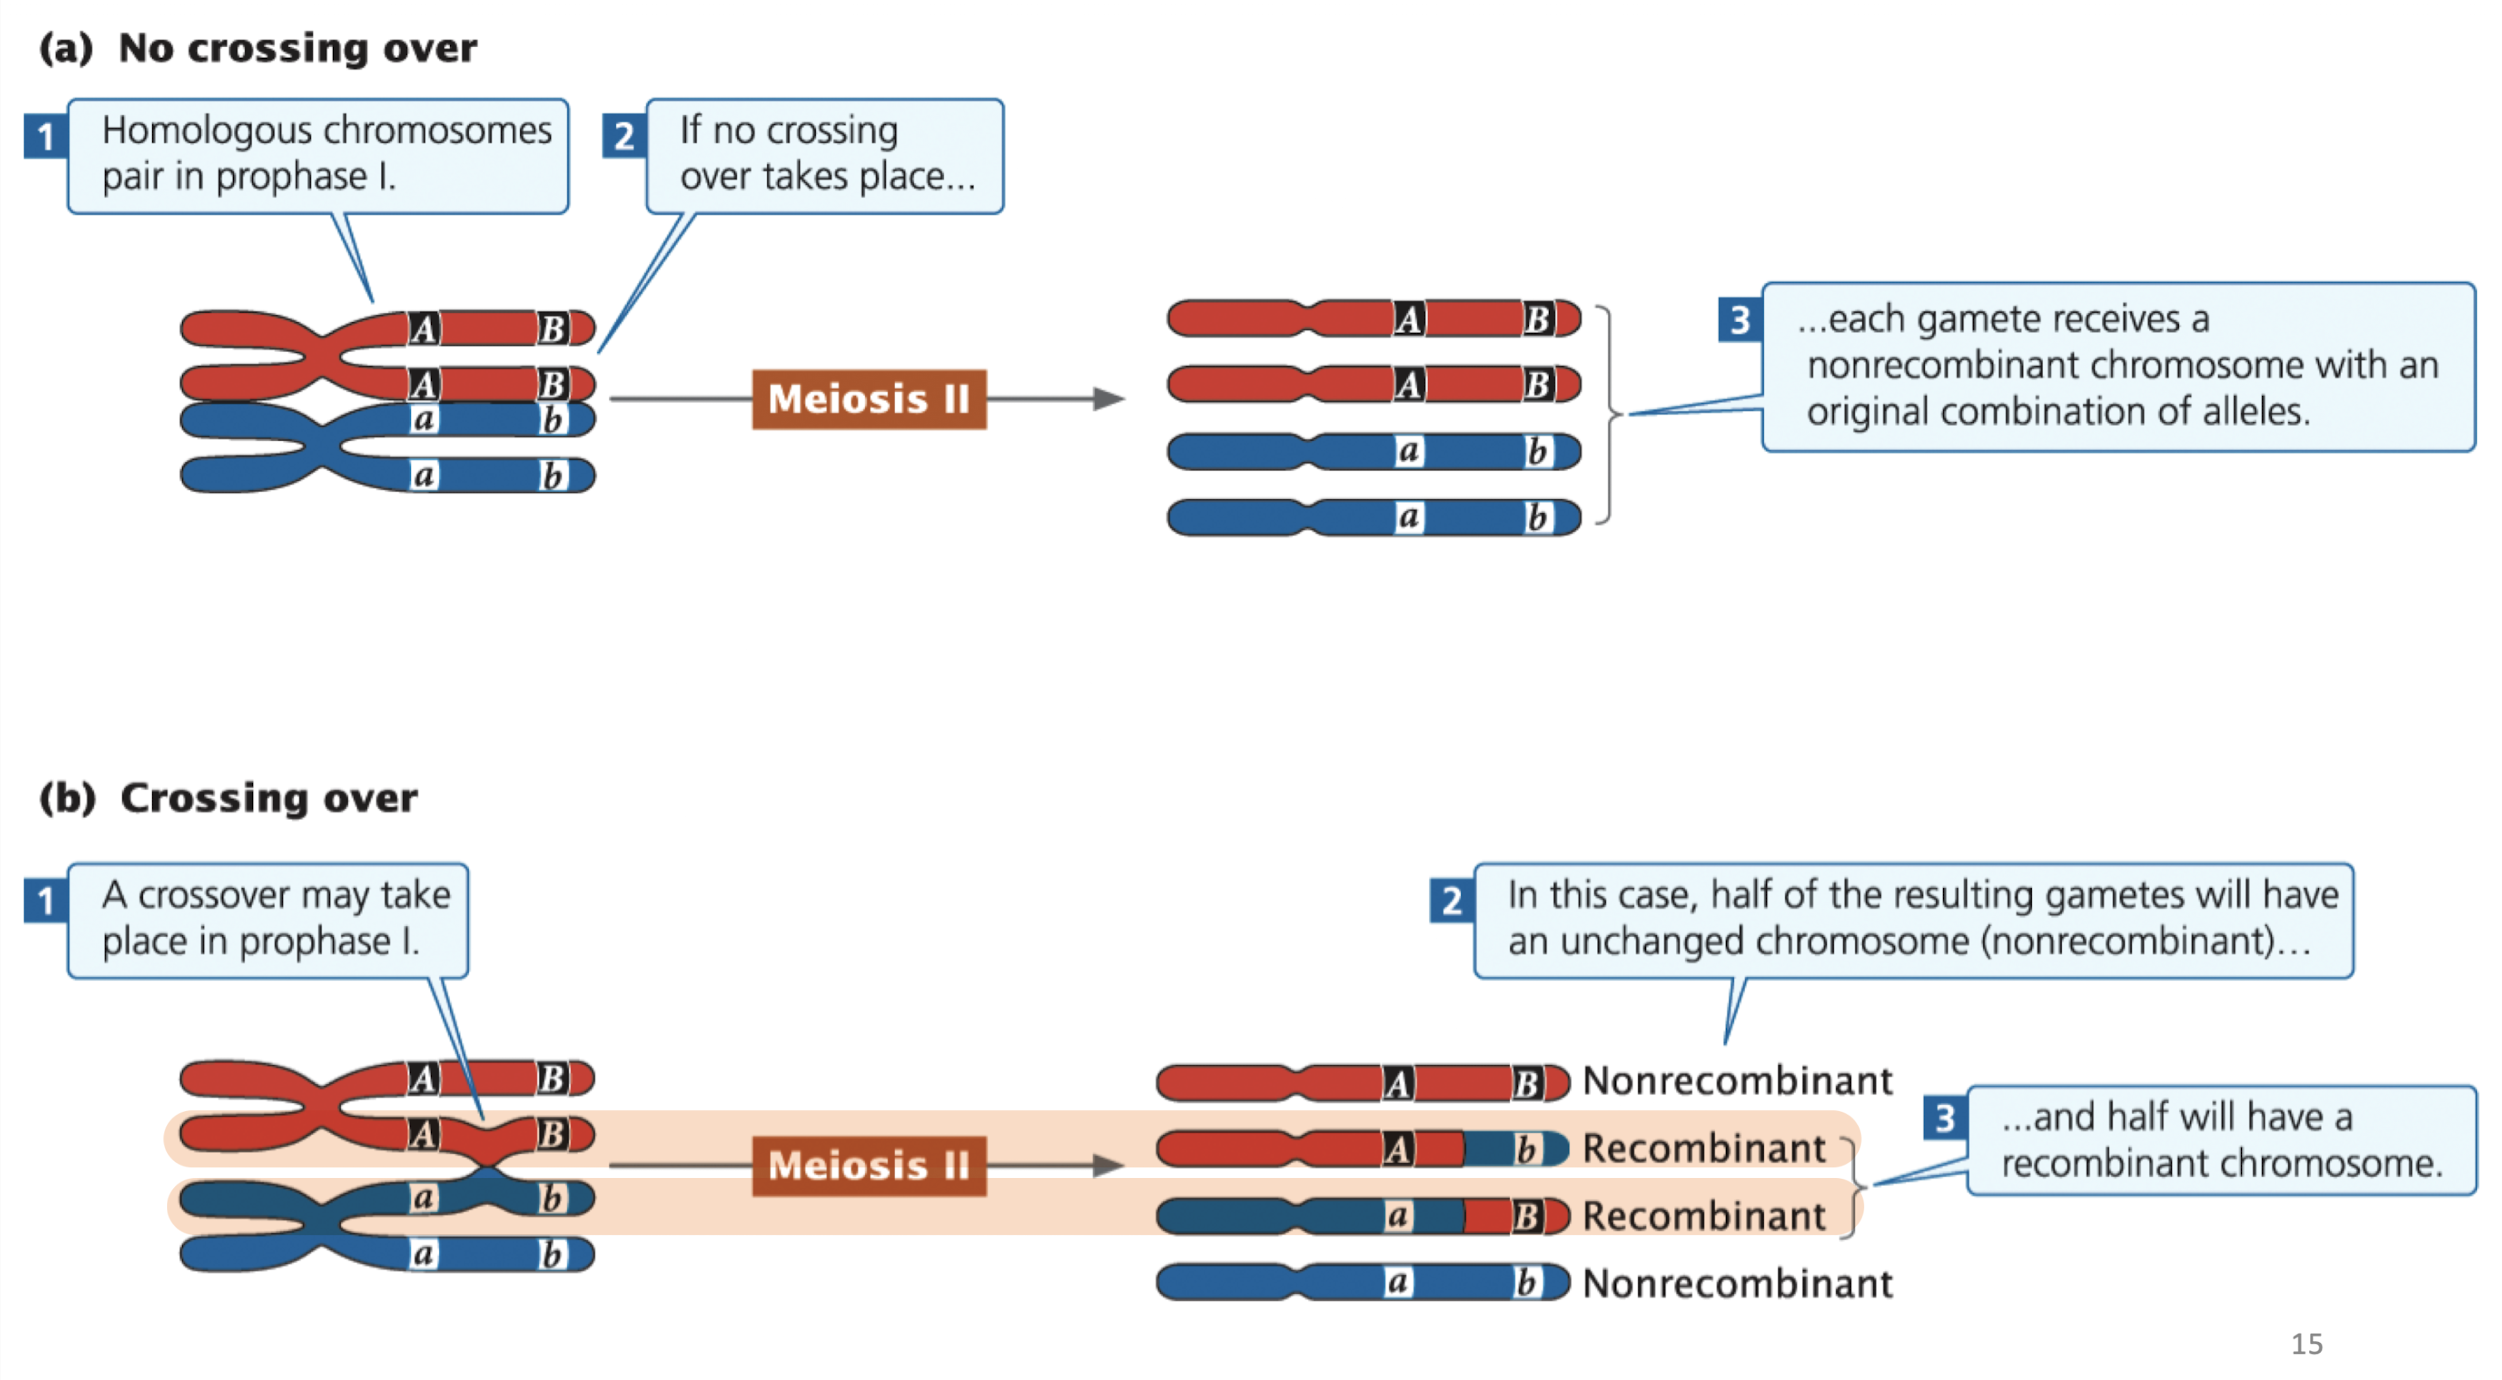
crossing over occurs during Prophase I of Meiosis: an exchange of genetc material between non-sister chromatids of homologous chromosomes
produces recombinant gametes with new combinations of alleles
With a single crossover
two chromatids remain unchanged → nonrecombinant
two chromatids exchange segments → recombinant
result: 50% nonrecombinant and 50% recombinant
only two out of four chromatids in a homologous pair are affected
Calculating Recombination Frequency
Recombination Frequency (RF): the percentage of recombinant progeny produced in a cross
Formula: RF = (Number of recombinant progeny) / (Total number of progeny) x100%
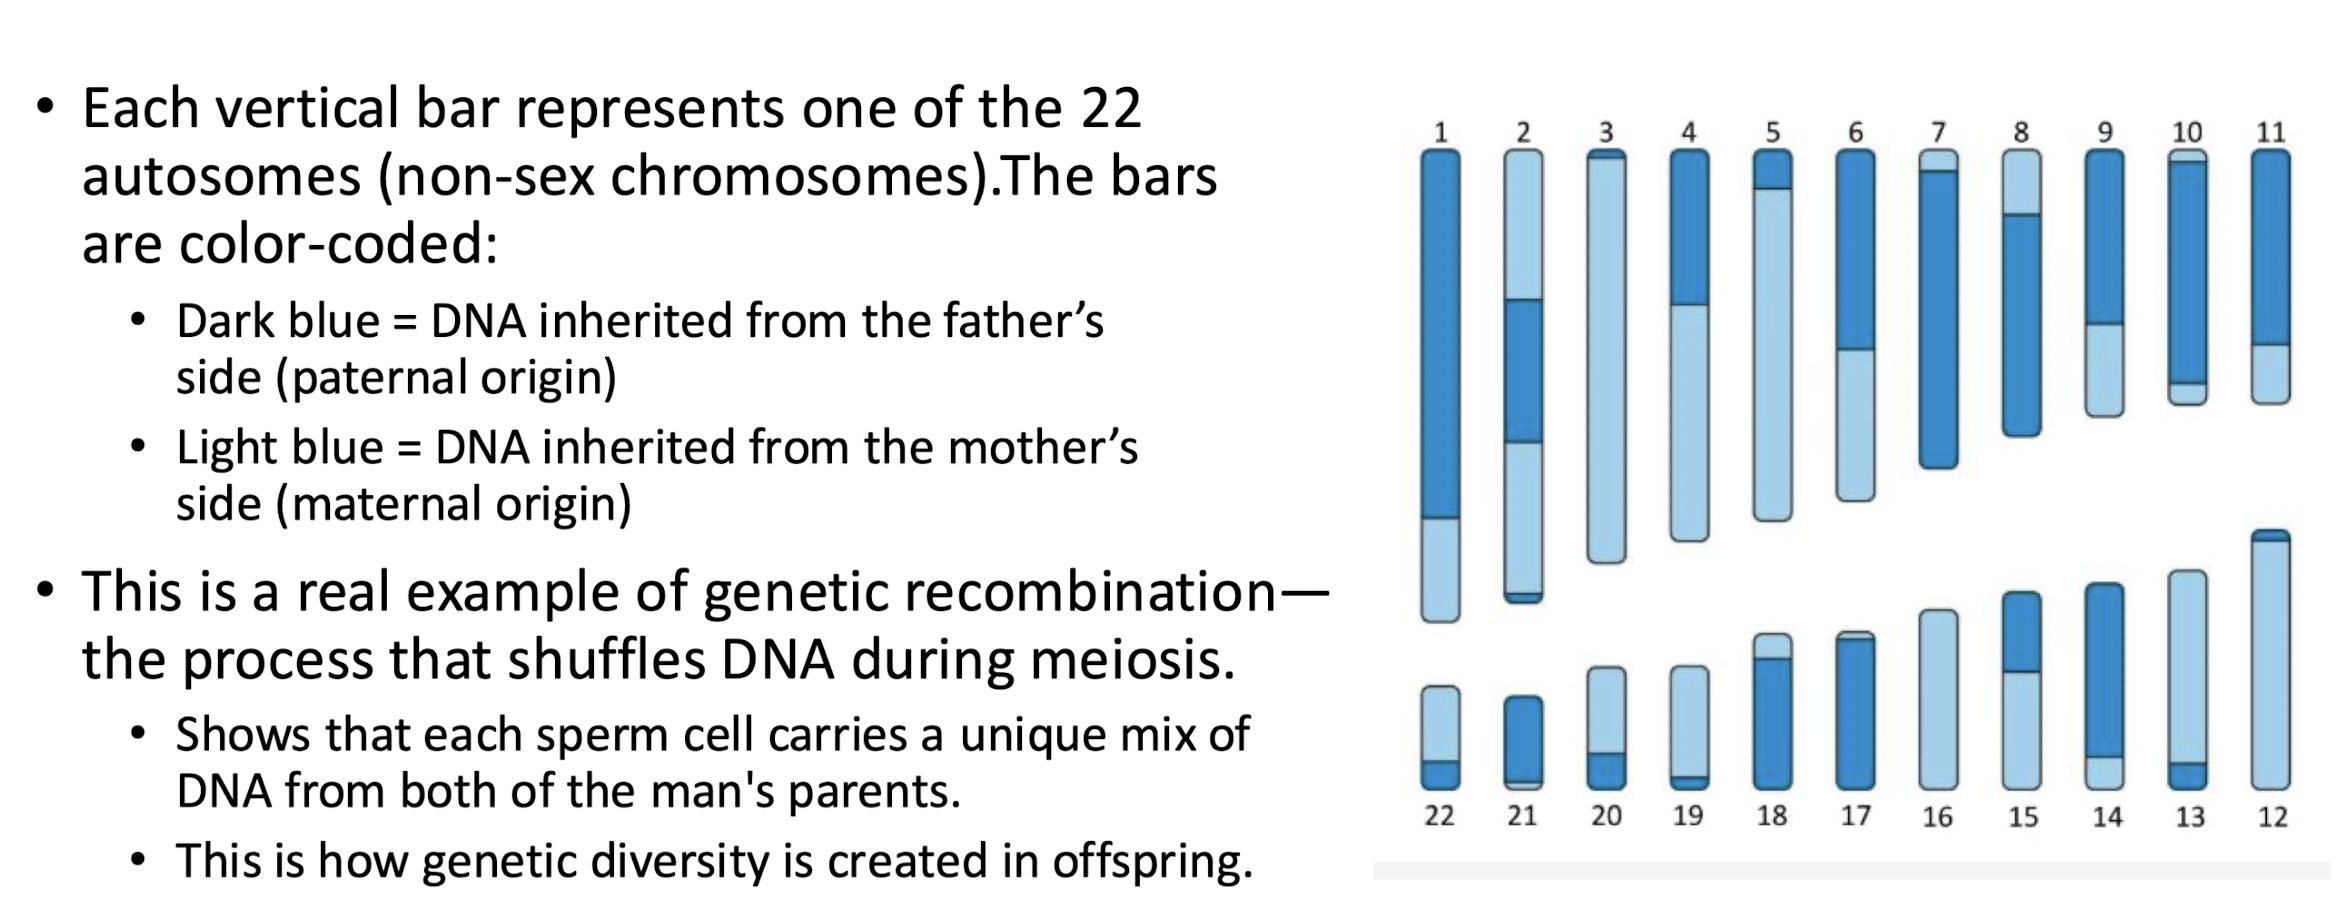
Visual Map of the Autosomes: chromosomes 1-22 from a single sperm cell
Coupling and Repulsion: Australian Blowfly example set-up
In linked genes, the arrangement of alleles on homologous chromosomes affects which phenotypes appear most often
thorax color gene (p)
p+ = green (dominant)
p = purple (recessive)
purparium color gene (b)
b+ = brown (dominant)
b = black (recessive)
Testcross carried out with heterozygote (p+p b+b) and homozygous recessive (pp bb)
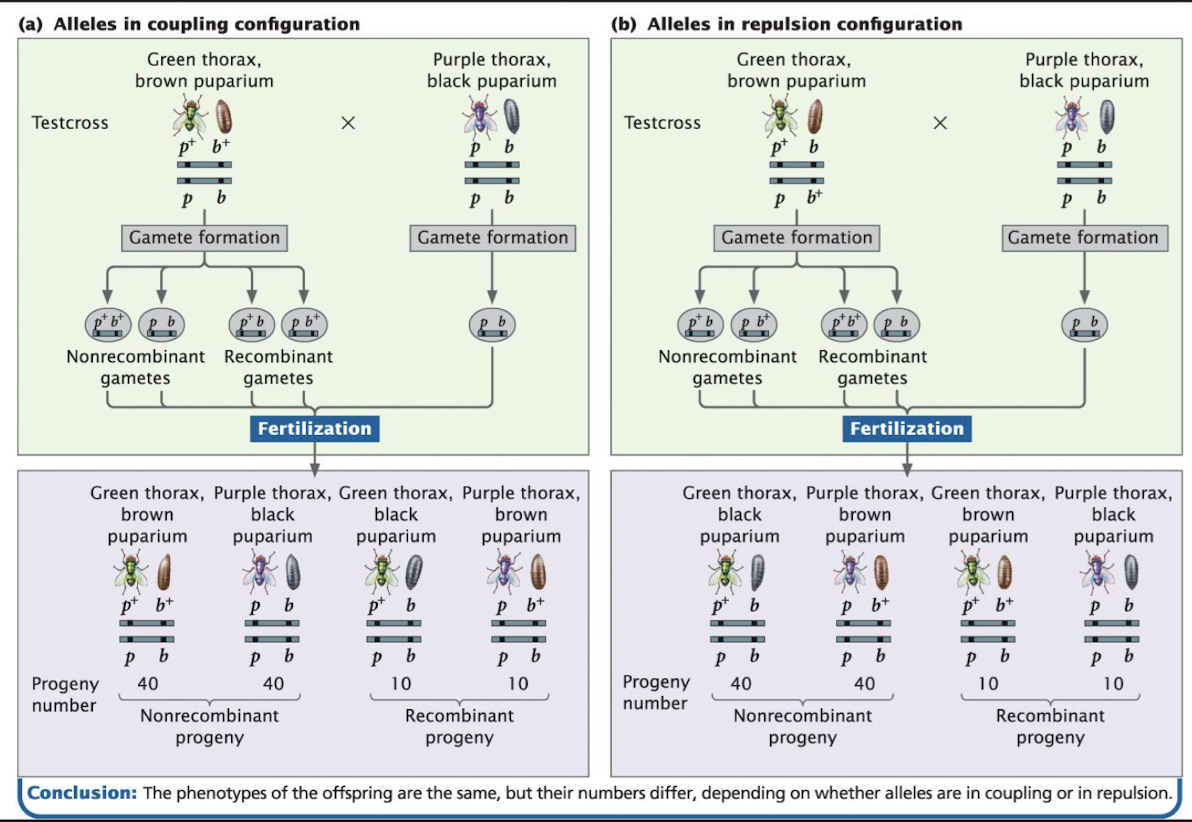
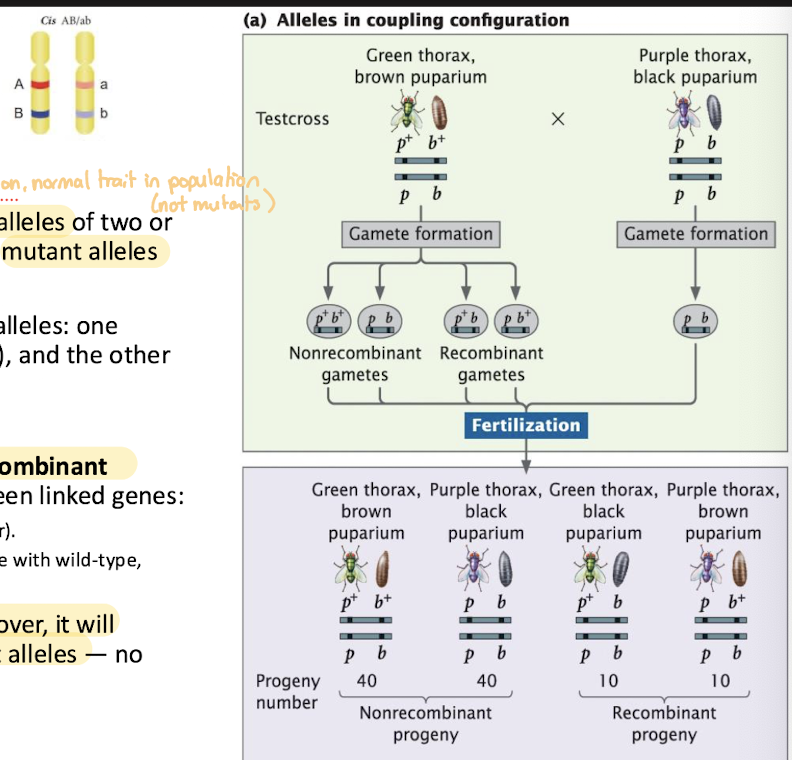
Coupling (Cis) Configuration
Arrangement of linked genes in which wild-type alleles of two or more genes are found on one chromosome and mutant alleles are on the homologous chromosome
each chromosome “carries the same type” of alleles: one chromosome has all the normal versions (wild) and the other has all the mutant versions: p+b+ / pb
most gametes will contain the original nonrecombinant (parental) because crossing over is rare between linked genes
when a gametes is produced without crossing over, it will inherit either all wild-type alleles or all mutant alleles: no mixed combinations
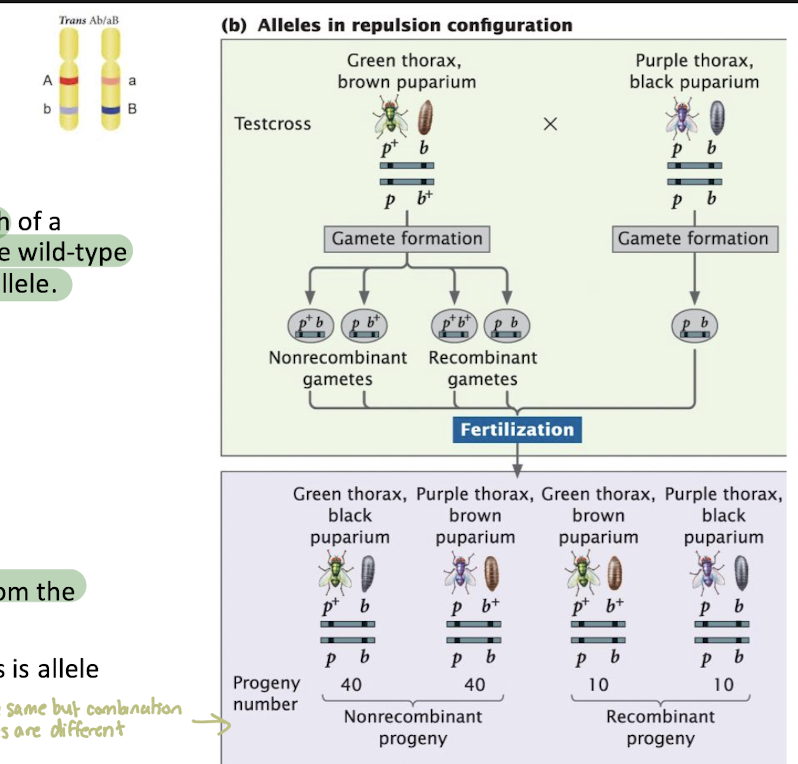
Repulsion (Trans) Configuration
Arrange of two linked genes in which each of a homologous pair of chromosomes contain one wild-type (dominant) allele and one mutant (recessive) allele
Chromosome arrangement: p+b / pb+
Most numerous offpsirng
green thorax, black puparium (p+b)
purple thorax, brown puparium (pb+)
these nonrecombinant phenotypes different from the parental phenotypes
only different between the two crosses is allele arrangement, not genotype
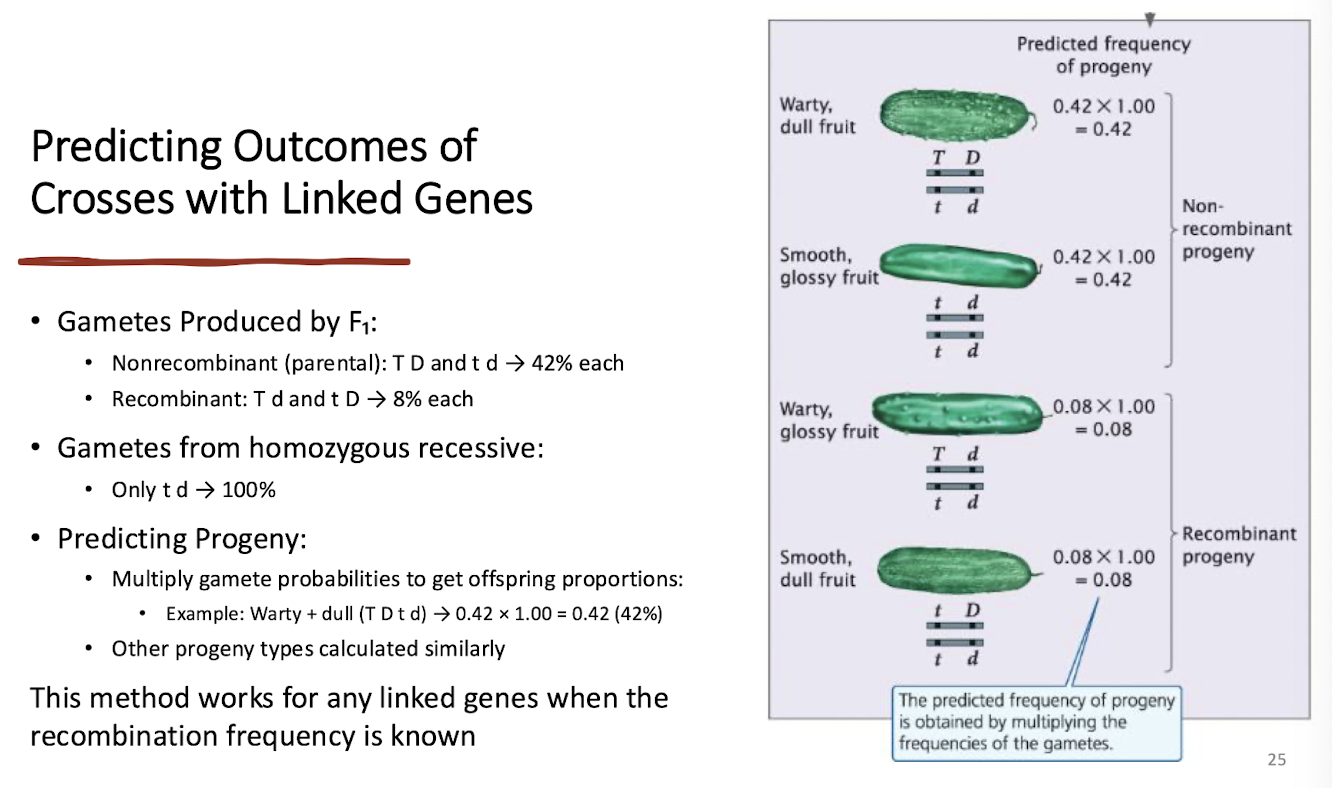
Predicting Outcomes of Crosses with Linked Genes
knowing the allele arrangement on a chromosome + the recombination frequency allows prediction of prpgeny types and proportion
Example:
if given recombination frequency of 16%, know that each recombinant gamete type is 8% each, leaving the nonrecombinant games at 42% each
can use this to predict the offspring proportions if multiple the two frequencies of the parents together
Testing for Independent Assortment
genes may appear linked or independent depending on the proportion of nonrecombinant vs. recombinant progeny
slight deviations from 1:1:1:1 ratio could be due to chance or linkage with crossing over
how to test:
calculate expected probabilities assuming independent assortment
use chi-square goodness-of-fit to compare observes v. expected numbers
Chi-Square Goodness-of-Fit Test
Test whether observed data match a predicted ratio (ex. Mendelian ratio)
STEPS:
State hypothesis (H0 (null hypothesis): observed =expected
Write the observed and expected counts
Mendel’s Laws for monohybride cross expect 3:1 phenotype ratio
E = Total Progeny x Expected Proportion
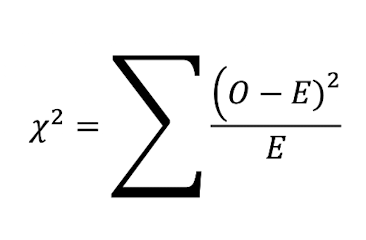
Compute Chi-Square:
Complete for each category and then add them
(Observed-Expected)2 / Expected
Find Degrees of Freedom
Number of categories - 1
Compare to the critical value, using p=0.05 and your degree of freedom
If Chi-square is SMALLER than critical value, the difference between observed and expected is NOT significant (fits Mendel ratio)
If Chi-square is LARGER than critical value, difference is significant
Limitations of the Chi-Square Goodness-of-Fit Test
a significant chi-square results tells you something is different from expectation but doesn’t tell you why
causes could be linkage, lethality, penetrance, or environmental effects
Why a deviation might have occured
Genes are linked
two loci are not independent, violating independent assortment
expected single-locus ratios are correct
some genotypes may have lower survival
incomplete penetrance: not all individuals with the genotype show the phenotype
environmental factors or smpling errors can also affect ratios
Chi-Square Test of Independence
To test whether two traits are inherited independently (Mendel’s second law) or they are linked
STEPS:
Carry out a testcross between individuals differing in two characteristics (would be given this, the observed ratio)
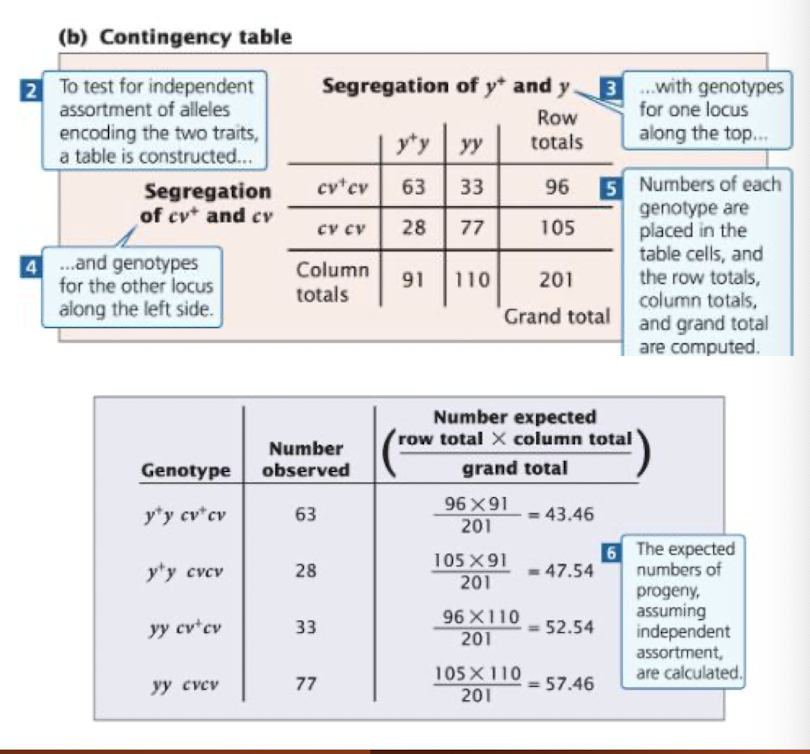
Construct a contingency table
place one trait’s genotypes along the top and other trait’s genotypes along the side
fill in observed counts for each cell and compute row totals, column totals, and grand total
Calculate expected values
For each cell E = (Row Total x Column Total) / Grand Total
Compute Chi-Square for each cell
Complete for each category and then add them
(Observed-Expected)2 / Expected
Determine Degrees of Freedom (# rows -1) x (# columns -1)
Compare to critical value and interpret
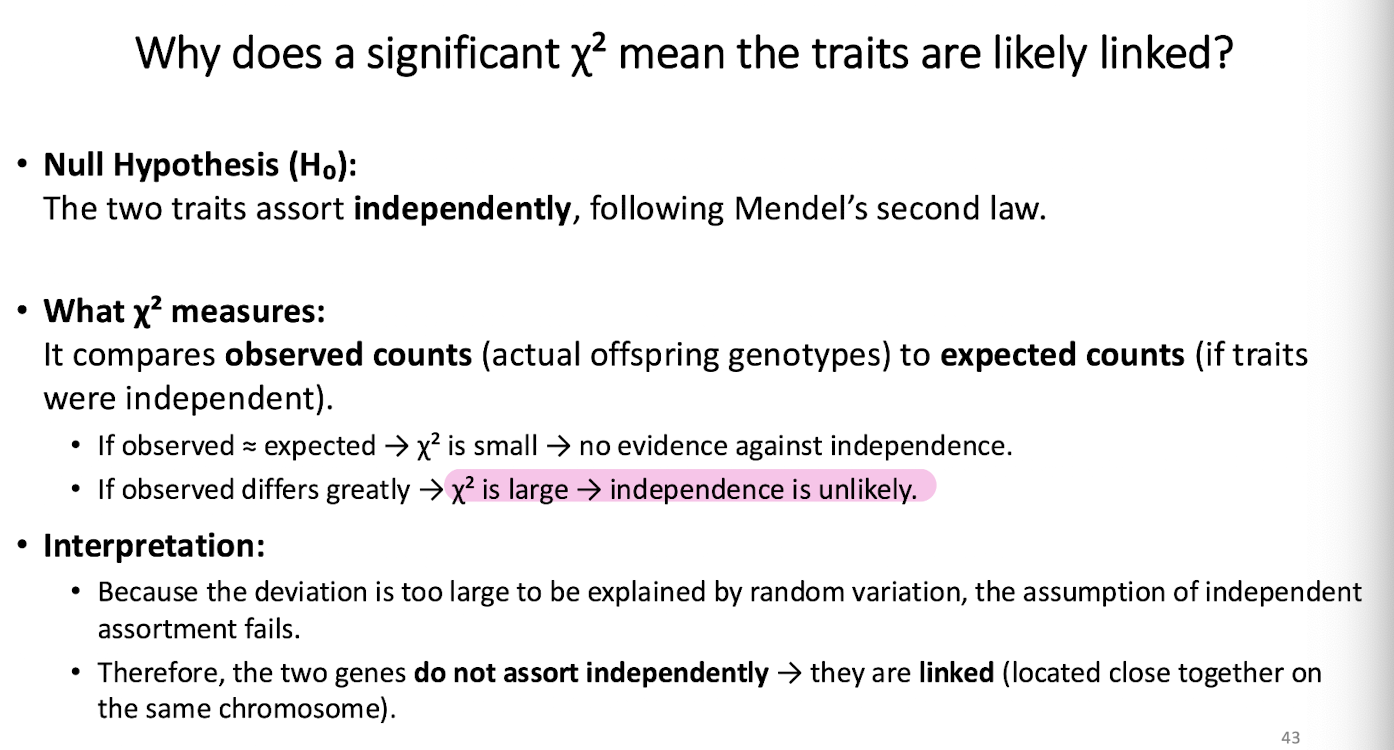
If chi-square is GREATER than critical value, there is a signficant difference and traits are NOT sorting independently (likely linked)
Hypothesis of Chi-Square Test of Independence
Null Hypothesis (H0)
two traits sort independently according to Mendel’s second law
there is no associate between trait 1 and trait 2
knowing the genotype for one trait does not change the probability of the other trait
X has no effect on Y
Alternative Hypothesis (Ha)
the two traits do NOT sort independently
there is an association between trait 1 and trait 2
knowing the genotype for one trait changes the probability of the other trait
X influences Y, the traits are likely linked
Genetic Maps
discovered by Thomas Hunt Morgan and students, found that recombination frequencies reflect the physical distances between genes on a chromosome
genes far apart are more likely to recombine than genes close together
Genetic Maps: Map of the relative differences between genetic loci, markers, or other chromosome regions determined by rates of recombination; measures in recombination frequencies or map units
Map units (m.u. or cM): units of measure for idstances on a genetic map; also called a centiMorgan (cM)
1 map unit = 1% recombination rate
Physical Maps: Map of physical distances between loci, genetic markers, or other chromosome segments; measured in base pairs. Units: Megabases (MB), actual DNA length
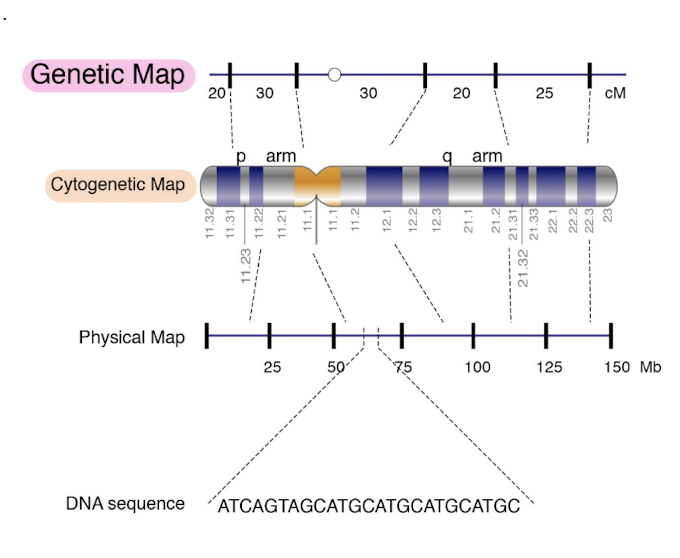
Genetic Map v. Cytogenetic Map v. Physical Map
Genetic Map
units: centiMorgans (cM) which measure recombination frequency
shows the relative positions of genes based on how often they recombine during meiosis
do NOT indicate physical length
Cytogenetic Map
visual representation of the chromosome under a microscope
shows
p arm (short arm) and q arm (long arm)
bands (dark and light regions) created by staining techniques
labels like 11.32, 11.31, 12.1, 21.1 which correspond to band positions using karyotyping
Physical Map
units: Megabases (Mb), actual DNA lenth
shows the physical distance in base pairs between genes or markers
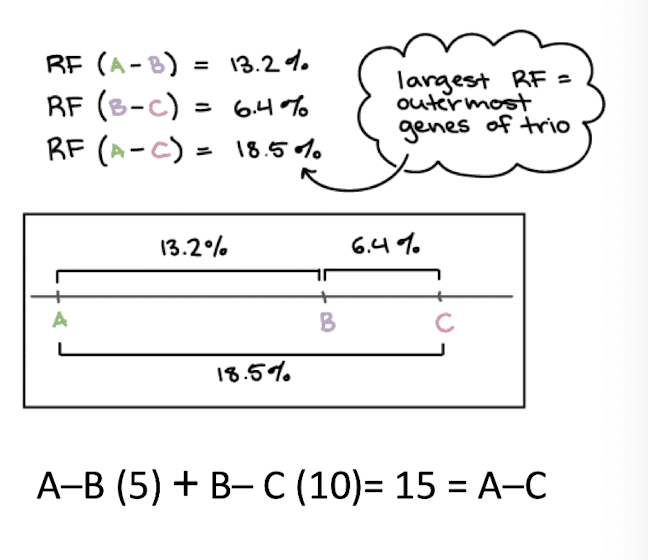
Mapping: Pairwise recombination frequencies and gene order
when mapping genes on a chromosome, we often only have pairwise recombination frequencies (RFs): the percentage of offspring showing recombination between two genes
smaller RF: genes closer together
larger RF: genes farther apart
Mapping: Identify the two genes at the ends
Largest RF always occurs between the two genes at the ends of the segment, because recombination is additive along the chromosome
Mapping: Identify the middle gene
remaining gene must lie between the two ends (the ones that had largest recombination frequency)
we cannot tell if B is closer to A or C beyond what the RFs show, but additive rule confirms its in-between
Constructing Genetic Maps: adding a fourth gene
adding a fourth gene (D) requires examining RFs between D and existing genes
highest RF indicates genes that are furthest apart
Limits and Considerations in Genetic Mapping
50% Recombination Limit
when two genes show 50% recombination, we cannot tell whether
they are on different chromosomes (unlinked)
they are on same chromosome but very far apart
genes that are far apart of the same chromosome behave as if they are unlinked bc crossing over occurs so frequently that parental and recombinant gametes are produced equally
Double Crossovers
Def: two crossover events occur between the same two genes
Effect: the second crossover reverses the effect of the first, restoring the og parental combination of alleles
Consequence for mapping:
some recombinant events go undetected, leading to underestimation of the true distance between genes
Frequency: rare, but double crossovers are more likely when genes are far apart
Two-Point Testcrosses for Gene Mapping
Cross between an individual heterozygous at two loci and an individual homozygous for recessive alleles at those loci
STEPS:
Identify linked genes
find all instances where the RF < 50%
RF tells us the distance of the linkage group
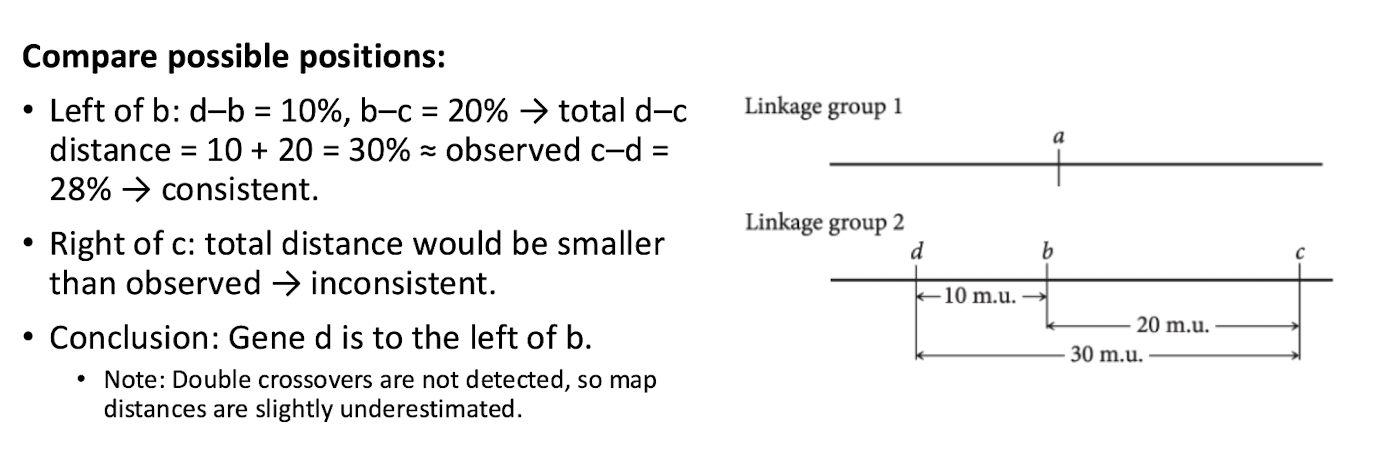
Compare Possible Positions
Try positions until find the one where RFs in action are consistent with determined RFs
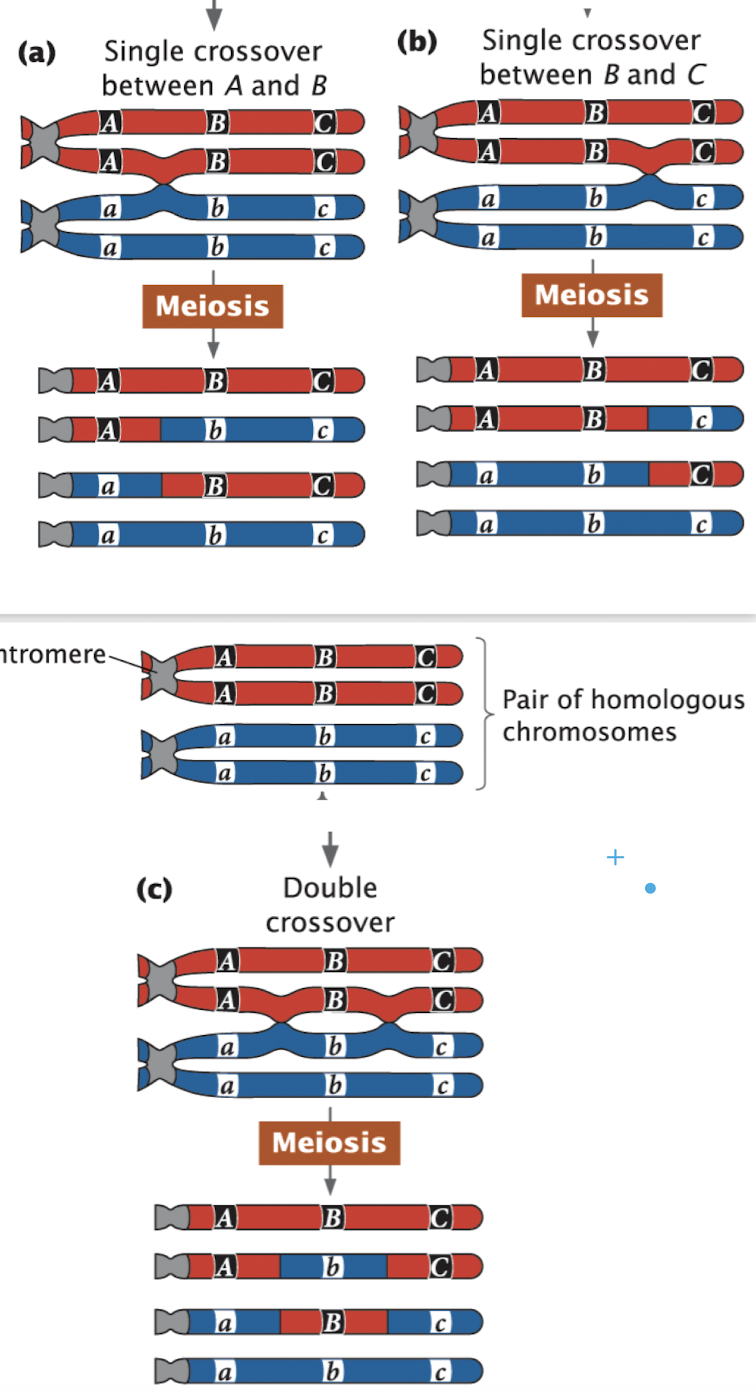
Crossover Types
Genotype: Aa Bb Cc (heterozygous at 3 loci)
Coupling Configuration:
Chromosome 1: ABC (all dominant alleles)
Chromosome 2: abc (all recessive alleles)
Single Crossover
produces 2 recombinants and 2 nonrecombinants
Double Crossover (crossover between A&B and B&C)
produces 2 recombinants and 2 nonrecombinants
only the middle gene changes compared to nonrecombinants (making it harder to detect on a two-point cross)
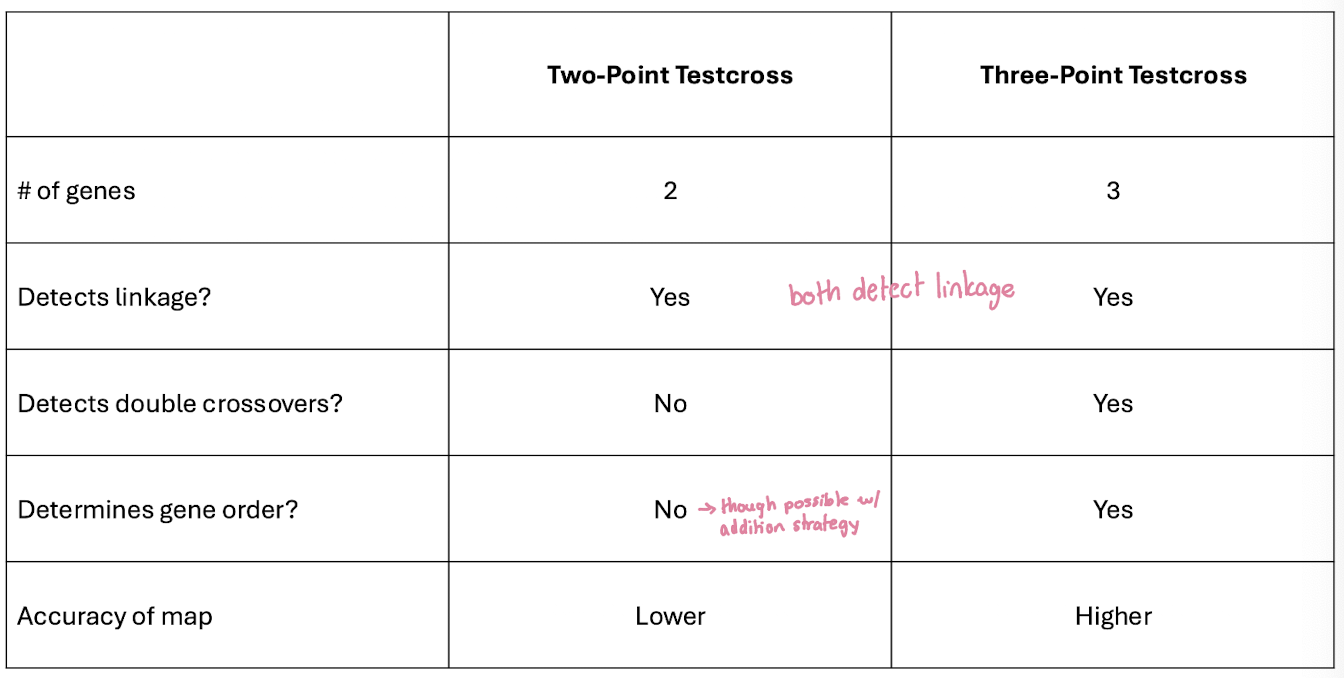
Why Use a Three-Point Testcross?
Limitations of Two-Point Crosses
Mapping pairs of genes is inifficient
many crosses are needed to determine gene order
double crossovers often go undetected → inaccurate map distances
Three-Point Testcross Advantages
Maps three linked genes at once
detects double crossovers, providing more accurate distances
determines gene order from a single progeny set
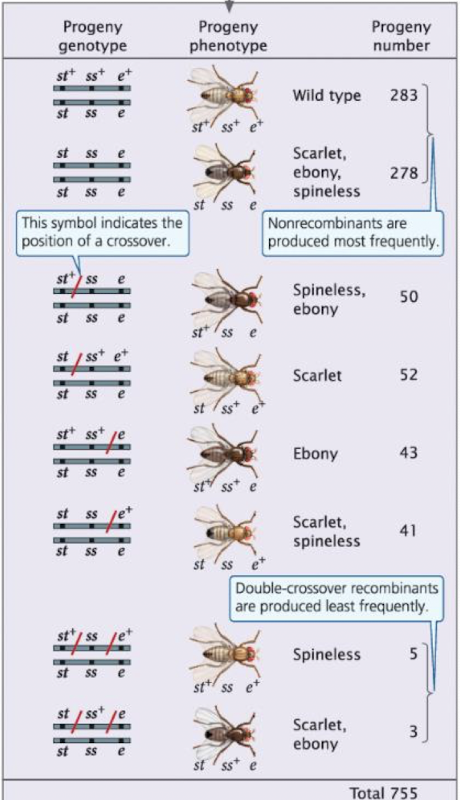
Three-Point Testcrosses for Gene Mapping
Objective: determine gene order and genetic distances for linked loci
STEPS:
Create F1 heteozygotes
Cross WT homozygotes (st+ e+ ss+ / st+ e+ ss+) x triple recessive homozygotes (st e ss / st e ss)
Get F1 heterozygotes: st+ e+ ss+ / ss e ss
Perform the testcross
Cross F1 heteozygous females with triple recessive males (when using Drosophilia bc crossing over only occurs in female Drosophilia)
Outcome: 8 possible phenotypic classses for the progeny 23=8
Interpret Testcross Progeny
all progeny express alleles from homozygous parent
recombination events in heterozygous parent determine the genetic map
rare phenotypes → indicate double crossovers and gene order
traits that appear together most frequently → nonrecombinant (parental) types
Using Three-Point Testcross Data to Map Genes
Mapping principle:
Traits that appear together most frequently → nonrecombinant types
Rare phenotypes → double crossovers reveal middle genes
use recombination frequencies to calculate map distances (m.u.)
STEPS:
Determining Gene Order
Identify nonrecombinant and recombinant types
nonrecombinant progeny → most frequent phenotypes
single crossover progeny → intermediate frequency phenotypes
double crossover progeny → rarest phenotypes
NOTE: when frequencies are relatively even (phenotypes appear at similar rates, then genes are likely not linked, either on dif chromosomes or far apart)
Test Possible Gene Orders
Three possible orders, figure out which produces the observed double-crossover progeny
For double crossover events, only the gene in the middle changes relative to the nonrecombinants
Determining Locations of Crossovers
Rewrite progeny genotypes in the correct order to identify locations of recombination events
Calculating Recombination Frequencies and Map Distances
Recombination Frequency (RF): (# of recombinant progency / total # progeny) x100
include all recombinants: single AND double crossovers
RF % = m.u.
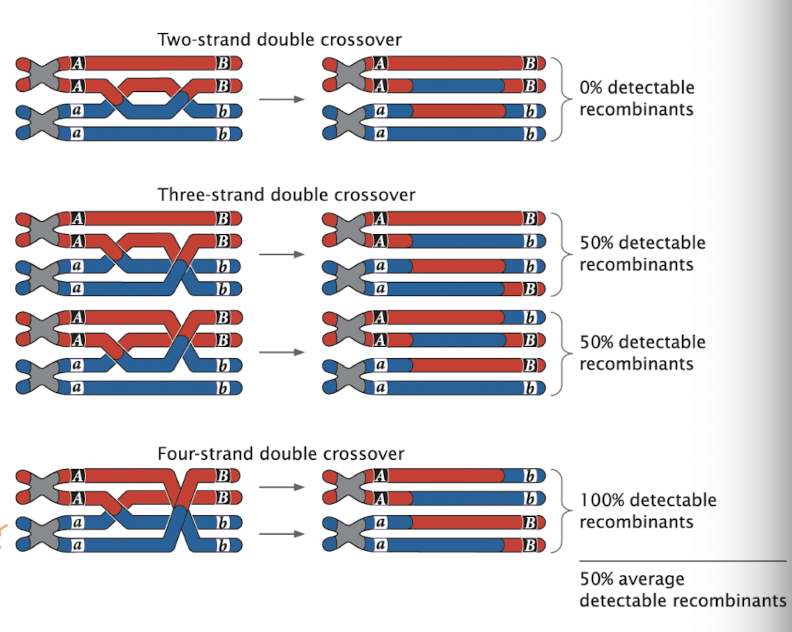
Effects of Multiple Crossovers
Double crossovers can involve different numbers of chromatids
Two-strand double crossover: only 2 of 4 chromatids swap: 0% recombinant gametes
Three-strand double crossover: 3 chromatids swap: 50% recombinant gametes
Four-strand double crossover: all 4 chromatids swap: 100% recombinant gametes
ends up with similar result of one crossover event
Notes:
not all double crossovers create new allele combinations
average effect of all double crossovers: 50% recombinant gametes
Limits of Genetic Mapping Accuracy
Undetected crossovers
some multiple crossovers produce the same gametes as single crossovers
these go unnoticed in progeny → map distances appear shorter than actual physical distances
Effect of gene distance
genes closer together: few multiple crossovers → genetic map = physical map
genes far apart: more multiple crossovers → genetic map underestimates true distance
recombination frequency plateaus at 50% even if the physical distance is much larger
Correction
Use mathematical mapping functions (based on Poisson distribution)
Estimate actual distances more accurately
Implications for Genetic Mapping: Undetected Crossovers
When we measure recombination frequency, we assume that each crossover creates a detectable recombinant gamete
Problem: multiple crossovers (ex. two crossovers between the same two genes) can restore the original allele arrangement, making it look like no crossover
Result: these events go unnoticed in progeny → we underestimate recombination frequency
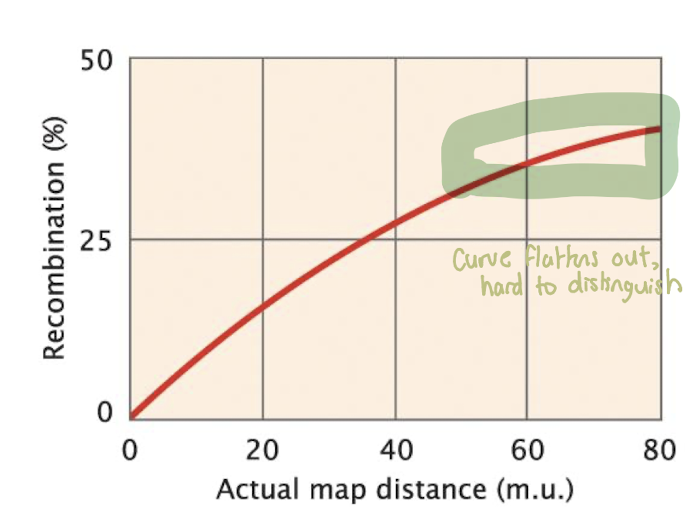
Observed v. Actual Map Distance
Recombination frequency does not increase linearly with distance
Starts proportional at short distances
Flattens near 50% because multiple crossovers restore the original arrangement
Genes far apat → recombination frequency maxes out at 50%
Cannot distinguish very distant genes from genes on different chromosomes
Result: Genetic map underestimates true physical distance
Solution: Use mapping functions to correct for undetected errors
Haplotype
A specific set of linked genetic variants or alleles on a single chromosome or on part of a chromosome
Linkage Disequilibrium
Nonrandom association between alleles in a haplotype
SNPs
A site in the genome where individual members of a species differ in a single base pair
Mapping Function
Mathematical function that relates recombination frequencies to actual physical distances between genes
The Role of Bacteria and Viruses in Our World
Bacteria and viruses are everywhere, viruses infect all organisms and are the most abundant biological entities on earth
Global Impact
Ocean bacteria produce 50% of earth’s oxygen
Remove 50% of atmospheric CO2
agriculture
Pathogens of crops and animals
Provide nutrients like nitrogen and phosphorous to plants
Human Health
Natural bacteria live in the mouth, gut, and skin, aiding digestion, immunity, and disease prevention
Many infectious diseases are caused y bacteria or viruses but can be controlled with antibiotics and vaccines
Bacteria and Viruses in Medicine and Genetics
Medical and Industrial Importance:
bacteria produce drugs, hormones, food additives, and chemicals
viruses used in gene therapy to deliver healthy genes
Genetic significance:
they have simple genetic systems = ideal for studying heredity and gene function
They share core genetic features with humans and other organisms
Studies of bacterial and viral genetics have led to:
discovery of DNA as genetic material
Gene regulation models (ex. lac operon in E. coli that allows cells to digest lactose)
Tools for biotechnology and molecular biology
Advantages of Using Bacteria and Viruses for Genetic Studies
Reproduction is rapid
Many progeny can be produced
1 and 2 together allow lots of large generations in a short amount of time
Haploid genome allows all mutations to be expressed directly
Asexual reproduction simplifies the isolation of genetically pure strains
Growth in the laboratory is easy and requires little space
Genomes are small
Techniques are available for isolating and manipulating their genes
They have medical importance
They can be genetically engineered to rpoduce substances of commercial value
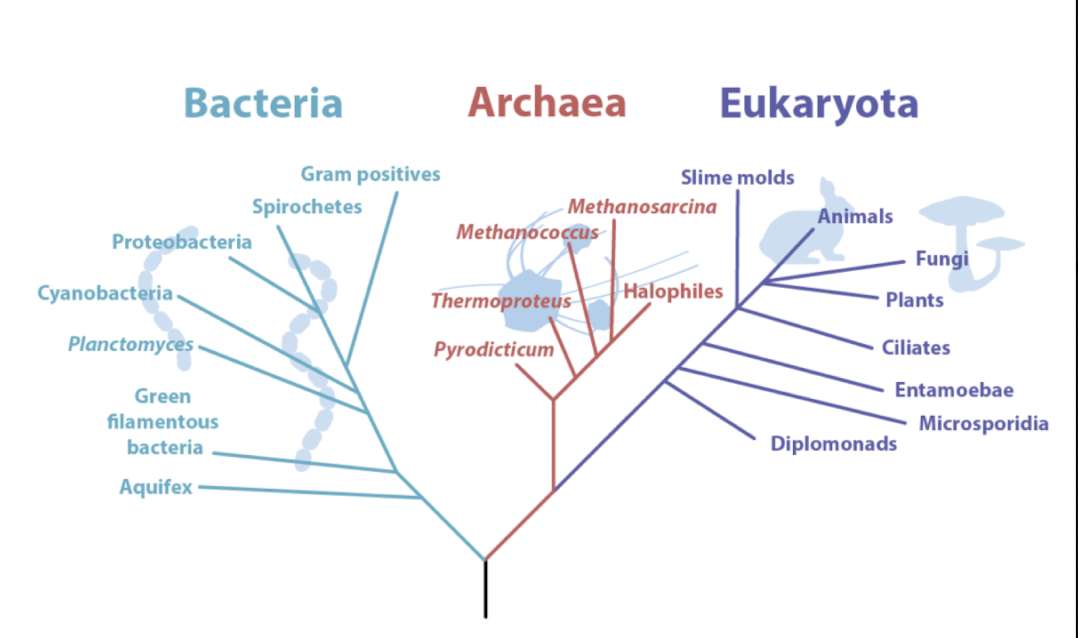
Diversity of Prokaryotes
Prokaryotes: unicellular organisms with a relatively simple cell structure. Prokaryotes include bacteria (eubacteria) and archaea
Two Main Groups:
Archaea: unicellular organisms with prokaryotic cell structure that are found in all environments
Eubacteria (Bacteria): most familiar bacterial species
Notes:
DNA sequencing of uncultured bacteria has transformed our understanding of microbiology
Bacteria and Archaea are genetically distinct from each other and bacteria/ eukaryotes are also genetically distinct
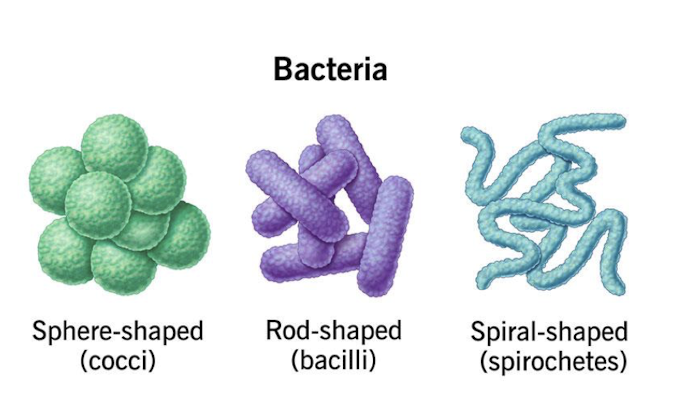
Bacterial Shapes and Sizes
Bacteria exhibit a wide variety of shapes
Cocci (spherical)
Bacilli (rod-shaped)
Spirilla (helical)
Size varies greatly: many are very very small but a few are visible to the naked eye
Bacterial Structures
Functional Diversity!
Photosynthetic bacteria capture sunlight and produce oxygen
Spore-forming bacteria survive extreme conditions
resistant to heat, cold, radiation, drought, chemicals, etc
Stalks or filaments superficially resemble fungi
Stalks allow bacteria to anchor to surfaces, like rocks, plant roots, or sediments in aquatic environments, which allow them to stay in nutrient-rich environments
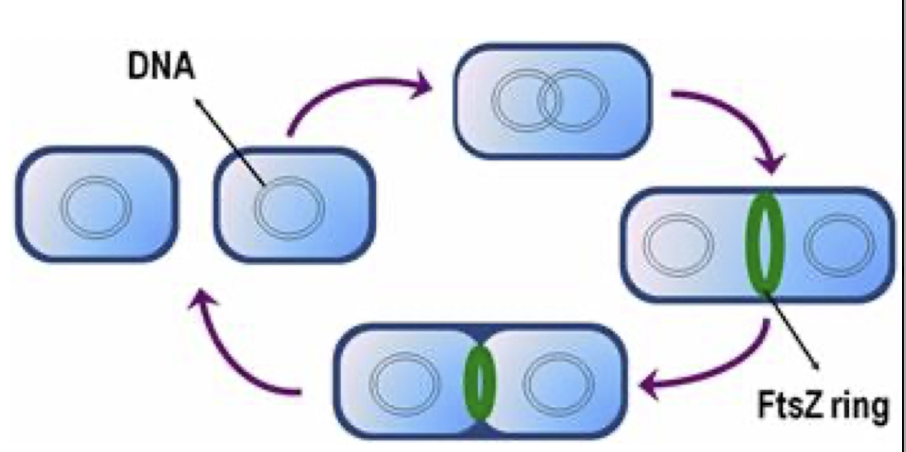
Bacterial Complexity
Proteins like FtsZ help bacterial cell division, similar to eukaryotic tubulin in mitosis
Bacteria have proteins that:
Condense DNA (Like histones in eukaryotes)
Maintain cell shape and cytoskeletal support
Chromosome replication is coordinated with cell division, ensuring each daughter cell receives one copy of the genome (an exact copy)
NOTE: Bacteria have round DNA, don’t have the crossing over we’re used to, so the FtsZ ring helps separate bacteria (bacteria cannot just to cytokinesis)
Studying Bacteria Genetically
Bacterial heredity is similar to other organisms, but:
they are haploid (only one copy of each gene)
cells are tiny, making phenotypes hard to observe directly
Implication: scientists must use special lab techniques to study their genetics
Key tool: Culture media: nutrient mixtures that allow bacteria to grow under controlled conditions
Growing and Analyzing Bacteria: Types of Media
Minimal medium: only nutrients required by wild-type (prototrophic) bacteria
Complete medium: includes all nutrients needed for growth, including supplements for mutants (auxotrophs)
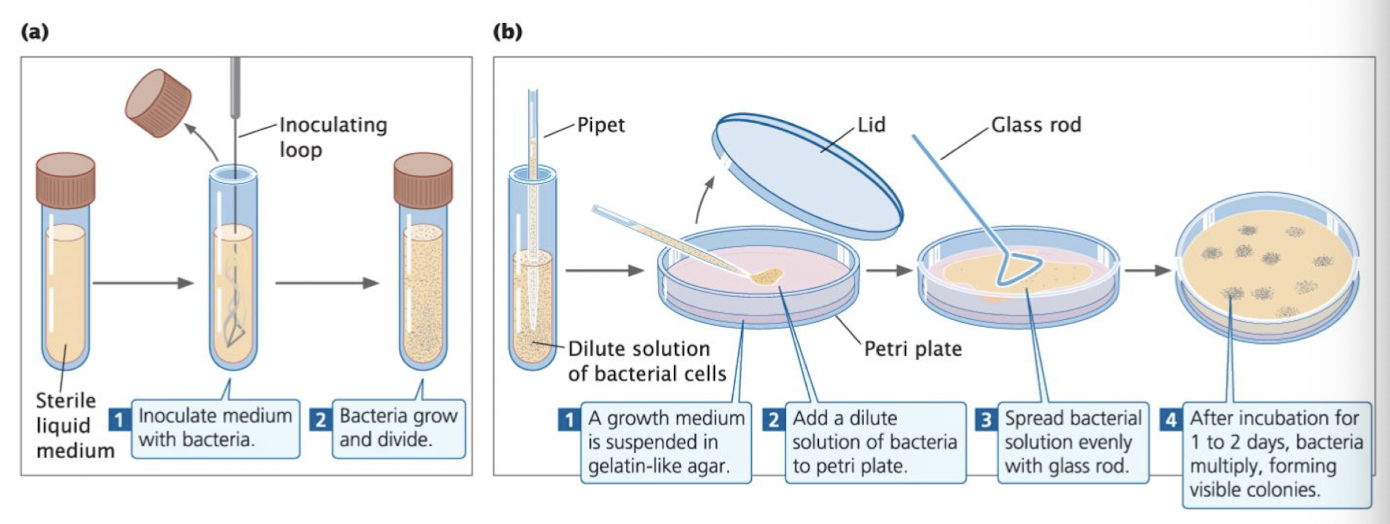
Growing and Analyzing Bacteria: Growth Methods
Broth culture: liquid medium in sterile test tubes
Agar plates: solid medium poured into Petri dishes
Growing and Analyzing Bacteria: Plating
Spread bacteria on agar → each cell grows into a colony (genetically identical)
Colonies allow scientists to isolate pure strains and count individual bacteria
Studying Bacterial Phenotypes
Microbiological study bacterial phenotypes: traots that can be onserved or detected chemically
Colony appearance: color, shape, texture
Observing phenotypes helps identify mutant strains for further genetic study
phenotypes can be difficult to tell apart
only works if phenotypes are visible to the human eye
Auxotrophs
Auxotrophs are mutant bacteria that have lost the ability to make a specific compound that they need to live, so much acquire that nutrient from environment
Comparison with wild-type (prototrophs)
Wild-type bacteria: can grow on minimal medium because they make all necessary nutrients
Auxotrophs: require supplemented medium to provide missing nutrients
Allows scientists to identify missing genes and study metabolic pathways
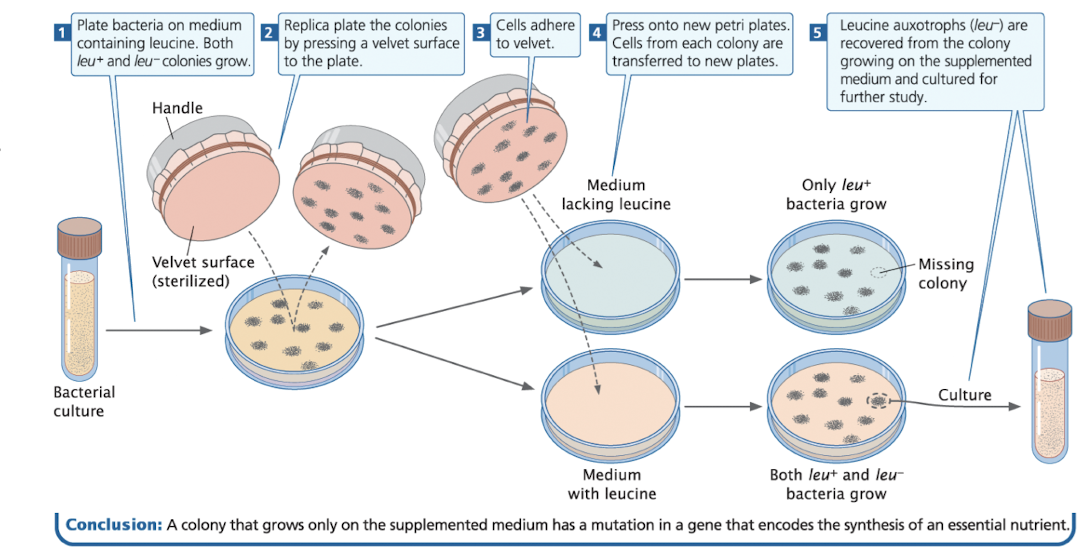
Auxotroph Example: Detecting Leucine Auxotrophs
Spread bacteria on medium containing leucine → both wild-type (leu+) and mutant (leu-) grow
Use replica plating to transfer colonies to:
Plate with leucine (supplemented medium)
Plate without leucine (selective medium)
Compare growth:
leu+ bacteria grow on both plates
leu- mutant grow only on supplemented medium
Colonies that grow only in the supplemented medium are leucine auxotrophs and can be cultured for further study
Modern Genomic Methods in Bacterial Research
Genomic methods: isolate and analyze DNA sequences from bacteria
Key advantage: can study bacteria that cannot be grown in the lab
Insights gained from genomics:
Bacterial diversity: discover new species and strains
Bacterial evolution: track how bacteria change over time
Gene organization: see how genes are arranged on the chromosome
Gene function: understand what different genes do
Complements traditional methods like colony observation and replica plating, giving a more complete picture of bacteria genetics
The Bacterial Genome
bacteria are unicellular and lack a nuclear membrane
most bacterial genomes are single, circular chromsomes of double-stranded DNA
Example: E. coli: 4.6 million base pairs
some bacteria have multiple chromsomes
vibrio cholerae: 2 circular chromosomes
rhiobium meliloti: 3 chromosomes
rare cases have linear chromosomes
protein-coding DNA
90% of bacterial DNA encodes proteins (E. coli)
Only 1% of human DNA encodes proteins
Vibrio cholerae
two circular chromosomes are double-stranded DNA loops
each chromosomes carries different sets of genes, which together provide all the information the bacterium needs to survive and cause disease (cholerae)
having multiple chromosomes can allow for specialization of gene functions and faster adaptations
each chromosome may carry distinct functions, for example: one for essential metabolic functions, another for symbiosis with plants, and another for accessory functions
Plasmids
Small, usually circular DNA molecule that is distinct from the bacterial chromosome
Plasmids replicate independently of the bacterial chromosome
Can be single-copy or multiple-copy per cell (even if only have 1 chromosome, can have many plasmids)
Not essential for survival, but can:
promote gene transfer between bacteria
carry antibiotic resistance genes
aid in genetic engineering
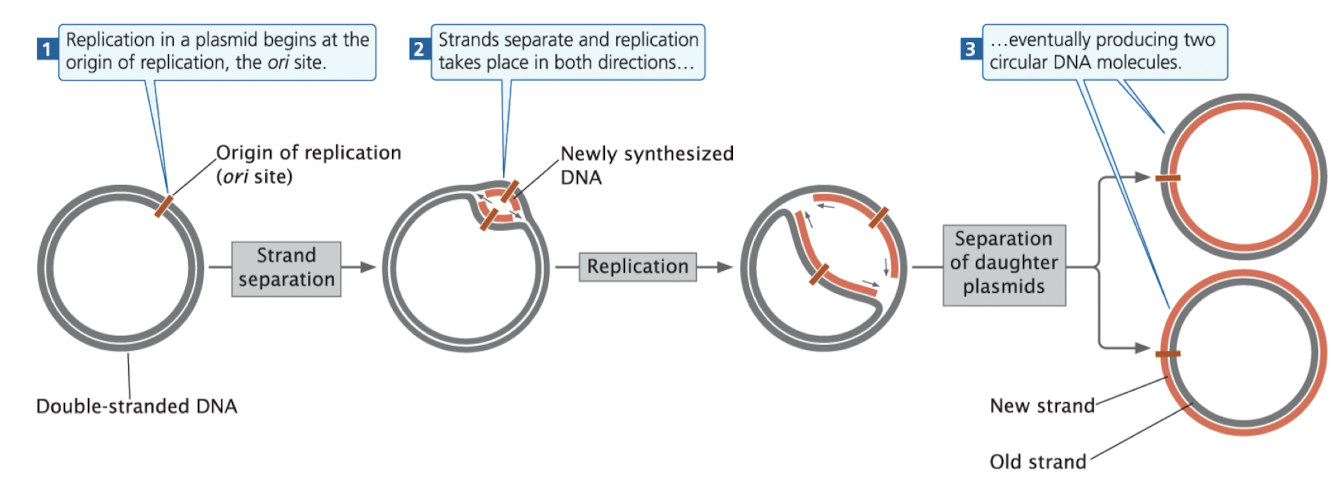
Plasmid Replication
replication begins at the origin of replication (ori)
DNA strands separate, and replication proceeds around the circle
results in two daughter plasmids, each with one new and one old DNA strand
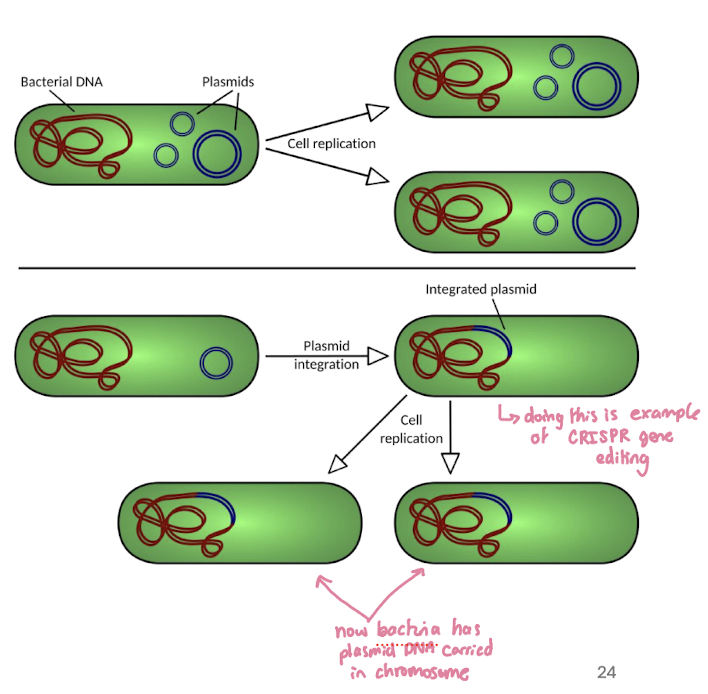
Episomes
Episomes: plasmid cpable of replicating freely and able to integrate into a bacterial chromosome
like retroviruses, episomes can integrate their DNA into the host genome
however, episomes are bacterial DNA, note viral RNA, and don’t need reverse transcriptase (unless engineered in labs)
both systems show how DNA can move between “extra” DNA elements and chromosomes
Episomes
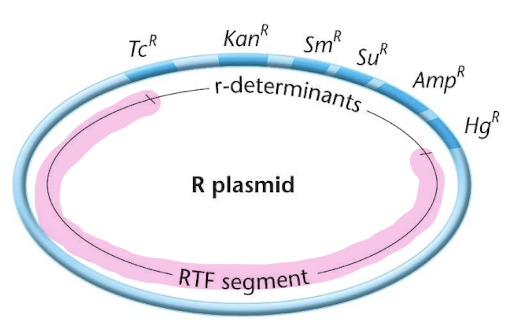
Example: R Plasmid (Resistance Plasmid)
An R plasmid is a plasmid that carries genes for antibiotic resistance
Like other episomes it can exist independently in the bacteria cytoplasm or integrate into the bacteria chromosome
r-determinants
these are genes that confer resistance to various antibiotics and toxic substances
‘in the image, the resistance genes are labeled TcR: resistance to tetrocycline
RTF segment (Resistance Tranfer Factor)
this segment contains genes necessary for plasmid replication and transfer between bacteria
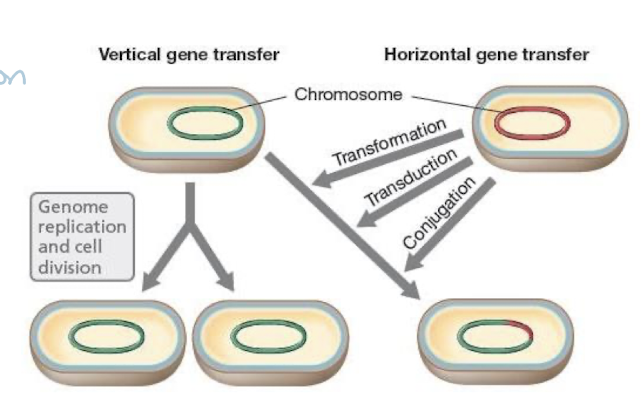
Gene Exchange in Bacteria
genetic exchange in common in bacteria and contributes to evolution
all mechanisms involve:
DNA transfer
recombination with the recipient chromosome
Three mechanisms:
Transformation: uptake of DNA from the environment
Transduction: DNA transfer via bacteriophages (viruses)
Conjugation: direct transfer from donor to recipient
Transformation
Bacterium takes up naked DNA from the surrounding medium
Transferred DNA can recombine with the bacterial chromosome
Can create recombinant bacteria with new traits
Transformation frequency varies among species; lab techniques can increase uptake
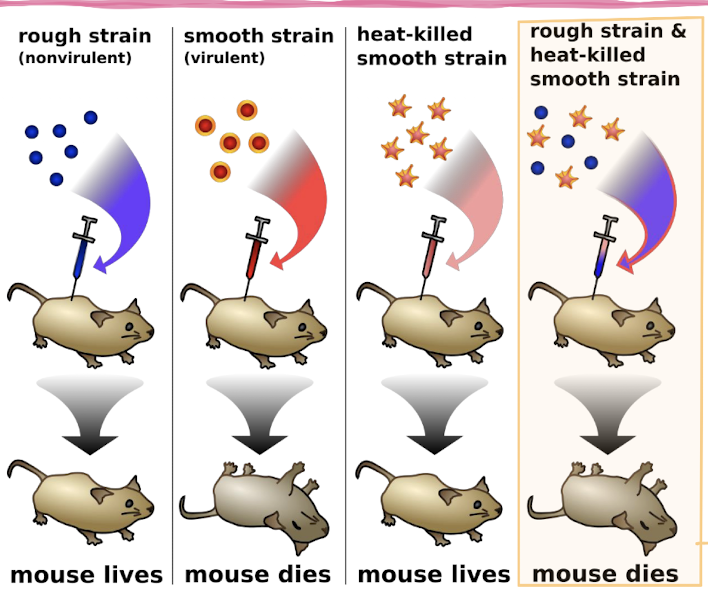
Famous Bacterial Transformation Experiment
Frederick Griffith (1879-1941) was a British bacteriologist who is famous for his classic experiment in 1928 demonstrating bacterial transformation
S strain: smooth, virulent (causes disease)
R strain: rough, non-virulent (does not cause disease)
He killed S strain bacteria by heat and mixed them with live R strain bacteria
Some R strain bacteria “transformed” and became virulent S strain, causing those mice to die
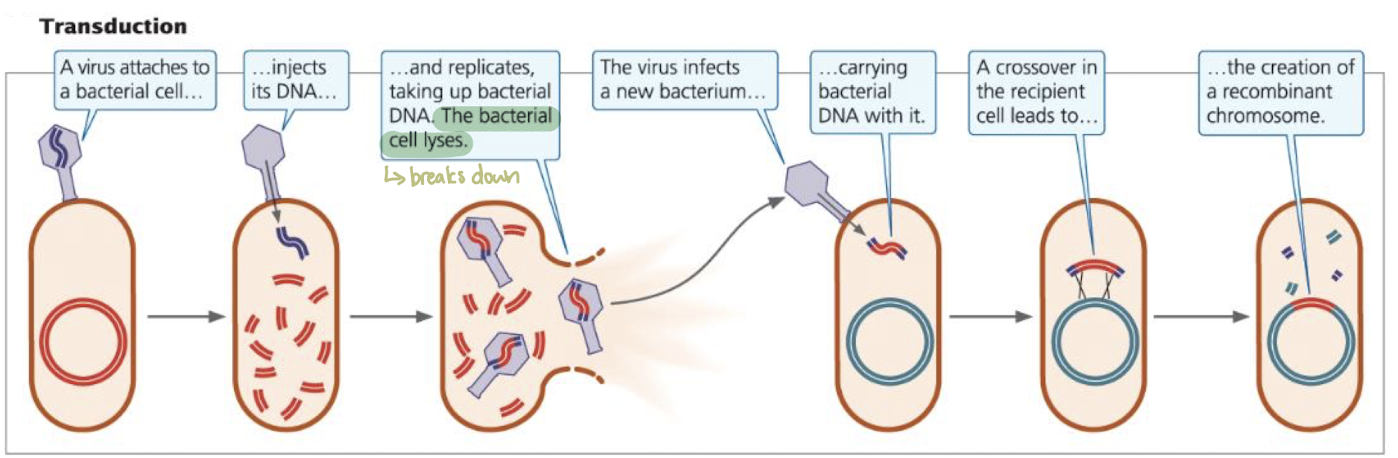
Transduction
bacteriophage infects a donor bacterium, accidentally packaging bacterial DNA → take up some bacterial DNA
bacterial chromosome is sometimes partially broken down to make nucleotides for replicating viral DNA
Virus infects a new bacterium, delivering recombinant DNA
Recombination can creat recipient bacteria with new genes
Host range limits transduction to same or closely related species
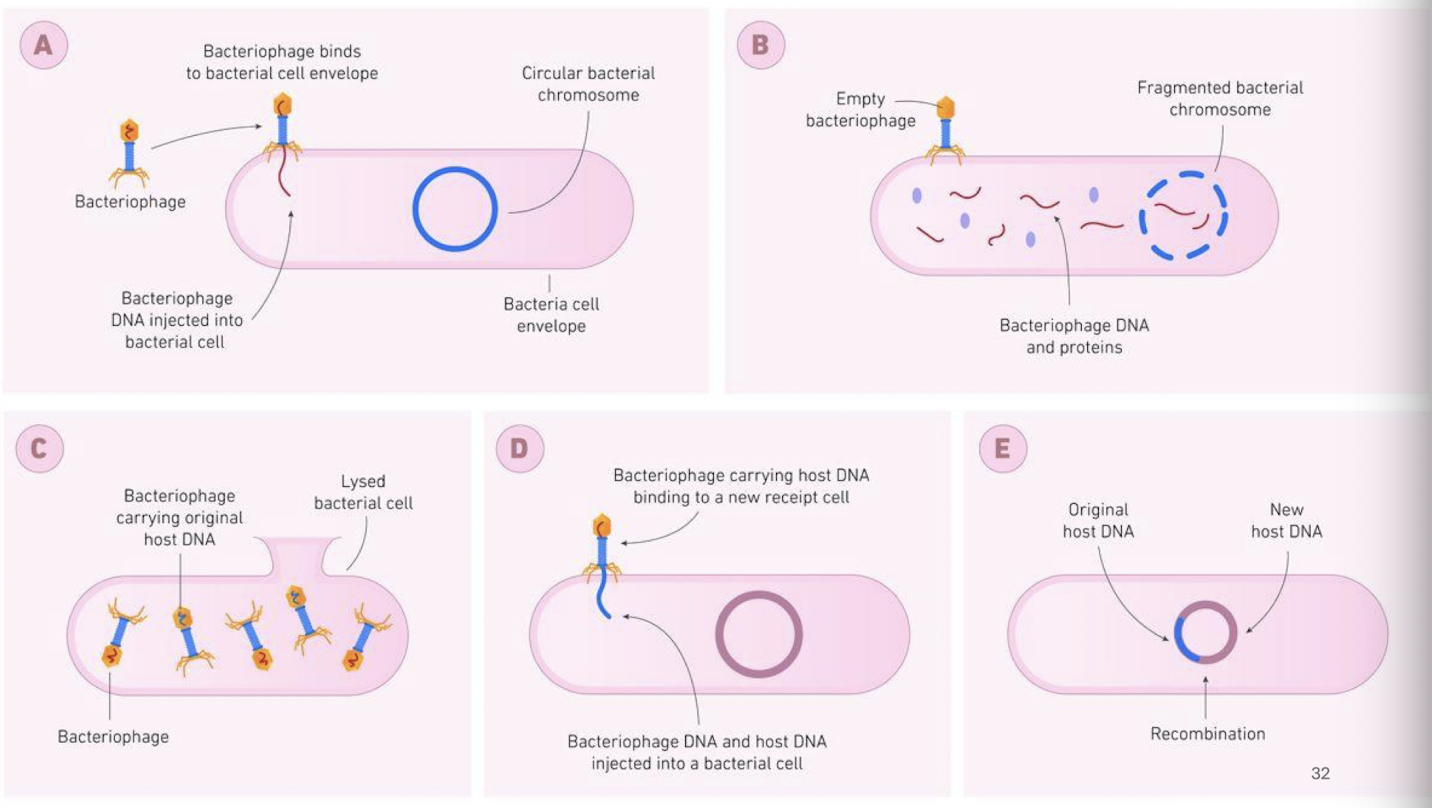
Transduction in Salmonella Example
P22 Phage in Salmonella
Organism: Salmonella enterica (bacterium)
Virus: P22 bacteriophage
Process:
P22 infect a donor Salmonella cell
During viral replication, some bacterial DNa fragments are accidentally packaged into new viral particles
The donor DNA can join with the recipient’s DNA creating a recombinant bacterium with new traits
Key Concept:
Bacteriophages act as vectors for gene transfer
Transduction can transfer genes for traits such as toxin production or antibiotic resistance
Transduction v. Reserve Transcription
Transduction
a bacteriophage (virus that infects bacteria) transfers DNA from one bacterium to another
Steps:
virus infects a donor bacterium
virus accidentally packages bacterial DNA into its capsid
Virus infects a new bacterium and delivers the DNA
the transferred DNA can recombine with the recipient’s chromosome
Key point: DNA moves via a virus; no RNA or reverse transcription is involved
Reverse Transcription
involved copy RNA into DNA using the enzyme reverse transcriptase
typical in retroviruses (ex. HIV)
viral RNA is converted into DNA, which can then integrate into the host genome
Key point: RNA → DNA, not just DNA transfer
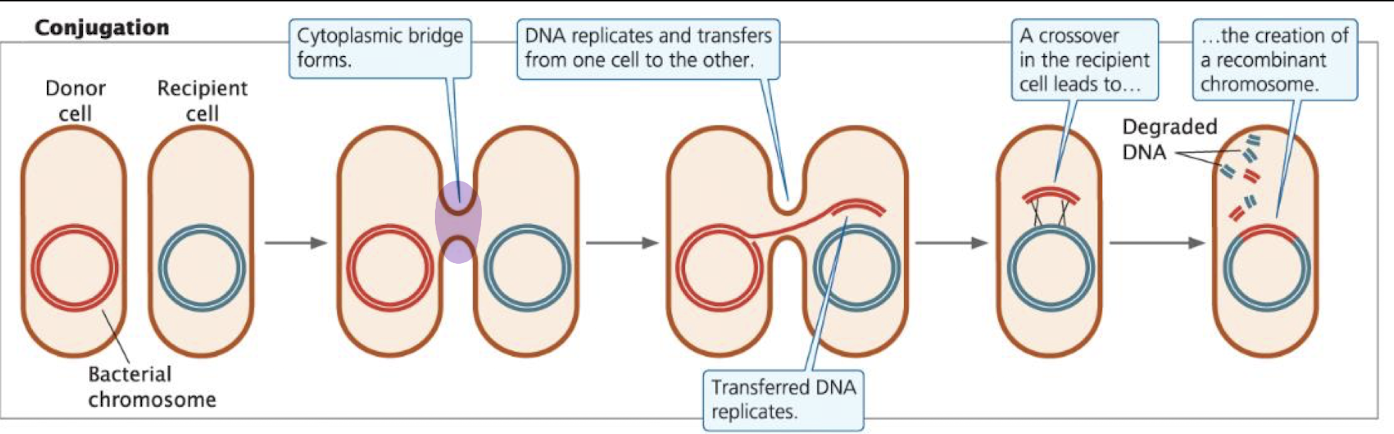
Conjugation
requires cell-to-cell contact; a cytoplasmic bridge (pilus) forms
DNA transferred: plasmid or part of the chromosome from donor → recipient
after transfer, crossing over may occur, creating a recombinant chromosome
directionality: DNA moves only from donor → recipient (no reciprocal exchange, so donor does not get anything new)
Note: not all bacteria can do this, need the F Factor to form a pilus (bridge)
Bacterial Conjugation and the F Factor
The F Factor (fertility factor) is a plasmid episome found in some E. coli and other bacteria that carries genes that allow a bacterium to conjugate
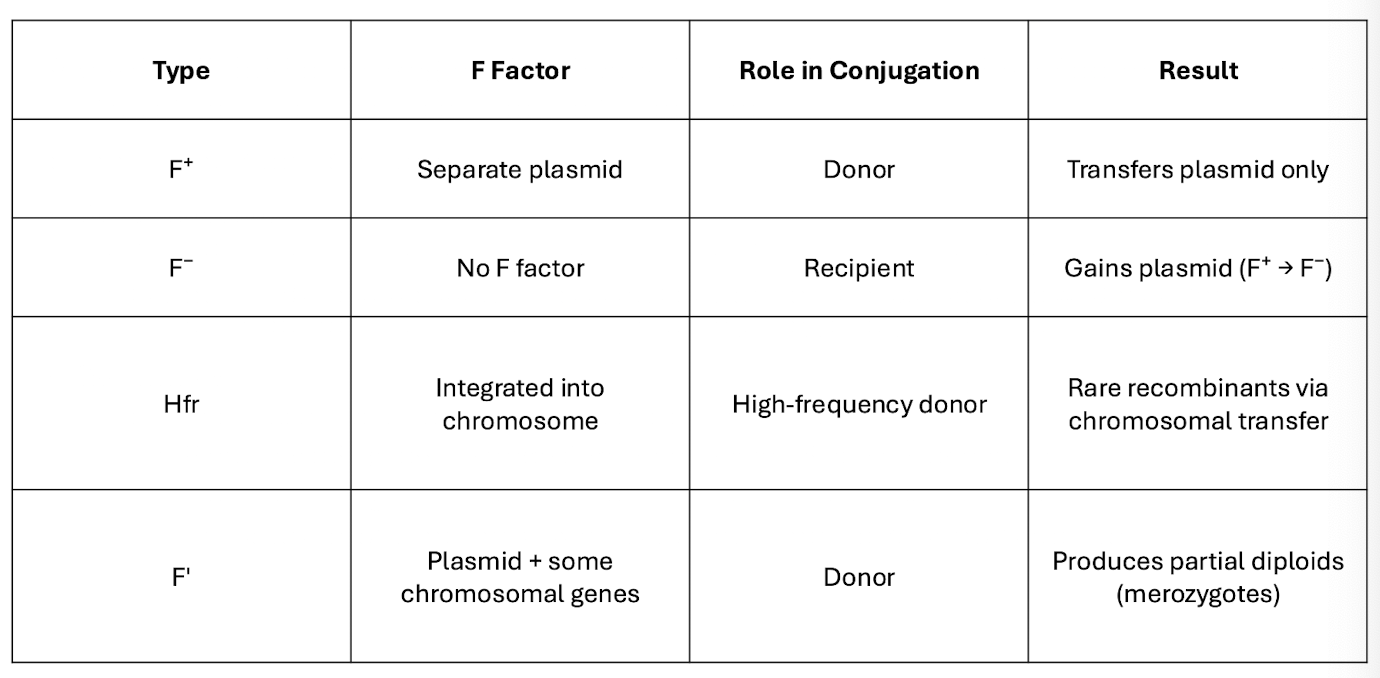
F+ cells (with the F factor): can donate DNA to F- cells (without F factor)
During conjugation: the F plasmid is copied and transferred to the recipient cell, making it F+ and capable of donating DNA to others
Importance of F factor:
enables horizontal gene transfer, spreading genes like antibiotic resistance
can integrate into the chromosome (Hfr), transferring chromosomal genes to the recipient
helps map bacterial genes and study gene function
Discovery of Genetic Exchange in Bacteria
Lederberg and Tatum’s 1946 Experument
Before 1946, bacteria was believed to reproduce only by binary fission (dividing of organism by small polyp that breaks off and grows on its own), no genetic exchange was known
Loshua Lederberg and Edward tatum challenged this idea using E. coli mutants
Their experiment provided the first evidence of recombination in bacteria
Lederberg and Tatum: Experimental Design
Auxotrophs: bacteria that cannot grow without certain nutrients because of gene mutations
Prototrophs: can grow on minimal medium (make all nutrients themselves)
Strains Used (auxotrophs for complementary mutations) DON’T NEED TO MEMORIZE STRAIN INFO
Y10: thr- thi- bio+ phe+ cys+
needs threonine, leucine, and thiamine added to grow
Y24: thr+ leu+ thi+ bio- phe- cys-
needs biotin, phenylalanine, and cysteine added to grow
Hypothesis: if bacteria can exchange genes, mixing Y10 and Y24 might allow them to complement each other’s mutations, producing some offspring that can grow without supplements
Lederberg and Tatum: When Y10 and Y24 Were Mixed
when mix ed and plated on minimal medium, a few colonies grew
each strain alone produced no growth, therefore colonies could not have arisen by random mutation: too many simultaneous mutations would be required
interpretation:
colonies were prototrophic recombinants with the genotype thr+ leu+ thi+ bio+ phe+ cys+
means that genetic exchange and recombination occurred between Y10 andY24
Does Gene Transfer Require Direct Contract?
Bernard Davis (1950) designed a U-tube with a fine-pore filter separating two bacterial strains
Allowed liquid medium to pass
Blocked bacterial cells (to see if DNA would pass through filter if bacteria could not)
Results:
After incubation, no colonies grew when plated on minimal medium
DNA did NOT pass through the filter
Conclusion:
Gene transfer requires direct contact between bacterial cells
Why did this not work?
cell has to be dead and break apart for DNA to be free-floating
this bacteria may just not be able to do transformation
The Fertility (F) Factor and Conjugation
Conjugation depends on a plasmid present in the donor cell
In E. coli, plasmid is called the fertility (F) factor
F factor carries genes to form a pilus, which allows transfer of DNA to another cell
Cells with the F factor are called F+ (donor); cells lacking it are F- (recipient)
F factor is an episome (can integrate into the chromosome bc it is a plasmid)
Contains:
Origin of replication (oriV): site where plasmid replication begins
Origin of transfer (oriT): site where DNA transfer begins
Conjugation genes (tra genes): encode the proteins that form the pilus
Once the entire F factor is transferred, the recipient (F-) becomes F+
both cells have full copy of F plasmid and can be donors in future conjugations
Direct transfer is defined: the oriT site always enters the recipient first
Only F plasmid genes are transferred in this type of conjugation - not chromosomal genes (yet)
could NOT explain the transfer of chromosomal genes discovered by Lederberg and Tatum
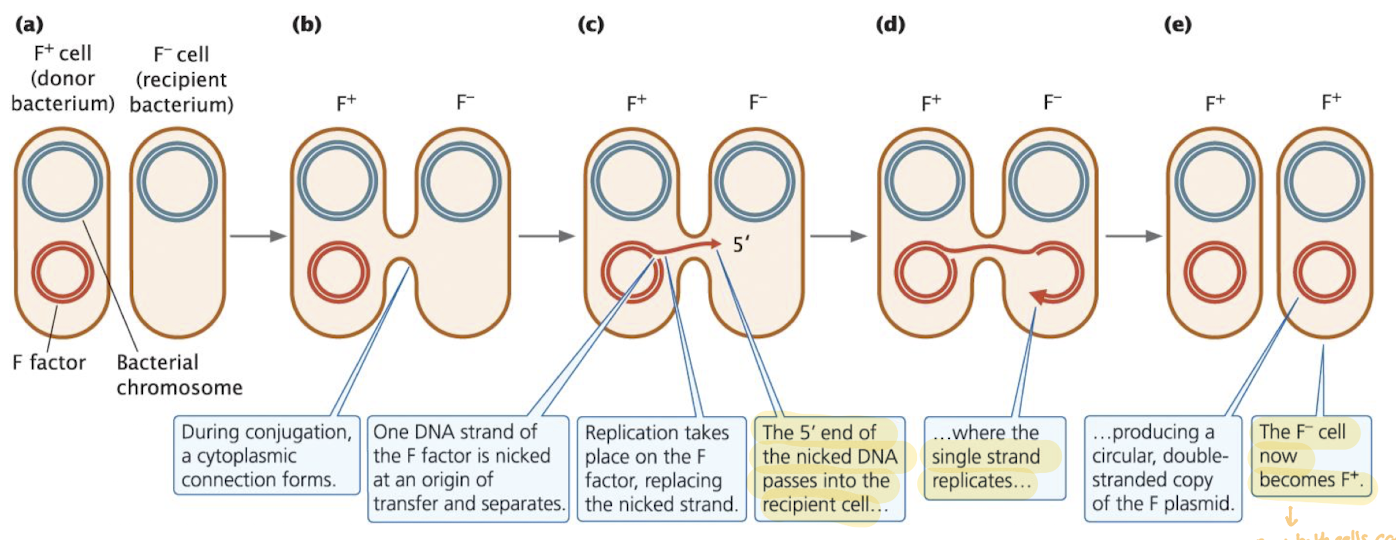
The Fertility (F) Factor and Conjugation: Steps
Contact: F+ cell forms a pilus that attaches to an F- cell
Connection: the pilus pulls the cells together, forming a cytoplasmic bridge
Nick and Transfer: One DNA strand of the F plasmic is nicked at oriT and begins to move into the recipient
Replication: as transfer occurs, rolling-circle replication replaces the transferred strand in the donor
Completion: The recipient replicates the incoming strand, forming a new double-stranded F plasmid
Note: now both cells can continue to pas on F+ (but chromosomal DNA is yet to be transferred)
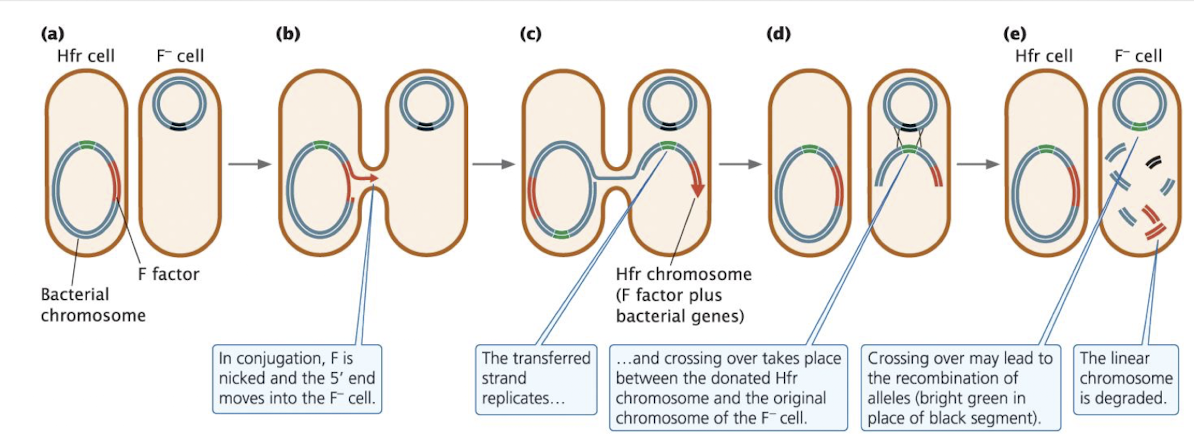
Hfr Cells
Hfr (High-Frequency Recombination) strains: where the F factor integrates into the bacterial chromosome through crossing over
creates a single, continuous DNA molecule with chromosomal genes and F factor sequences
STEPS:
Cells connected via pilus. F factor nicked at oriT in Hfr cell; 5’ end enters F- cell first
takes some of the chromosomal DNA with it (which will be copied over)
Transferred DNA strand replicates as it enters the recipient
Pilus bridge disappears. Transferred Hfr DNA (F factor + chromosomal segment) crosses over with F- chromosome
occurs since F factor is no longer a plasmid, crossing over can occur
F- cell now has recombined chromosome (but not F+ because it didn’t get the F factor). Non-integrated DNA is degraded (didn’t copy the plasmid or F factor). Hfr cell remains unchanged. This cell can now be replicated and passed on to later generations by binary fission (cell division)
Consequences and Frequency of Hfr Events
the recipient cell rarely becomes F+ or Hfr
the entire F factor must be transferred
rarely happens before the cells separate
Hfr formation occurs about 1 in 10,000 f+ cells
This low frequency explains the rare recombination events observed by Lederberg and Tatum (why only some bacteria grow)
Occasionally, the F factor is excised from the chromosome, converting an Hfr cell back into F+
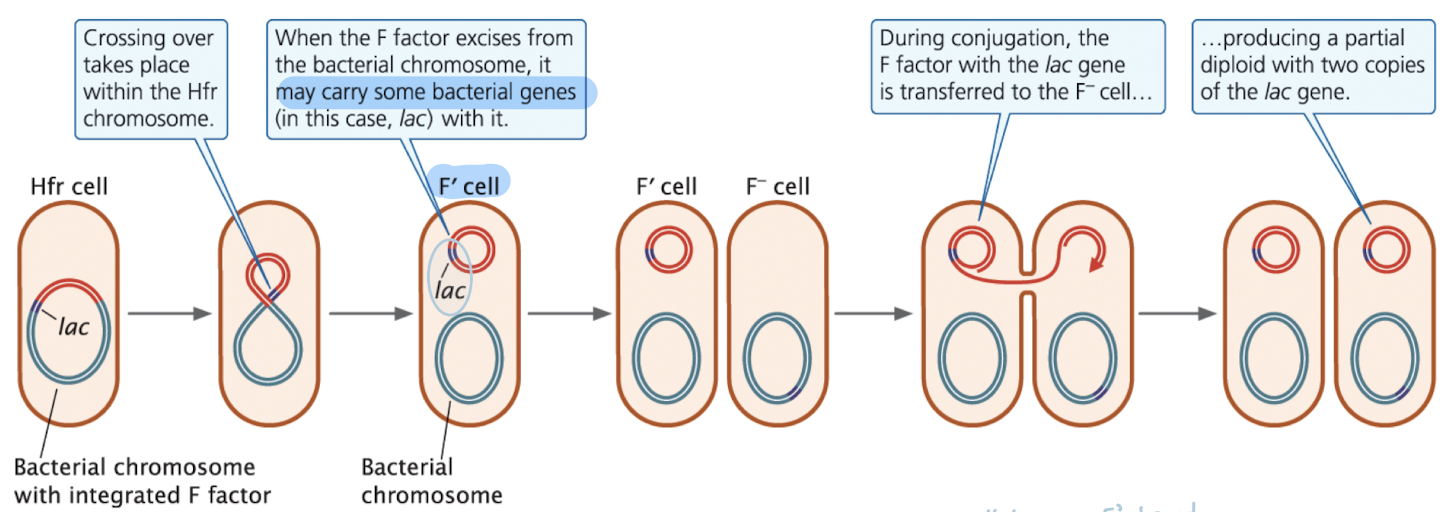
F’ Cells
Excised F factor is removed from the chromosome
natural process during DNA replication or recombination events
helps the plasmid return to an independent form
When it excises:
becomes a separate circular plasmid again
may carry nearby chromosomal genes (ex. lac genes)
plasmid would be F factor with one other gene
Resulting plasmid = F’ plasmid
F’ plasmids can transfer both F factor and chromosomal genes (that were on the F’ plasmid) to F- cells
this creates partial diploids (merozygotes); cells with two copies of some genes, one on the bacterial chromosome and one on the newly introduced F plasmid
useful for studing gene function and dominance
Merozygotes
A partial diploid (merozygote) is a bacterial cell with two copies of some genes: one on the chromosome and one on an F’ plasmid
Uses in Studying Genes:
Gene Function
Scientists can compare the activity of the plasmid-borne gene vs. the chromosomal copy
ex. if the chromosomal copy is mutated and the F’ plasmid has a WT gene, the cell can regain the function. this allows researchers to test which gene copy is functional
Dominance
in a merozygote, you can see which allele is dominant:
if the plasmid gene “overrides” the chromosomal allele →
id the plasmid gene does not restore function → chromosomal allele is dominant
especially important in recessive v. dominant gene studies in bacteria
Cell Types (F factor)
Mapping Bacterial Genes with interrupted Conjugation
Purpose: Determine the order of genes on a bacterial chromosome
Process:
Conjugation occurs between Hfr donor and F- recipient
Full chromosome tranfer takes 100 minutes
If conjugation is interrupted early, only part of the chromosome is transferred
Genes that enter the recipient first are located closer to the F factor integration site
Transfer always begins at the integrated F factor and moved in a defined direction
By interupting at different times, you can see which genes entered the recipient (and thus determine which genes are located closest to the origin of transfer)
Today, DNA sequencing is the preferred method for bacterial gene mapping, so this method is not used as much anymore
Transformation in Bacteria
Transformation = uptake of DNA from the surrounding environment
DNA can integrate into bacterial chromosome or plasmids
Occurs naturally when dead bacteria release DNA fragments
important in soil and marine environments as a genetic exchange route
Key role in discovering DNA as the genetic material
Used in laboratory techniques to transfer genes into bacteria
helps scientists study gene function and engineer bacteria
Competence and DNA Uptake
cells that can take up DNA through their cell membranes are said to be competent
competence is influenced by
growth stage
DNA concentration in the environment
environmental factors (temperature, nutrients)
DNA uptaken can be bacterial and non-bacterial
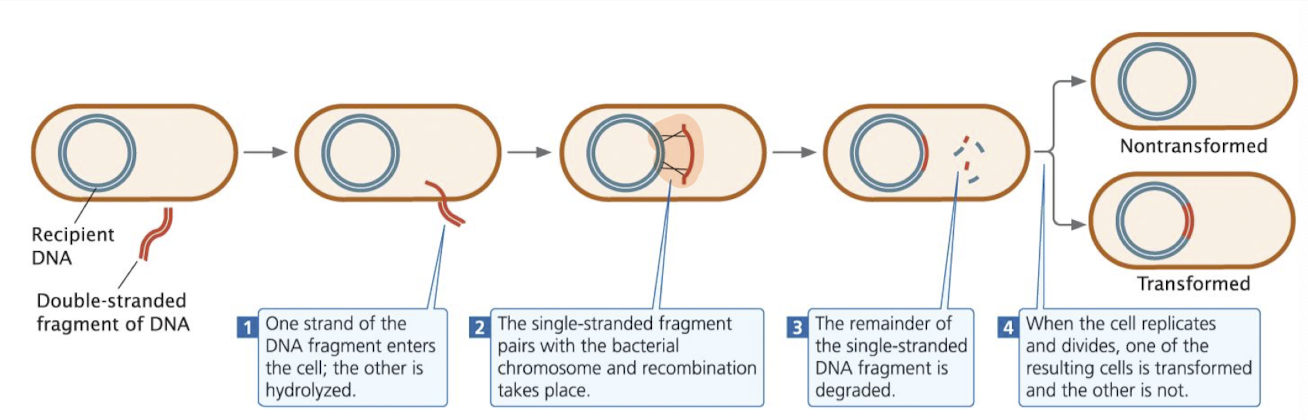
during transformation, one DNA strand is degraded, while the other may pair with homologous regions in the chromosome (but needs a lot of things to go correct in order for this to happen)
Integration:
integration requires two crossover events to insert single-stranded DNA into the bacterial chromosome
remaining single-stranded DNA is degraded by bacterial enzymes
in some species, double-stranded DNA can enter and integrate directly
resulting cells:
transformants: received and integrated new DNA
non-transformed: retained only original bacterial DNA
Cell division: one daughter may be transformed, the other non-transformed
Laboratory Techniques
bacterial geneticists can increase transformation efficiency using lab techniques:
calcium chloride treatment: makes membranes more permeable
heat shock or electroporation: DNA uptake facilitated uses an electric pulse to create transiet pores in the membrane
special competent strains of bacteria developed for research
enables transformation of bacteria like E. coli, which are not naturally competent
essential for gene transfer, plasmid introduction, and genetic
Using Transformation for Gene Mapping
Requires
Donor stran: prototrophic (has functional genes)
Recipient strain: auxotrophic (lacks genes for certain nutrients)
Process
Donor DNA is isolated, purified, and fragmented
Recipient cells are treates to become competent
DNA fragments enter recipient cells and may recombine with homologous regions
Using Transformation for Gene Mapping: Cotransformation
After DNA enters the recipient
Donor DNA undergoes recombination with the recipient chromosome
generates transformants with different combinations of genes
example: genes a, b, c
single transformants: a+, b+, or c+
multiple gene transformants a+b_, etc
genes closer together are more likely to be cotransformed
process in which two or more genes are taken up together during cell transformation
frequency of cotransformation directlly proportion to proximity of genes
genes closer together → likely on same DNA fragment → cotransformed
genes far apart → unlikely on the same fragment → rarely cotransformed
Conclusion: Cotransformation frequencies can be used to map relative positions of genes on bacterial chromosomes
Horizontal Gene Transfer Definition
Horizontal gene transfer (HGT): genes passed between species without reproduction
mechanisms: conjugation, transformation, transduction
contrast: vertical transmission = genes passed from parent to offspring
genome sequencing has shown that many bacteria have large portions of DNA that originated in other species
in E. coli, 17% of its genome appears to have been acquired by HGT, not inherited through ancestors
recombination can occur through HGT
Horizontal Gene Transfer: Medical Importance
Virulence (Disease-Causing Ability)
HGT can give harmless bacteria the genes need to become pathogenic
example
Vibrio cholerae became dangerous after acquiring a toxin gene via transduction
Antibiotic Resistance
many antibiotic resistance genes are located on plasmids, which can be easily exchanged between bacteria, even across species
example
methicillin-resistant Staphylococcus aureus (MRSA) strains can transfer resistance genes to other bacteria in hospitals → making infections harder to treat
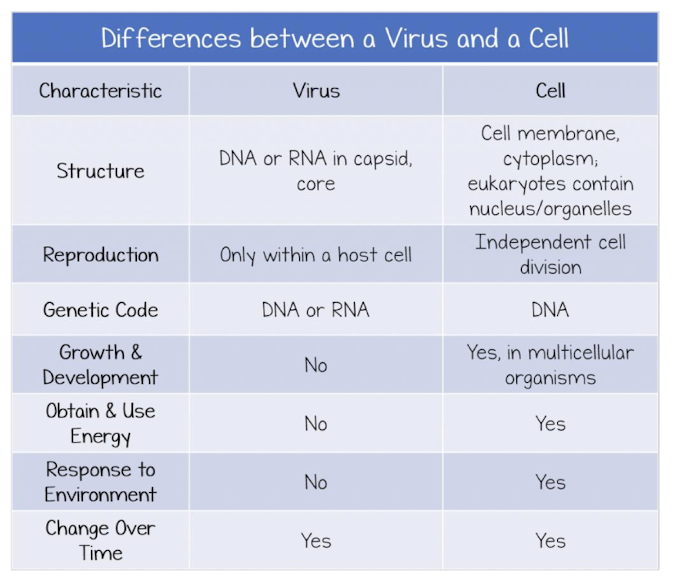
Viruses Definition
noncellular replicating structure consisting of nucleic acid surrounded by a protein coat (not considered life)
can only replicate within a host
infect all forms of life: bacteria, plants, animals, and fungi
come in many different shapes and sizes
Viruses: Non-Living
Do NOT meet most of the standards for life
No cellcular structure (not made of cells)
No metabolism or energy production (no mitochondria or ATP production)
Cannot reproduce independently
do not have the proteins needed for transcription and translation (no polymerase, etc) so must replicate using host cell
Inert outside a host
can only survive brief periods outside of host
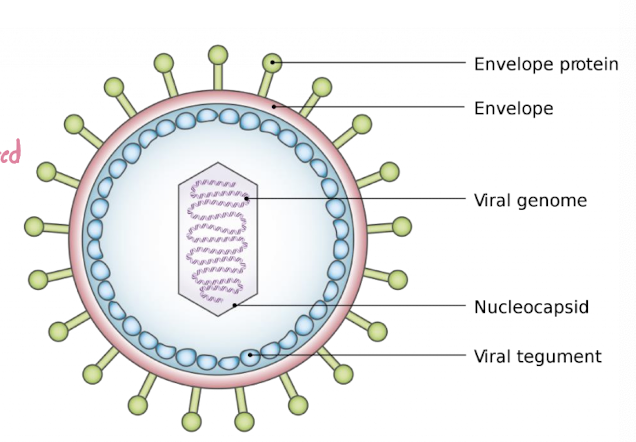
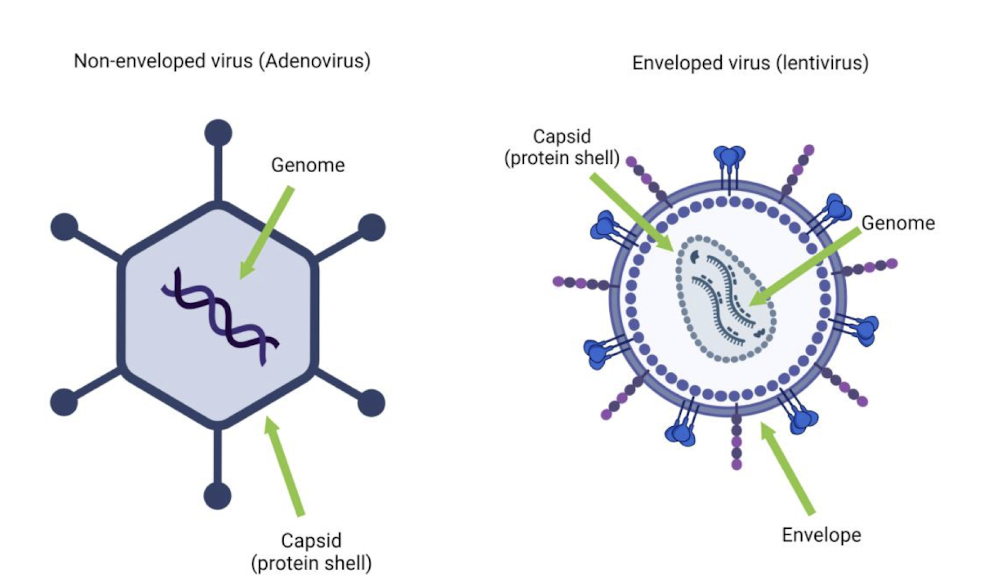
Virus Components and Genome
Consist of:
nucleic acid genome (DNA or RNA)
protein coat (capsid) surrounding the genome
some viruses also have a lipid envelope derived from host cell membrane
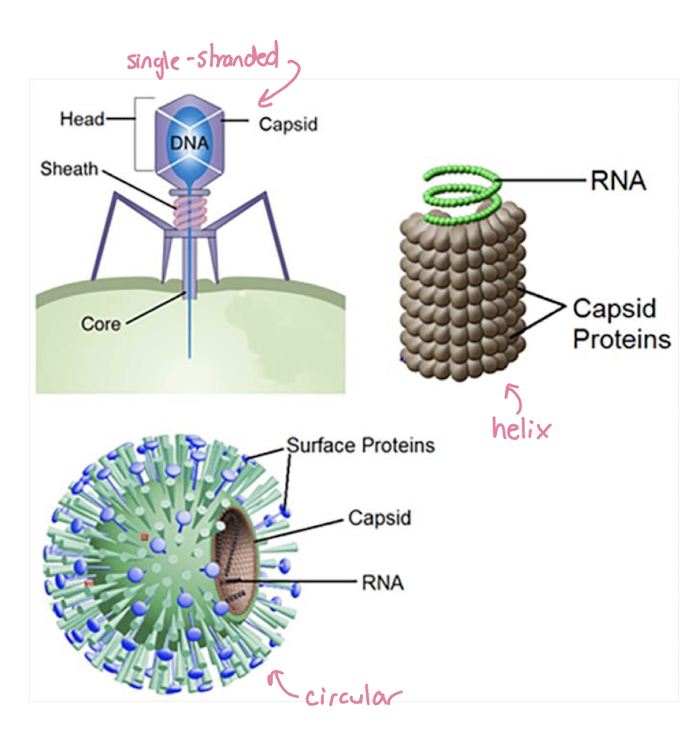
Viral genomes vary widely:
may be DNA or RNA
Single or Double-stranded
dif shapes and structures have dif functions
Linear or circular
Viral Structure
Structure is related to how they infect and what hosts they target
Enveloped:
Outer structure: lipid membrane around capsid
Entry strategy: fuses with host membrane
Example: HIV or Influenza A (see below)
enveloped virus containing RNA genome segments; infects vertebrate respiratory cells
Non-Enveloped:
Outer structure: protein capsid only
Entry strategy: often enters by injecting or endocytosis
Example: bacteriophage 4
complex structure with protein head and tail fibers; infects bacteria
Host Specificity (Tropism)
Viruses infect only specific hosts and cell types
Determined by receptor binding on host cells (lock and key ides)
A virus can only infect cells that have the correct receptor
Host range = types of organisms a virus can infect
Tropism = specific cells/tissues a virus targets
the preference of a virus to infect specific host species: significantly influencing its distribution, transmission, and potential public health risk
examples:
bacteriophages: infect bacteria only
influenza virus: infects respiratory epithelial cells
HIV: infects immune cells
avian influenza prefers birds, but has now also impacted cows
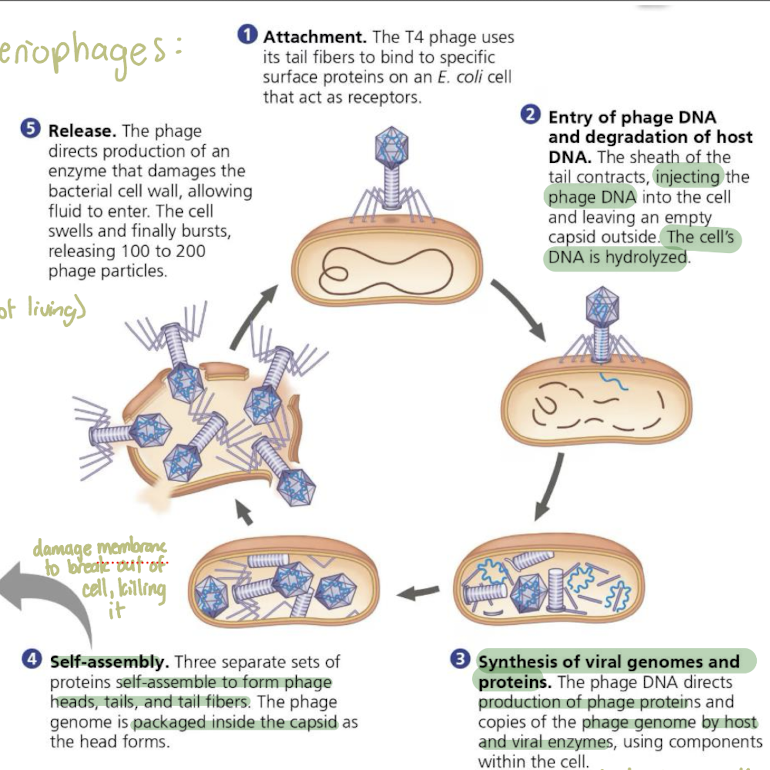
Steps of Virus Replication in Host Cells: Using Bacteriophages
Attachment: the T4 phage uses its tail fibers to bind to specific surface proteins on an E. coli cell that act as receptors
Entry of phage DNA and degradation of host DNA: the sheath of the tail contracts, injecting the phage DNA into the cell and leaving empty capsid outside. Cell’s DNA is hydrolyzed
Synthesis of viral genomes and proteins: The phage DNA directs production of phage proteins and copies of the phage genome by host and viral enzymes, using the host cell’s machinery
Self-assembly: Three separate sets of proteins self-assemble to form phage heads, tails, and tail fibers. The phage genome is packaged inside the capsid as the head forms
Release: The phage directs production of an enzyme that damanges the bacterial cell wall, allowing fluid to enter. The cell swells and finally bursts (killing it) and releasing 100-200 phage particles
Steps of Virus Replication in Host Cells: Using Regular Capsid
Glycoproteins on the viral envelope bind to receptors on the host cell. For some viruses, the envelope fuses with the plasma membrane; others enter by endocytosis
The capsid and viral genome enter the cell. Digestion of the capsid by cellular enzymes releases the viral genome (which looks like RNA so the cell doesn’t destroy it)
The viral genome (red) functions as a template for synthesis of complementary RNA strands (pink) by a viral RNA polymerase (hacks RNA transcription)
New copies of viral genome RNA are made using the complementary RNA strands as templates
similar to reverse transcription
Complementary RNA strands also function as mRNA, which is translated into both capsid proteins (in the cytosol) and glycoproteins for the viral envelope (in the ER and Golgi apparatus)
Vesicles transport envelope glycoproteins to the plasma membrane
A capsid assembles around each viral genome molecule
when it leaves, the cell is often killed
Each new virus buds from the cell, its envelope studded with viral glycoproteins embedded in membrane derived from the host cell
How Cells Block Viruses v. How Vaccines Work
Glycosylation (Cell’s Defense)
Sugars added by your cell’s enzymes cover and change receptor sites (your body changing/blocking the lock)
Acts like a physical shield → virus cannot attach
Determined by DNA and evolve over time
Vaccines (Immune System Defense)
introduce harmless viral parts or instructions
teach your immune system to recognize and block the virus
antibodies act like “guards “ that stop the virus before it reaches the receptor
Glycosylation modifies the lock (receptor)
Vaccines neutralize the key (virus)
Glycosylation (Cell’s Defense)
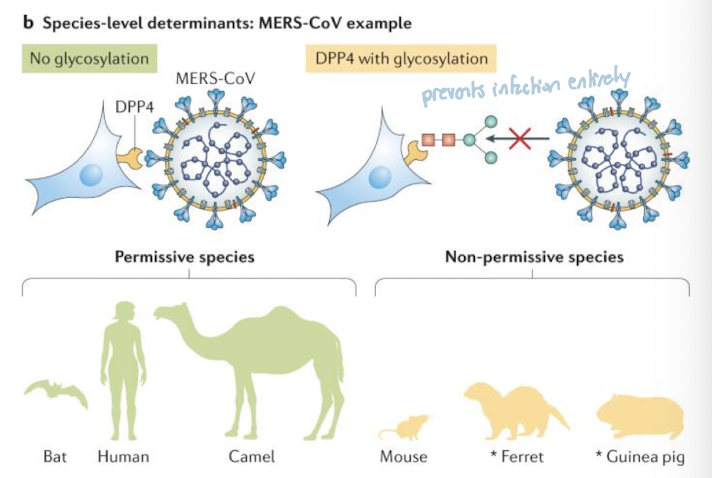
viral infection depends on binding to specific host cell receptors (lock-and-key interaction)
mutations in receptor genes can change their shape, preventing virus attachment
glycosylation (sugar molecules added to receptors) can physically block the virus from binding
these changes may arise from evolutionary adaptation or random variation
Result: determines which cells or species a virus can infect (host range/tropism)
Example:
MERS-CoV used DPP4 receptor to enter cells, but in some species glycosylation physically blocks the virus-binding site, preventing infection entirely