Unemployment and Inflation L & R & V
1/24
There's no tags or description
Looks like no tags are added yet.
Name | Mastery | Learn | Test | Matching | Spaced | Call with Kai |
|---|
No analytics yet
Send a link to your students to track their progress
25 Terms
Working-Age
Everyone aged 15 or older who is not in the army or institutionalized (prison, nursing home, mental health facility)
Employed
Working-age people who are working. You are employed as long as you work at least one hour during the week for pay of some kind, (self employed count, and temporary absence from your job counts)
Unemployed
Working age people without jobs who are trying to get jobs
Part of the working-age population
Not currently working
Actively searching for work (within the last 4 weeks)
Able to accept a job if it were offered
Labour Force
The employed plus the unemployed. The labour force is the part of the working-age population that is available to produce goods and services
Not in the labour force
Those in the working age population who are neither employed nor unemployed. People who are retired, in school, unwell, taking care of a child or family member, or have given up looking for a job
Labour Force Participation rate
The percentage of the working-age population that is either employed or unemployed

Unemployment Rate
The percentage of the labour force that is unemployed, measures proportion of job-seekers who can’t find work

Employment Rate
The percentage of the working-age population that is employed

Key benefits of using both unemployment and employment rate
Unemployment rate shows how hard it is to find a job right now
Employment rate reveals broader workforce participation trends
Employment rate captures people who have given up looking for work
Together provide more complete picture of economic health
Helps identify hidden unemployment when people exit labour force
Frictional Unemployment
Unemployment due to the time it take for employer to search for workers and for workers to search for jobs (job posting, interviews)
Contributes to natural rate of unemployment
Structural Unemployment
Unemployment due to labour market institutions (hiring/firing costs, unemployment benefits, minimum wage unions). More people seeking a job in a particular labor market than that there are jobs at the going wage rate
Contributes to natural rate of unemployment
Cyclical Unemployment
Unemployment due to the business cycle, i.e., temporary booms and recessions in the economy
Natural rate of unemployment
Frictional + Structural. Long run level of unemployment
Labour Market Phillips Curve
Illustrates a negative association between the inflation rate and the unemployment rate
Okun’s Law
Empirical observation that links output gap to cyclical unemployment (difference between actual and natural rate of unemployment)
Okun’s Law Formula
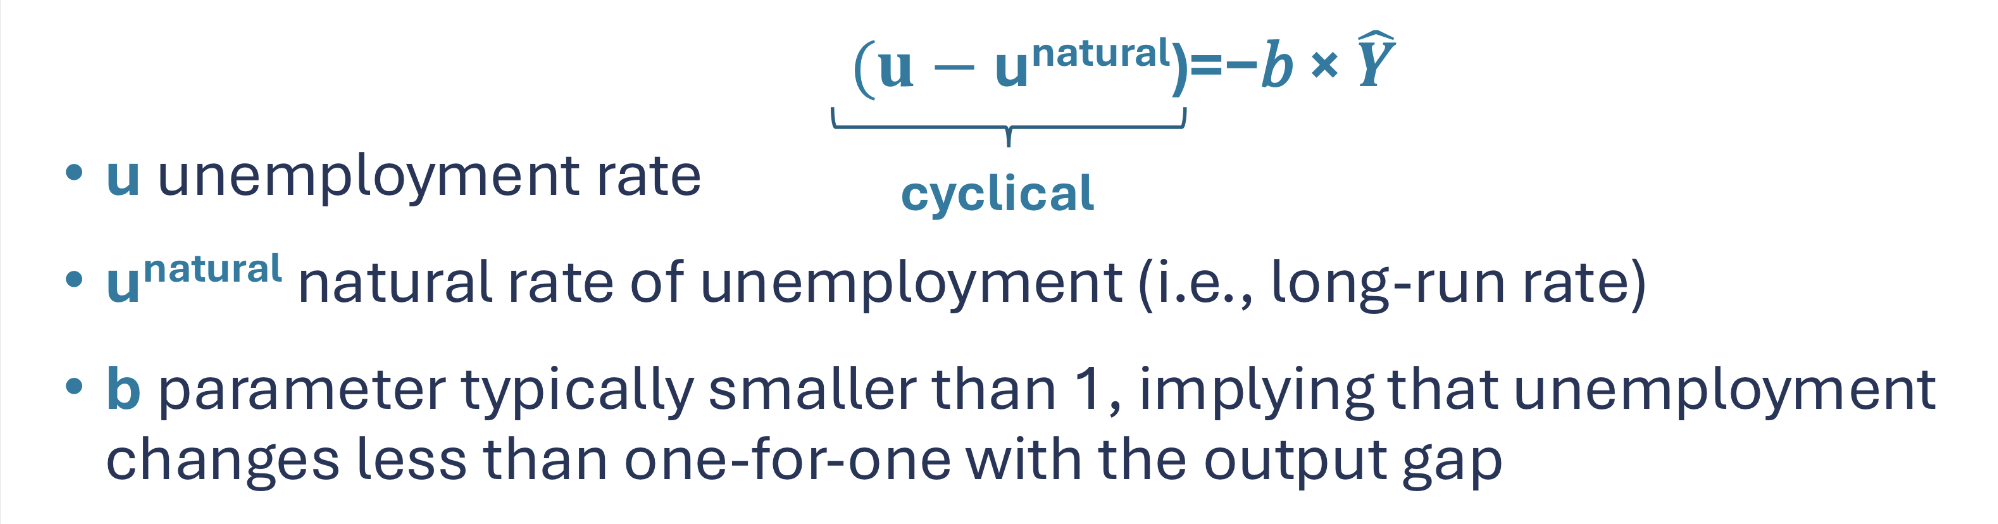
Okun’s Law for Canada
For each percentage point that actual output is less than potential output, the unemployment rate will be around one-third a percentage point higher
eg.
Ouput Gap declines form 0% to -3%
Unemployement rate will likely rise by about (1%) (8% - 9%)
Unemployment Phillips Curve

LRE

High Unemployment =
Below potential = Low unexpected inflation
Low Unemployment =
Above Potential = High Unexpected Inflation
Canada Phillips Curve over the years
1962 - 1968: Tradeoff between inflation and unemployement cler
1968 - 1973s: Curve breaks due to increased inflation expectations (shift in PC)
1973 -1980: Shift due to supply shock driven by large increase in the price of oil OPEC acting as a cartel
1980 - 1988: After high oil prices, BOC implemented a policy of disinflation, came at the cost of high unemployment as predicted by the PC
1988 - 1999: In 1988 BOC targets zero inflation, while successful triggered soaring unemployment, showcased trade off between price stability and jobs
2000 - 2022: Labour reforms and inflation targeting between 1-3% unemployment stayed at around 6-8% until pandemic
R What is the Federal Reserve’s dual mandate
Promote maximum sustainable employment, and price stability
R FOMC
Federal Open Market Committee, main monetary policymaking body
R Why did the Phillips curve flatten
Inflation Targeting