new Performance
1/120
There's no tags or description
Looks like no tags are added yet.
Name | Mastery | Learn | Test | Matching | Spaced | Call with Kai |
|---|
No analytics yet
Send a link to your students to track their progress
121 Terms
Jet Performance
Fundamental knowledge of performance principles for heavy, high-speed, high-altitude jet airplanes.
Generic guide to know Weight & Calculate Profit from Payload
used with the Airplane Operations Manual (AOM).
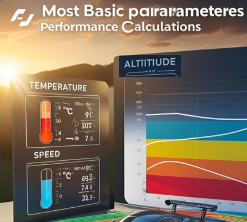
most basic parameters used in its calculations:
(Temperature—>1/∝)
(Altitude—>1/∝)
(Speed—>∝ Until Shockwave)
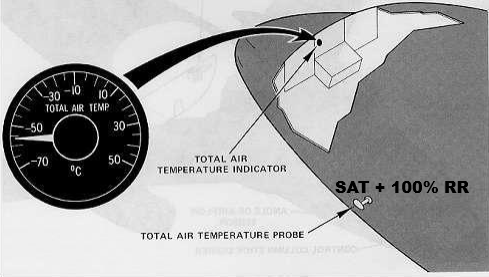
Ram Rise
Difference between TAT & SAT due to:
⇡ in Temp. due to Compressibility
Negligible Until: 0.3 Mach speed
Main cause→Deceleration (stagnation) of air
Minor effect→Friction with probe surfaces
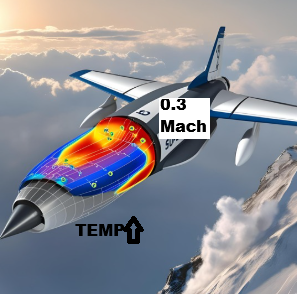
Compressibility
Change in the Volume when
External Force is Applied
Total Air Temperature (TAT)
“OAT”+ 100% of Ram Rise
Determines N1 / EPR limits
Obtained by TAT Probes including Ram Rise.
Comparison: TAT > SAT due to ram air stagnation.
In flight, the higher the Mach number, the greater the Ram Rise and the larger the difference between TAT and SAT.
Ram Air Temperature (RAT)
SAT + Certain % of Ram Rise.
If A/C is Stationary→TAT = RAT = SAT.
In modern A/Cs: ADC accounts for compressibility,
displays only→TAT, OAT
No-longer Displayed→RAT
Outside Air Temperature (OAT) / Static Air Temperature (SAT)
Temp. of Free moving, Undisturbed Air Around A/C. Obtained from
Ground meteorological Sources
in-flight TAT Corrected by ;ADCs for: Instrument Errors & Ram Rise.
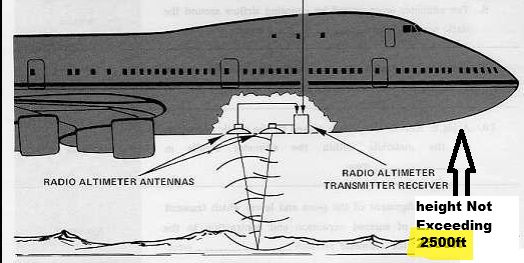
QFE (Height)
Altimeter setting that indicates
Height Above Ground Level (AGL)

Absolute Altitude
Height Above Terrain Measured by RA (Radio-Altimeter)
calculating Time Delay of a radio signal to Ground & Back
(used in Approach & Landing phases Only)
QNH ‘Local Altimeter Settings’
Altimeter setting Below Transition Layer
A/C flies with Reference to MSL
Giving Indicated Altitude
Provided by ATC

Indicated Altitude
Altitude on the Altimeter when set to QNH
indicating A/C Height above MSL
used for IFR flights below Transition altitude.

QNE
Altimeter setting used Above Transition Layer
A/C flies with reference to Flight Level
@1013.25Hpa (ISA press.)
Giving Pressure Altitude
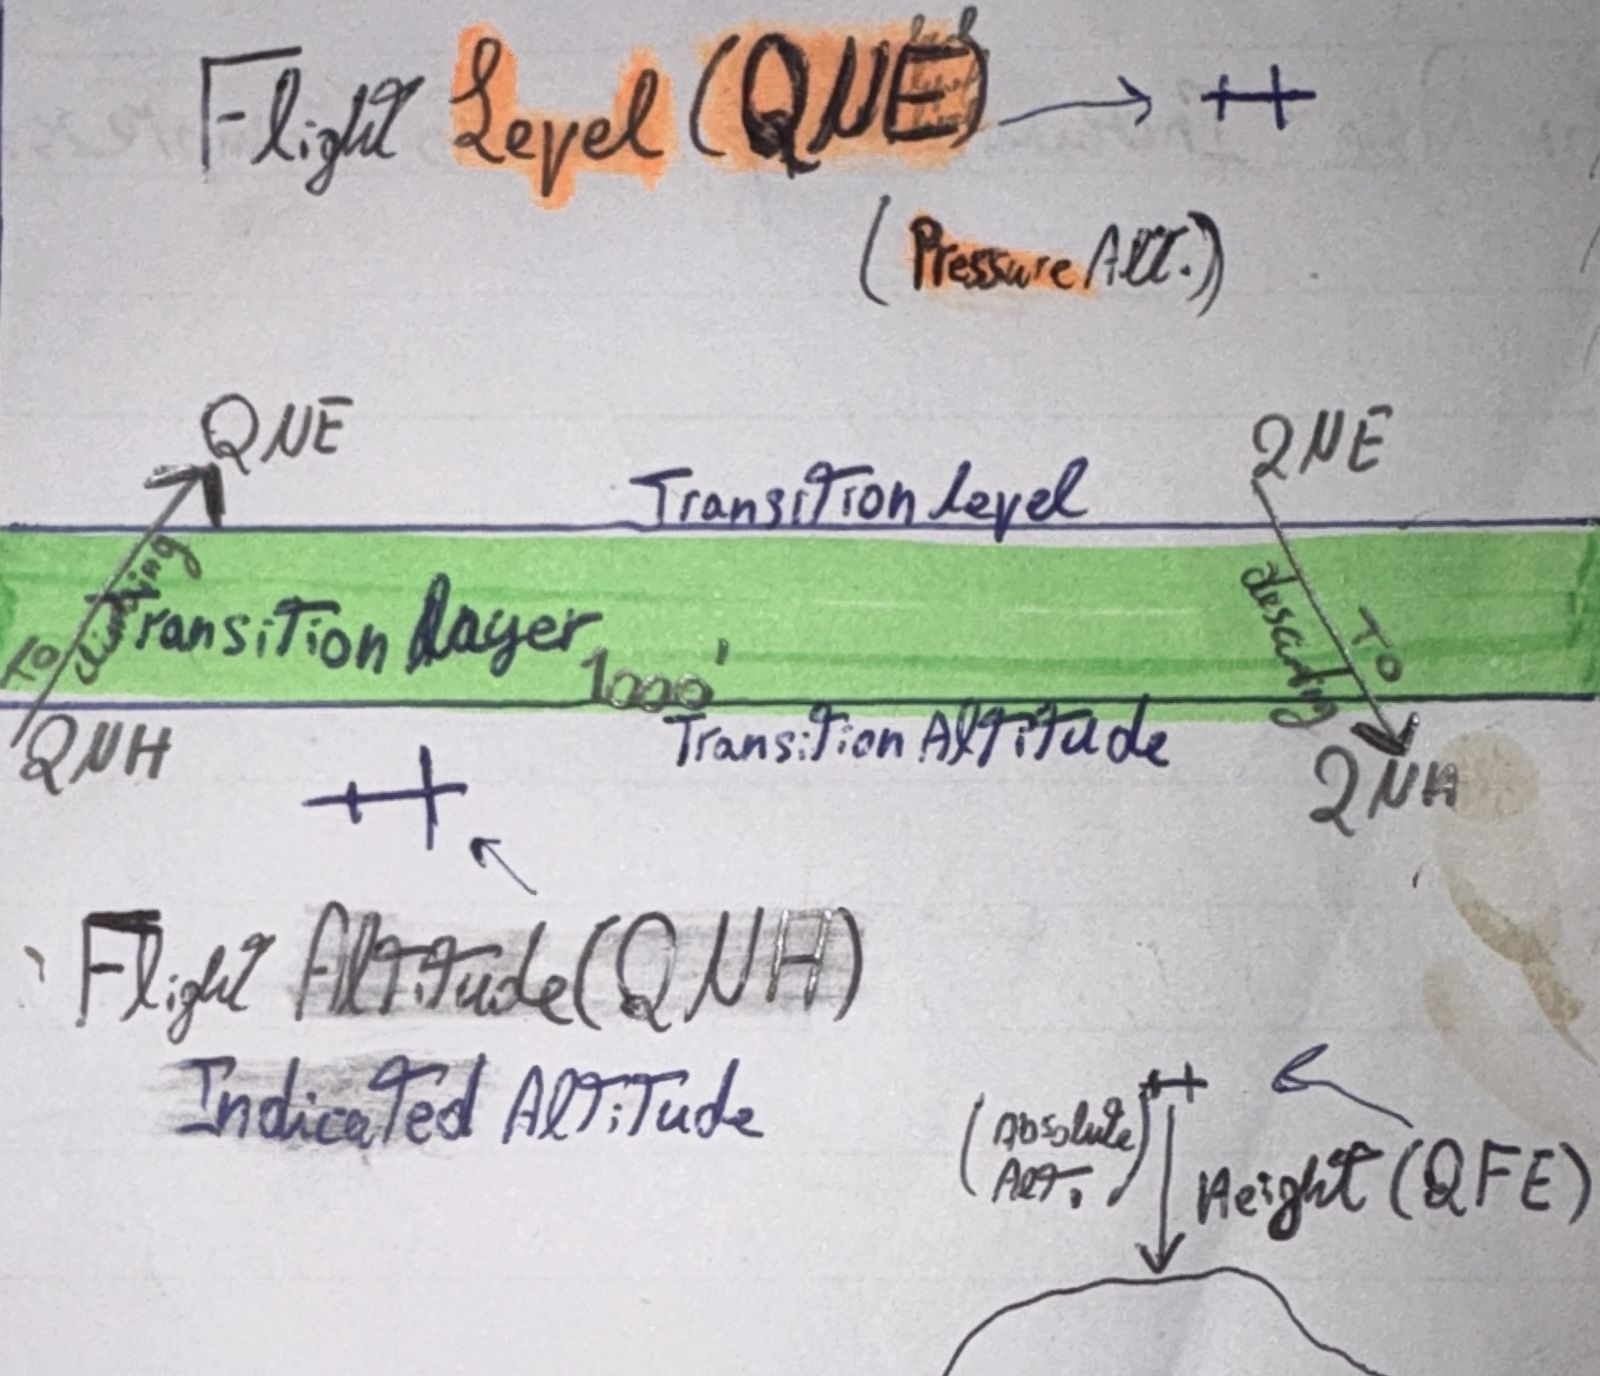
Pressure Altitude (PA)
Altitude on the altimeter when set to; QNE
@ ISA, which is 1013.25 (hPa) or 29.92 (inHg).
Above Standard Datum Plane (SDP).


Density Altitude
Press.Alt. Corrected for Non-Stndrd Temp.
120 feet for every 1°C Deviation from ISA
High DA →Occurs on hot days at high elevation airports; results in
reduced air density, leading to
longer takeoff rolls and
reduced rates of climb.
Aircraft performance calculations are based on actual air density.
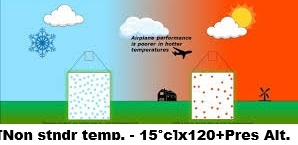
Density Altitude Equation
used for Perf. Calc.:
DA=[Non stndr temp. - ISA temp.(15°c) ] x 120 + PA
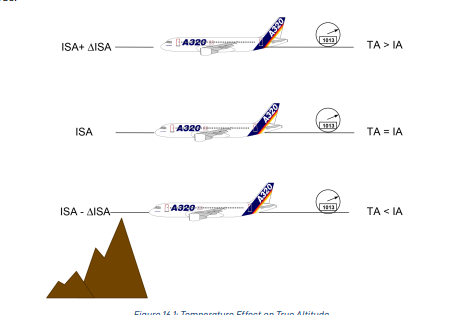
True Altitude
Actual Height of an object above Sea Level
Not indicated by any instruments.
in ISA conditions→True Alt. = Indicated Alt.
In extreme Cold weather→True Altitude < Indicated Altitude.
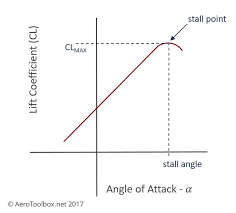
Vs (Stall Speed)
Speed at which airflow Separation Begins
Highest point on (CL) vs AoA (α) curve.
V S1G
corresponds to CLmax→(just before the lift starts to decrease)
@ 1G→Load-Factor
Load Factor (or) G Factor
relation between Lift Produced to
Gross Weight Opposing it.
V MCG
Minimum Control speed on Ground
at which A/C Controllable using only aerodynamic controls (Maximum Rudder Deflection) in case of 😞 engine Failure rec. @ V1 & Other engine on T/O Thrust
Affected by:
Temp, Alt. Inversely
V MCA
Minimum Control speed in Air (Flight)
at which A/C Controllable using Maximum Rudder Deflection only.
in case of 😞 engine failure @ V1
& Other engine on T/O Thrust
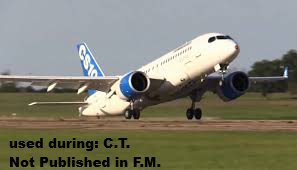
Minimum Unstick Speed (VMU)
Lowest speed where A/C can Safely; Lift Off Ground→Continue T/O
Without Encountering Tail Strike.
No Longer Published in FM.
Liftoff Speed (VLOF)
Actual speed at which the airplane Lifts Off. Depends on:
Weight,
(AoA°) angle of attack,
Configurations.(flaps settings)
Must be Below:
Maximum Tire Speed.
Maximum Tire Speed
Strength of Tires determines this speed due to the Exposure to
⬆Centrifugal forces @⬆Speeds
✈Matters more@High-Elevation A/P:
As Altitude ⬆, Density⬇
To generate same Lift
⬆Airspeed (TAS) is needed.
Indicated airspeed (IAS) might be normal,
but True Airspeed may Exceed Tire limit
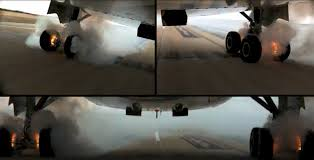
Maximum Brake Energy Speed (V MBE)
Maximum Speed for Full Braking to a Complete Stop,
within Braking System's Heat Limitations
Must be Higher Than (>) Vlof
Depends on:
Temp.
Press.
Weight,
Wind
RWY Slope
Higher TAS/ground speed at high-elevation airports (e.g., Addis Ababa at 7,600 ft) requires increased attention to V MBE.
Engine Failure Speed (V EF)
@ which Critical Engine Assumed to Fail.
Selected to allow 1 to 2 seconds before reaching V 1.
to allow pilots to react to 😞engine failure.
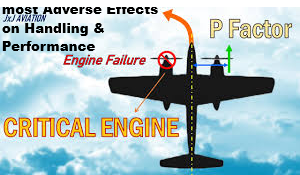
Crtical Engine
in ↔Multi-engine aircraft with the Most
Adverse Effects on A/C Handling & Performance
in case of its 😞Failure.
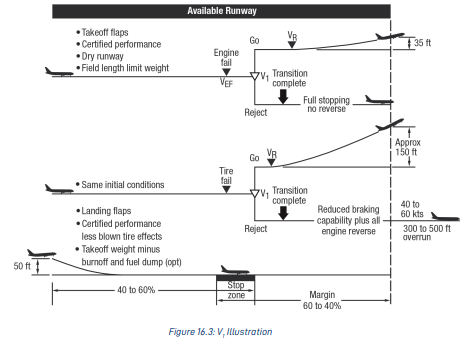
V1 (Decision Speed)
Maximum speed whether you Reject or Continue T/O,
where 1st Braking Action must be Applied in case of Rejected T/O
Within ASDA , Without Reverse-Thrust
limits:
Higher than > VMCG
Lower than < VR & VMBE
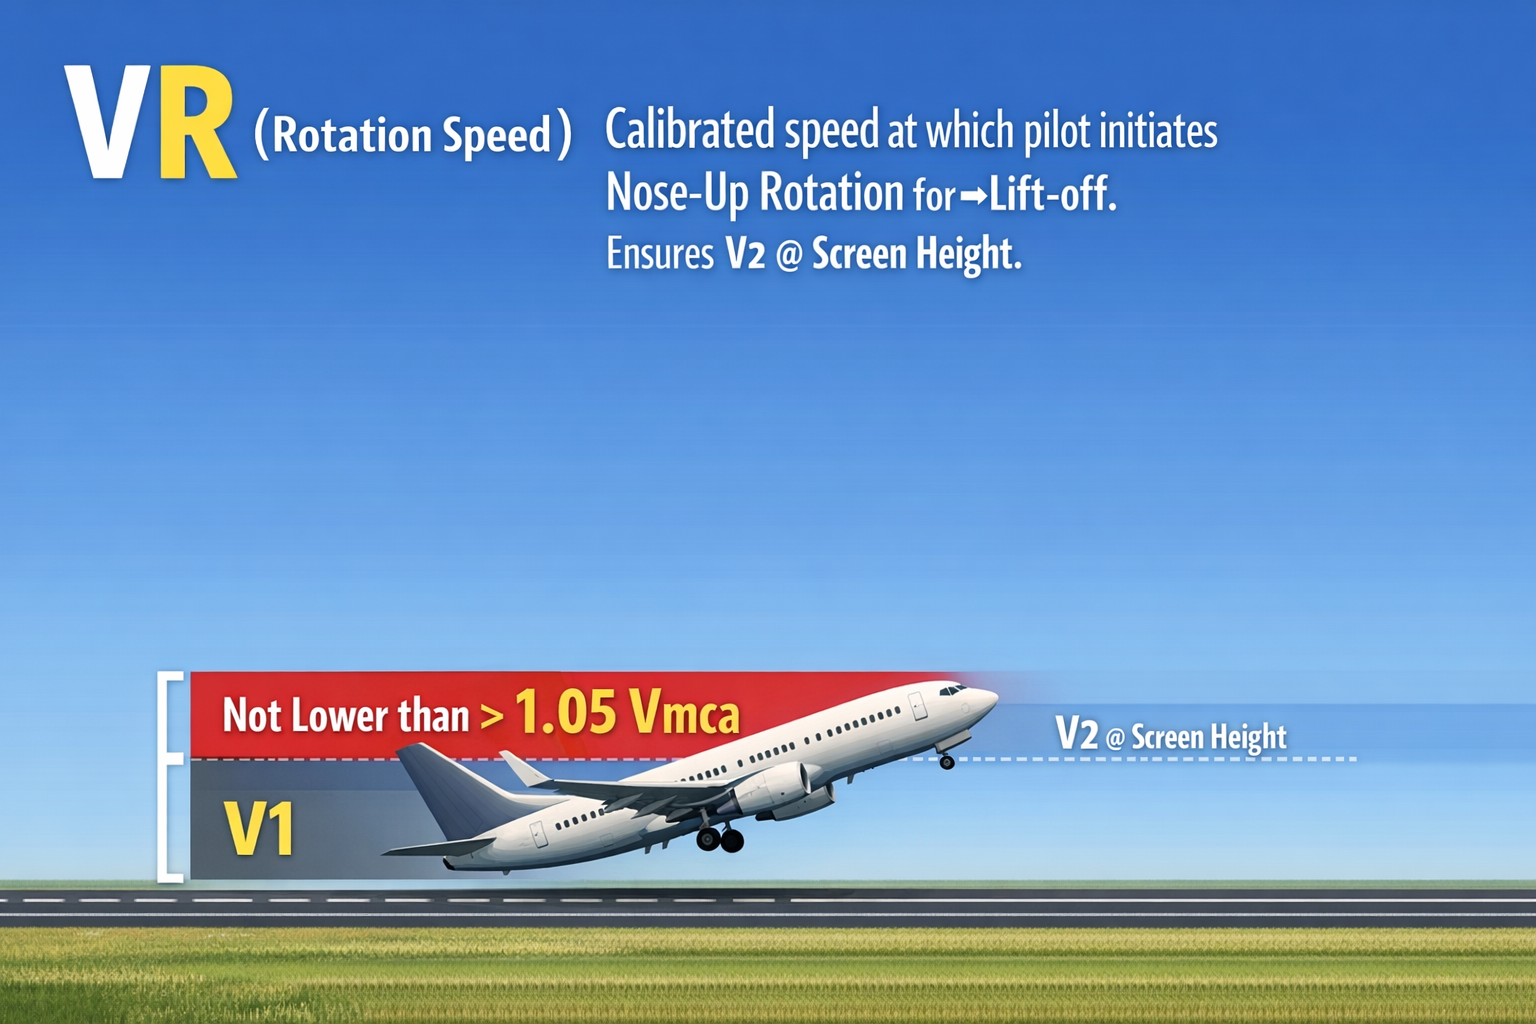
Rotation Speed (VR)
Calibrated speed at which pilot initiates Nose-Up Rotation for→Lift-off.
Ensures V2 @ Screen Height
Not Lower than >;
V1
1.05 Vmca
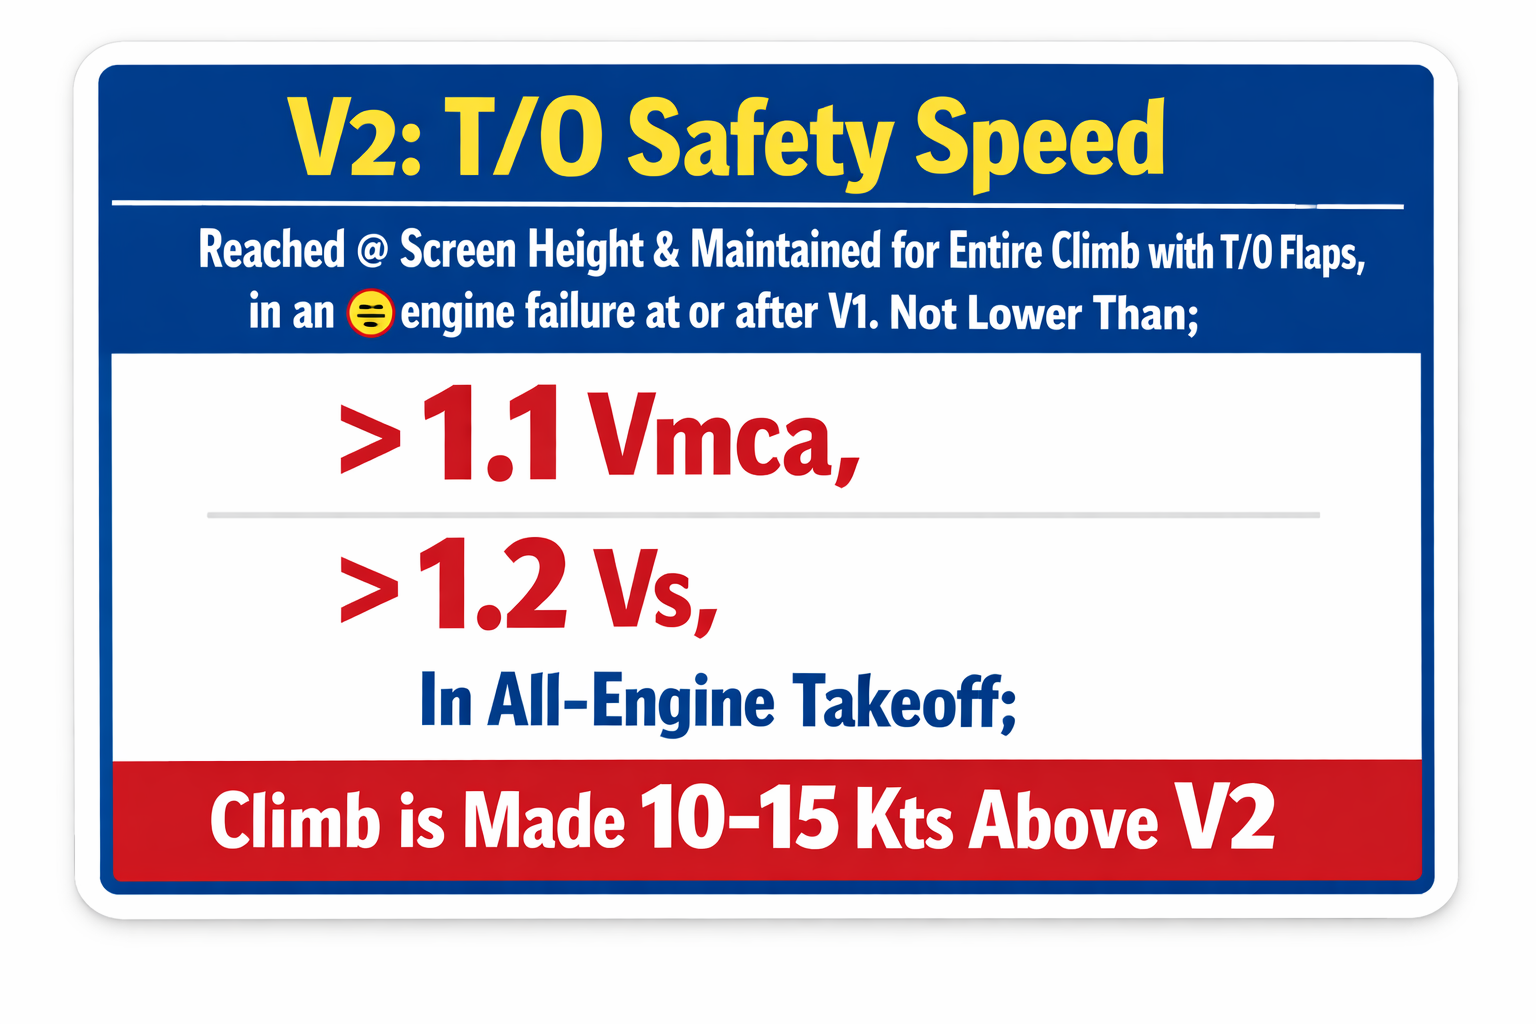
Takeoff Climb Speed (V 2)
T/O Safety Speed, Reached @ Screen Height
& Maintained for Entire Climb with T/O Flaps,
in an 😞engine failure at or after V1. Not Lower Than>;
>1.1Vmca,
>1.2 Vs,
In All‑Engine takeoff;
Climb is made 10–15 Kts Above V2
Screen Height
35’→Dry,
15’→Wet RWY, above T/O surface
After an E.F. @ V1,
at which V2 Must be Reached & Maintained.
Take off Performance
Determining 3 things during this initial phase:
Capabilities & Limitations of A/C
Minimum RW Length Required for Safe T/O,
Best Fuel Consumption
which-Ensuring passenger Safety
-Reducing A/C Wear
-Optimizing flight Schedules.
TODR
Takeoff Distance Required, The Greater of:
Horizontal distance starting from; Ground Roll until reaching 35’ (Screen-Height)
above T/O surface in case of 😞Engine Failure @V1
with All engines operating →115% of horizontal distance, Ground Roll until reaching 35’
ASDR→(1+2)
Accelerate-Stop Distance Required, Sum of the Distances required to:
1) Accelerate with All Engines @ V1
2) Decelerate to a Full Stop with EF
The distance to decelerate to a full stop from V1 , including the transition time needed to achieve the final braking configuration (e.g., full brakes and spoilers)
TORR (2 R fel Nos ya 7mar)
Takeoff Run Required, The greater of:
Horizontal dis from ground roll until reaching a point Equidistant to Vlof & V2
Assuming😞EF @ V1, Must not exceed Runway Length115% of distance to a point equidistant between V LOF and screen height (all engines).
TORA
Takeoff Run Available, Length of runway declared available and suitable for ground run of A/C
Clearway
Rectangular Area Clear from any Objects.
Beyond RWY, Above its Extended Centerline, Under A/P Authorities,
Might Not be a Load-bearing Surface (Rigid).
Min. Width of 500 feet,
Upward Slope not exceeding 1.25%
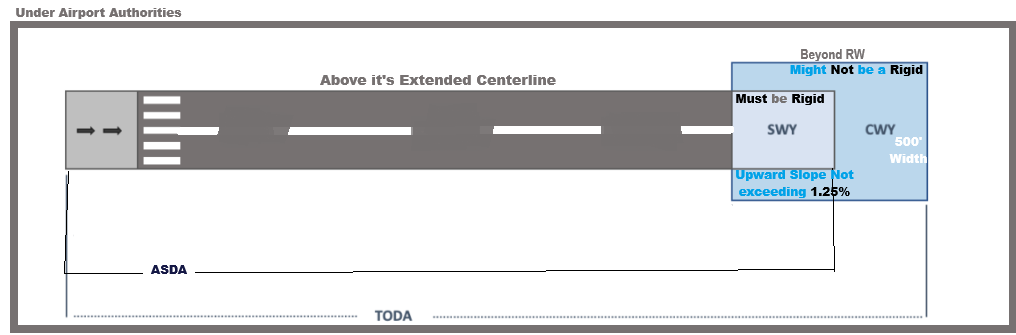
Takeoff Distance Available (TODA)
Runway length + Clear Way
Stopway
Prepared rectangular Area Beyond RWY, Above its Extended Centerline, Under A/P Authorities,
Must be Rigid surface.
As Wide As RWY,
Increasing A/C’s Weight,
that’s Able to Support during Rejected T/O.

Accelerate-Stop Distance Available (ASDA)
Runway Length + Stopway
Minimum Airworthiness Takeoff Requirements
Available distances must be ≥ Required distances.
1. ASDR ≤ ASDA,
2. TODR ≤ TODA,
3. TORR ≤ TORA.
Balanced vs Unbalanced Field Length
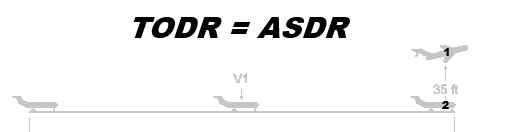
Balanced: TODR = ASDR (No clearway/stopway).
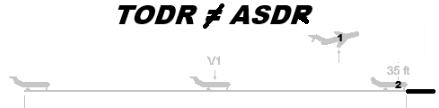
Unbalanced: TODR ≠ ASDR (Utilizes clearway or stopway).
Balanced Field Length
TODR=ASDR
Clearway or Stopway are 'Not Used'
Unbalanced Field Length (mtkawesa)
TODR ≠ ASDR
Clearway or Stopway Used
Climb Gradient
expressed in Percentage (%)
Height Gained to Horizontal Distance Traveled.
Used for: Obstacle Clearance
Height Gained / Horizontal Distance × 100.
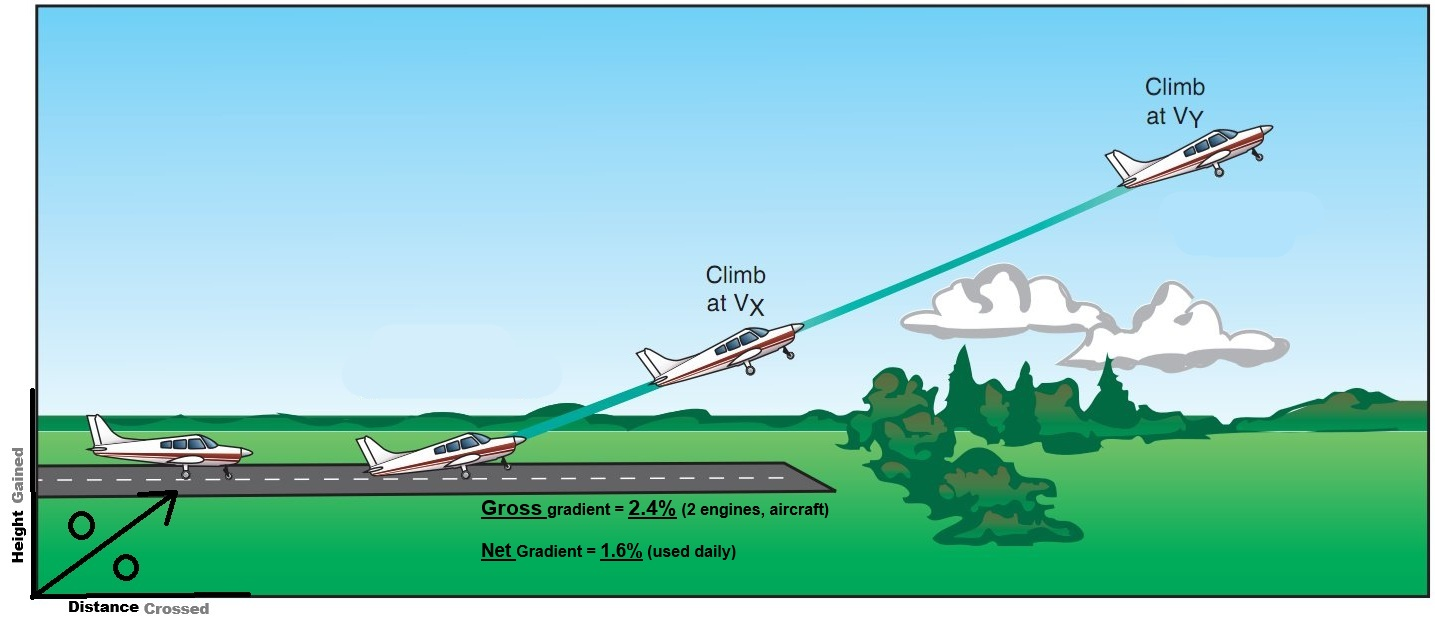
Factors Affecting Net & Gross Gradients
•Config. (Flaps Settings)
• ⇡V1 ; ⇣T/O Dis.
• ⇡V2 ; ⇡T/O Dis.
Takeoff Path
.Actual flight path from (35ft) to→at least (1,500ft) above T/O Surface in case of 😞E.F. @ V1 or
.Transition to En-Route climb, whichever is higher.
1st Sigment
From 35’ till Landing Gear Fully Retracted, @constant V2 speed
using
T/O Thrust + T/O Slats & Flaps,
with +ve Minimum Climb Gradient
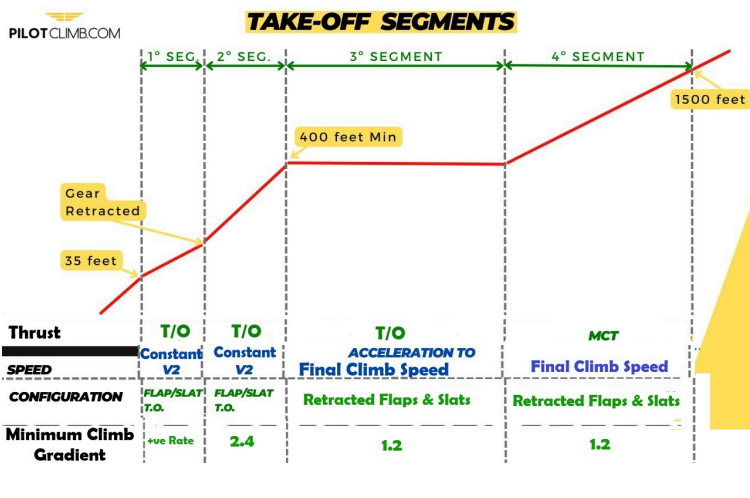
Second Segment of Takeoff Path
From Landing Gear fully Retracted to Min. 400 ft,
EgyptAir uses 800 ft, (Min. Acceleration Height)
@constant V2 speed
using
T/O Thrust, T/O Slats & Flaps,
2.4% Gross
1.6% Net
Min. Climb Gradient
Most limiting segment for weight.

Climb Limit
Maximum allowable takeoff weight that satisfies the minimum 2nd segment climb gradient requirements following an engine failure at or after V1 .
Third Segment of Takeoff Path
Begins at Min. 400 ft (EgyptAir uses 800 ft)
→Horizontal Distance to Accelerate to Final Climb Speed, using
T/O Thrust
while Retracting Flaps & Slats
1.2% Minimum Climb Gradient
Maximum height limited by engine-out thrust time limit→ 10 minutes.

Fourth Segment of Takeoff Path
From End of Third segment to
At Least 1500ft
@ Final Climb Speed using
MCT
Retracted Slats & Flaps (Clean Config.)
1.2% Minimum Climb Gradient

Approach Climb Gradient
2.1% for 2-engine A/C
@Approach Config.
Landing Gear Retracted
With an Engine Failure
Landing Climb Gradient
3.2% for all engines A/C
Full landing Config.
Landing Gear Extended
Without an Engine Failure
Minimum Takeoff Path Gradients (2-Engine) ‘Gross’ Segments
First : Positive,
Second: 2.4%,
3rd & 4th: 1.2%.
Approach.: 2.1%
Landing:3.2% (All Engines)
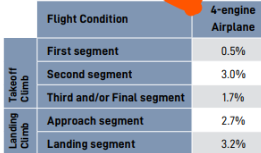
Minimum Takeoff Path Gradients (4-Engine) ‘Gross’ Segments
First : 0.5%
Second: 3%,
3rd & 4th: 1.7%.
Approach.: 2.7%
Landing:3.2% (All Engines)
Items Affecting T/O Performance
✅ Controllable Factors:
Config.: A/C & Wheel Brake
Engine Thrust Setting
Weight
❌ Uncontrollable Factors:
RWY:
Length (availability of a clearway or stopway)
Condition (wet, dry, slushy, snowy, smooth, or rough)
Environment (Temp. + PA + Wind)
& Obstacles in takeoff path.
Runway Slope Effects
Maximum Certified Slope Limit is ±2%
Downhill:
Faster acceleration → shorter TOD,
slower deceleration → longer ASD.
increases takeoff-limited weight if Not limited.
Uphill:
Slower acceleration → longer TOD;
faster deceleration → shorter ASD.
increases the allowable weight if Limited
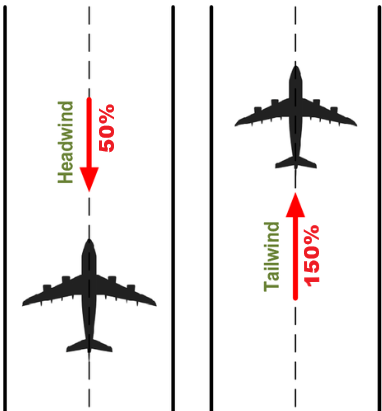
Wind Effects on Takeoff
For performance calculations, Regulations require;
Reported wind Component up to:
50%→Headwind and at least 150%→Tailwind.
Wind is Ignored when computing Net flight path
Headwind:
Reduces ground speed at V LOF → shorter TOD
improves braking → shorter ASD.
Tailwind:
Higher ground speed for V LOF → longer TOD
diminishes braking → longer ASD.
Wet and Contaminated Runway Performance
⬇V1 to provide more Stopping Distance, ⬆TOD
Screen height is reduced to 15 ft (instead of 35 ft).
If wet runway calculation allows higher weight than Dry
→More Limiting dry weight Must be Used.
Regulated Takeoff Weight (RTOW)
Maximum Takeoff Weight limited by:
Climb limit
Tire speed limit
Runway limit
Brake energy limit
Obstacles limit
Structure limit
Aircraft Structure Limit
Max Weight of A/C Structure certified to sustain at T/O ,
Approved by Manufacturer
Certified by CAA
Runway Limit
Max T/O Weight permitted by Available Runway Length, determined by the most limiting of:
TODR (All Engines) ≤ 115% Runway Length Available
TODR & ASDR(E.F.@ V1) ≤ Runway Length Available
ASDR (E.F.@ V1) ≤ ASDA
Runway Limit determined by Most Restrictive of the Three Criteria.
Tire Speed Limit
Max T/O Weight limited by Max Rated Tire Speed, as specified in AFM (Airplane Flight Manual).
Brake Energy Limit
Max T/O Weight limited by VMBE (Max Brake Energy Speed)
Highest Speed from which a Rejected T/O can stop A/C without Exceeding Brake Energy Capacity
Obstacle Clearance Limit
Max T/O Weight ensuring Safe Obstacle Clearance in Departure Path,
based on Net Flight Path Gradient.
Gross vs Net Gradient
Gross→Actual performance demonstrated by Manufacturer, required by Regulations, real aircraft capability without safety margins.
Net→Used Daily, Gross Reduced to ensure;
Obstacle Clearance.
account for Operational Variables
2-Engine: Net = Gross - 0.8% reduction (e.g., 2.4% - 0.8% = 1.6%).
2-engines: 0.8%,
3-engines: 0.9%,
4-engines: 1.0%.
Net flight path must clear all obstacles by at least 35 ft.
Obstacle Clearance Limit based on: Net flight path Gradients
Factors Affecting Net & Gross Gradients
•Config. (Flaps Settings)
• ⇡V1 ; ⇣T/O Dis.
• ⇡V2 ; ⇡T/O Dis.
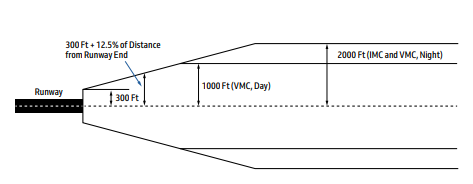
Departure Sector (Buffer Area)
Defined airspace Clearing Obstacle, Starting at→Runway End.
where→(Gross & Net Gradients Applied)
Initial Width→300’ each Side;
Limitations:
Divergence° (Angle)→7.1°
Divergence% (Percentage)→12.5% of Dis.
Max Width VMC🔆: 1,000’ total (2,000’→Bank>15°).
Max Width IMC🌑: 2,000’ total (3,000’→Bank>15°).
Flap Setting Compromise
Large Flaps:
More lift → higher runway-limited weight;
more drag → reduced climb gradient (climb-limited).
Small Flaps:
Less drag → improved climb gradient
less lift → requires higher speed → likely runway-limited.
Optimum T/O Flaps Settings
Compromisation between 2 values
if Runway's the problem, More flaps are useful.
if it’s Climb Gradient, Fewer flaps are useful.
V1 and V2 Effects
V1 Affects→TOD/ASDR, But Not→Climb Gradient.
Higher⬆V2: Improves→Climb Gradient, But⬆Increases→TOD
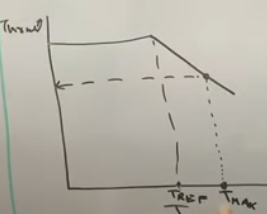
Flat Rated Power
Max. Thrust Output based on Ambient Temp.
Provided by Engine (Thermally Limited not Mechanically)
based on HPT Blade Temp. limits.
High-Pressure Turbine (HPT) Blade Temperature Limit
Maximum temperature HPT blades can tolerate without structural damage which Risks:
• Melting
• Cracking
This limit determines engine flat-rated thrust
Tref→HPT
Highest Reference Temperature engine can provide Flat rated power.
Power starts to Decrease After, due to Temp. increase
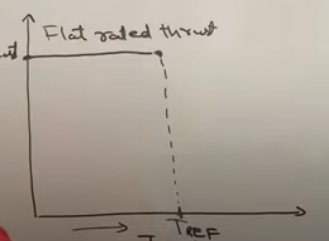
T MAX→TIT
Max. Temp. at which the engine Can provide Thrust.
Above it→Turbine Inlet Temperature (TIT) Exceed Safe Limits.
Engine’s Thrust
Pushing force exerted by A/C’s Engine
Affected by: (ptha)🏠
1.Pressure→α
2.Temperature→1/α
3.Humidity→1/α (slight/negligible)
4.Airspeed→α (Ram Recovery)
Environmental Factors on Thrust
-Press.⬆→Density⬆→Mass Airflow⬆ →Higher Thrust⬆
-Temp⬆→ Density⬇→Mass Airflow⬇ → Lower Thrust⬇
-Humidity⬆→Density⬇→ slight/negligible ⬇ in Thrust.
-Speed⬆→Ram Recovery⬆→inlet Density⬆→ higher thrust⬆
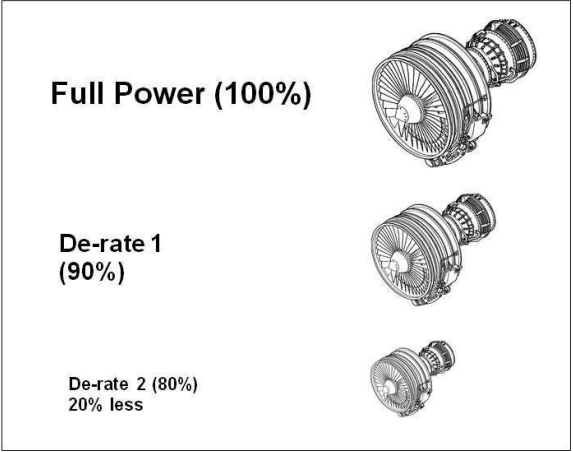
Reduced Takeoff Thrust
Allowed by Regulations, but:
Must not exceed 25%
Min.= 75% of Full-Rated takeoff thrust
Two methods
-(ATM) for Boeing
-(Flex) for Airbus
De-rate
Reducing Cost by:
⬇Stress on Turbine,
⬆Engine Life & Fuel Efficiency
(FLEX) Flexible temperature (Airbus)
ATM Assumed Temprature Method Boeing
Imputting Fictional (Higher) Temp.
Limiting Actual T/O Thrust
but VMCG calculated based on Full Rated Thrust
D-Rate for Boeing
Replacing→Full Rated engine with Lower Pre-Defined Thrust→Diff. Engine
via FMC.
Lower Thrust → Lower Yawing Moment incase of (E.F.) → Lower ⬇VMCG
Lower Thrust →⬇Turbine Temp. →⬆Engine Life.
Difference from ATM/Flex: VMCG based on Reduced Thrust,
Not Full-Rated Thrust.
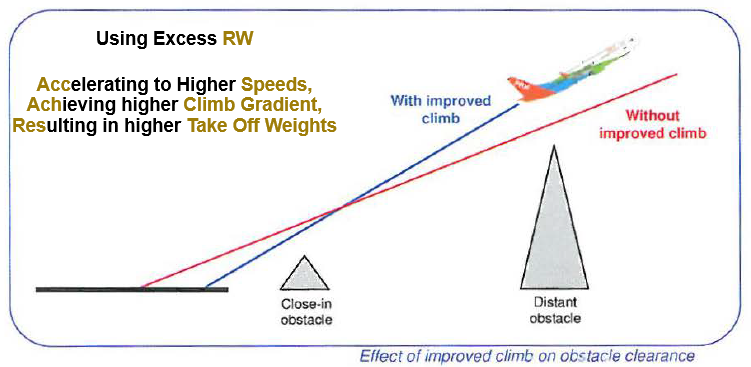
Improved Climb Performance
Using Excess RW
Accelerating to higher Speeds,
Achieving higher Climb Gradient,
Resulting in higher Take Off Weights
(better climb gradient to lift a weight restriction on Hot days)
Engine Thrust Ratings
Takeoff/Go-Around: typically 5 minutes (10 min)
MCT: highest setting usable Indefinitely
Max Climb Thrust: typically Below MCT (except @ High Altitudes)
Take/Off Thrust
Maximum Thrust Engine Can Produce for
5 min Limit (some 10 min)
mainly for Operating Engine after Engine Failure
Time must be Monitored.
Go/Around Thrust
same as maximum takeoff thrust,
with the higher speeds during go-around
Same Time Limit as T/O Thrust.
Maximum Continuous Thrust
Highest Thrust usable Indefinitely.
used after (Emergencies): Engine Failure in Climb/Cruise
Maximum Climb Thrust:
Used in: Normal Climb / Step Climb / Acceleration to Cruise,
Below MCT (may equal MCT above ~15,000 ft)
Climb Performance
Angle of Climb→Altitude per Distance (For→Gradient),
Rate of Climb→Altitude per unit Time
Best Angle used for distance constraints;
Best Rate used to minimize time to cruise.
Regulatory constraint:
• 250Kt below 10,000’ (Constrained Speed)
• 300Kt until Switching to Mach Number
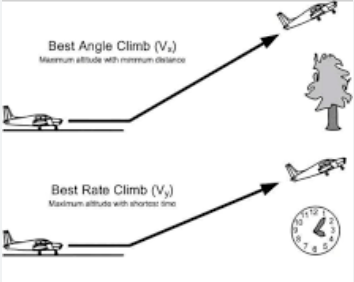
Best Angle Of Climb 'Vx'
Speed @ which Shortest Distance is required for reaching a Specific Altitude.
used when: Constraint→ATC clearance
such as Crossing a Point at or above a Certain Altitude.
Best Rate Of Climb "Vy"
Speed @ which Shortest Time is required for reaching a Specific Altitude.
used when Constraint→Time, such as: Traffic Separation.
Climb Speed Schedule
FMC / QRH procedure for Normal / Abnormal / Emergency climb:
250 KIAS below 10,000 ft, then
Accelerate to Climb Speed (~300 KIAS or Mach),
Maintain Constant KIAS, then
Transition to Constant Mach above ~26,000 ft.
dominated by:
Economic Considerations
balancing Flight Time
Operating Costs
Fuel Consumption
In case of Emergency from
Initial Climb —> Top of Climb (TOC)
• 250Kt below 10,000’ (Constrained Speed)
• 300Kt until Switching to Mach Number (above ~26,000 ft)
Cruise
From Top Of Climb to Top Of Decent (TOC→TOD)
Main pilot's Task in this phase is Saving Fuel as much as possible
Maneuver Margin
Safety Buffer between Low-speed & High-speed buffet.
Altitude increases → air density decreases → maneuver margin reduces.
• as Load factor & Alt.⬆→Maneuver margin⬇️
This margin dictates
Available bank angles
turn capabilities
Load Factor (G-Factor)
Ratio between Total Aerodynamic Force acting on A/C to Actual Weight of it.
Straight-and-level flight=1.0 G
30° bank ≈ 1.15 G
40° bank ≈ 1.3 G
Equivalent Weight
Effective weight wings must support→actual weight multiplied by the load factor.
Equivalent Weight = Actual Weight × Load Factor
Buffet Boundaries
Low & High speeds for Initial Buffets
@ Any Given Altitude & Weight
Low-Speed: Airspeed decrease → AoA increase → airflow separation → buffet → stall.
High-Speed: Speed approaches critical Mach → shockwaves form → turbulent airflow separation → buffet.
Aerodynamic Ceiling (Coffin Corner)
Altitude where low-speed and high-speed buffet boundaries Converge.
Maximum achievable load factor is 1.0 G
Zero margin for maneuvering.
Cruising above the optimum altitude
-Reduce flight Safety & Maneuverability: Lower load factor limits the ability to deviate around weather.
-Greater Turbulence Vulnerability: Aircraft is less able to withstand Vertical Gusts.
-Thunderstorm risk: Tops & Anvils extension Above jet cruise altitudes, making Avoidance Difficult.
-Reduces fuel efficiency (range per fuel).
Endurance ‘How Long You Last?’
Maximum Time Engine can Operate on Given Fuel quantity.
Best endurance speed
Speed Resulting in Min. Fuel Flow