Economic Development for IR Final
1/32
There's no tags or description
Looks like no tags are added yet.
Name | Mastery | Learn | Test | Matching | Spaced | Call with Kai |
|---|
No analytics yet
Send a link to your students to track their progress
33 Terms
Factor accumulation
Increasing the size of the capital stock or labor force
(more people/more stuff)
Productivity growth
Increasing the amount of output produced by people/machines through:
efficiency
technology
Efficiency gains
Using the existing capital and labor more efficiently
Make more stuff with the same amount of labor
MOVES YOU UP THE CURVE
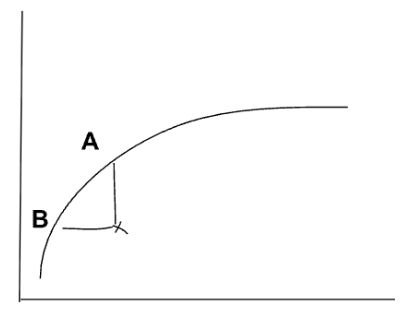
Technological change
Get new technologies to make things faster
MOVES THE CURVE OUT
Characteristics of rapidly growing countries
Macroeconomic and political stability (good for growth)
Investments in health and education
Effective governance and institutions (strong rule of law)
Favorable environment for private enterprise (low regulations)
Trade, openness and growth (trade = higher growth)
Favorable geography (temperate zones, less malaria, natural disasters)
Harrod-Domar Growth Model
Assumes excess labor is always available
Formula: g = (s/v) – d
→ the key drivers of growth are savings rate (s) and productivity of capital (v), minus the depreciation rate, of course. In other words, if you save more and make productive investments then your economy will grow (g). If you increase savings (s) then you will increase g (growth), no labor to worry about
→ Incremental capital-output ratio (ICOR → K/Y) – determine the impact of an additional/incremental unit of capital
STRENGTHS:
Simple
minimal data needed
reasonable estimations w/o economic shocks
WEAKNESSES:
Implies that savings is sufficient for growth
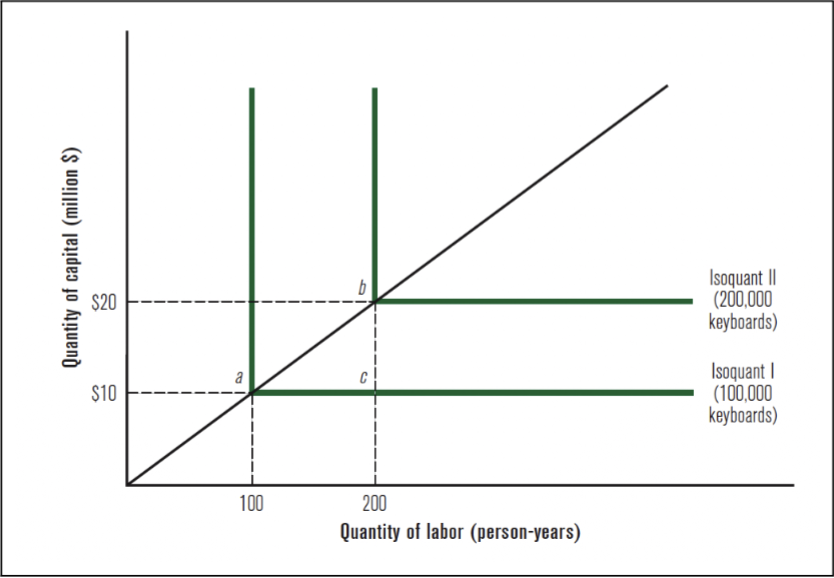
Rigid assumptions of fixed capital to labor, capital to output, labor to output ratios (NO economic shocks)
Does not allow for substitution between labor/capital, which is unrealistic
L-shaped isoquants bc this model took the L :(
Easterly’s criticism of H-D
Easterly argues that the World Bank still uses the H-D model to calculate “financing gaps” / estimate how much foreign aid to give to achieve target growth rates. This is bad b/c the model is too simplistic
Solow-Swan Growth Model
Formula: ∆k = sy - (n + d)k
→ Change in capital per worker = savings rate per worker - population growth and depreciation rate
STRENGTHS:
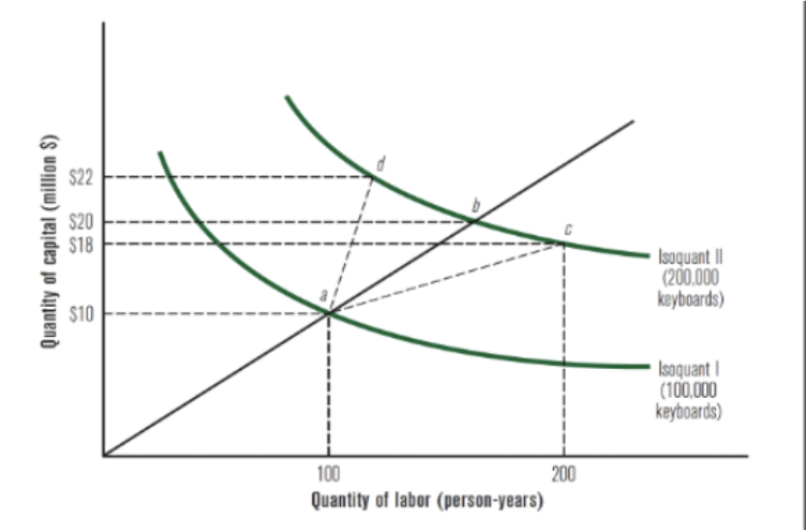
More flexibility for substitution
Importance of factor accumulation (more stuff) but also adds diminishing marginal utility – more realistic
More accurate to reality
WEAKNESSES:
Assumes long-term growth is exogenous (does not account for new tech development within the country)
Implies that countries with low GDPs will grow at higher rates than high-GDP countries (not true)
Curved isoquants b/c this model took the W :)
Capital Deepening (Solow model)
Occurs if the change in capital per worker is positive (+∆k). This occurs when savings per capita (sy) is larger than pop. growth + depreciation (n+d)k → then capital per worker increases.
Capital Widening (Solow model)
Occurs when savings per capita (sy) is exactly the size of pop. growth + depreciation (n + d)k → then capital per worker is unchanged
Unconditional Convergence
The Solow growth model predicts that countries will converge all at the same point – wherein all countries share the same steady-state and key model parameters.
NOT REALISTIC
Conditional Convergence
where each country has its own steady state and therefore its own model parameters → low-income countries have the potential for rapid growth, if they can attract investment and if that new investment pays off with a large increment in output
REALISTIC
Basic Growth Model formulas
Y = F (K,L) → aggregate production function
Y = total output, K = capital stock, L = labor supply
means the total output of an economy is a function of the capital stock and labor supply.
S = sY → savings
S = the total savings, s = the average savings rate of the economy
S (savings) = I (investment) in a closed economy
∆K = I - (dK) → capital
∆K = the change in capital stock, I = investment, d = constant rate of depreciation (depreciation occurs naturally), dK = the decrease in capital stock each year due to depreciation
means if you want to grow your capital (increase in ∆K) , the rate your saving (S=I) would have to be larger than the rate your capital is depreciating (dK) or your capital stock (K) is going to get smaller and smaller.
∆L = nL → labor force
∆L = change in labor force, n = population growth rate, L = labor force (across economy)
means population growth rate is equal to the change in the labor force because the assumption in economic models is that everyone in a population is a worker / labor force grows exactly as fast as population growth.
∆K = sY - dK → FINAL GROWTH MODEL
means the change in your economy-wide capital is equal to your savings/investment rate (remember, S=I) minus how much capital you’re losing each period (remember dK is how much capital you had times the depreciation rate).
Endogenous Growth Models – Lucas
In neoclassical growth models (H-D & Solow), capital should flow from rich countries to poor countries, because there is more potential for growth at the beginning and returns to capital are higher. In reality, there is capital flight from low-income countries to high-income countries.
Exogenous vs. Endogenous Growth Models
EXOGENOUS:
Harrod-Domar (long-run rate of growth is determined by the savings rate)
Solow-Swan (long-run rate of growth is determined by the rate of technical progress)
ENDOGENOUS:
Lucas (focus on production of new technologies and human capital as defining features)
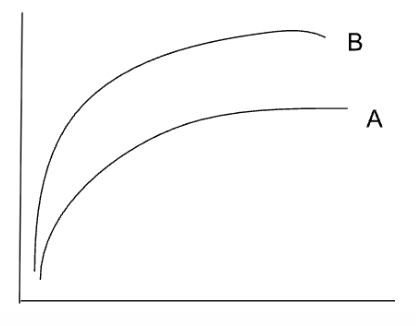
What spurs agricultural growth?
Increased inputs (land, water, labor, capital) → diminishing returns. Moves up the curve
Increased efficiency (use existing tech & inputs) → better than inputs. Moves up the curve
Technological change → turns same amount of inputs into MORE outputs. Moves the curve out
Green Revolution
World hunger crisis in the 1960s
Lots of investments and technologies in Latin America and Asia.
Modern rice and wheat varieties are created
Irrigation expanded, fertilizer/pesticides created (subsidies)
Investments in roads/rural power
Policies to support farm credit/education/extension and better markets
Result: urban poor win, rural poor (farmers) lose
Result: Areas that can’t grow rice/wheat (Africa, Middle East) lose
Technology Treadmill
A cycle where farmers must constantly adopt new technology to reduce production costs and stay competitive.
Early adopters profit, but widespread adoption lowers market prices, erasing gains and forcing farmers to adopt newer tech, leaving lagging/poorer farmers behind.
Structural Transformation
The reallocation of economic activity across the broad sectors of the economy (typically from agriculture → manufacturing and services, rural → urban)
Labor Surplus Model or Lewis Model or Dual-Sector Model
2 sectors, agriculture (low wage, low productivity) and manufacturing (high wage, high productivity)
High-wage manufacturing draws rural farmers to urban centers for factory jobs
Profits made from industries get reinvested, increasing capital and labor opportunities and increasing economic growth
Transfer of labor from rural → urban is exhausted, causing rising wages for rural and urban workers
Externalities
a side effect or consequence of an industrial or commercial activity that affects other parties without being reflected in the cost of the goods and services involved
(can be positive or negative)
Pigouvian Tax
Tax set equal to the external cost of that activity (ex: per unit of pollution), raising private cost to equal social cost.
PROS:
Induces producers/consumers to reduce harmful activity
Corrects negative externalities
Raises gov revenue
CONS:
Taxes are politically unpopular
May be regressive
Difficult to assess cost of externality
Rivalry
Consumption of a good will reduce available amounts of the good for others
Excludability
One can exclude others from access to the good
Private Goods
Rival and Excludable (ex: lunchbox)
Public Goods
Non-Rival and Non-excludable (ex: clean air)
Club Goods
Non-rival and Excludable (ex: private parks)
Common Pool Resources
Rival and Non-excludable (ex: fisheries)
Tragedy of the Commons
Multiple individuals – acting independently and rationally consulting their own self-interest – will ultimately deplete a shared limited resource, even when it is clear that it is not in anyone’s long-term interest for this to happen. – Hardin
Policy Options (for tragedy of the commons)
Property Rights
Government Regulation
Taxes and Subsidies
Payment for Environmental Services (PES)
Informal Regulation
Food Security
“All people at all times have physical, social, and economic access to sufficient, safe, and nutritious food that meets their dietary needs and food preferences for an active and healthy life”
4 Pillars of Food Security
Availability → Food must be available in sufficient quantities. (Supply)
Access → People must be able to regularly acquire adequate quantities of food. (Demand)
Utilization → Consumed food must have a positive nutritional impact.
Stability → Must be able to maintain access and utilization over time, through lean seasons, disasters, price spikes, etc.
Climate change solutions
Reduce emissions (from transportation, energy, and manufacturing)
Change diets (eat less meat esp. cattle)
Remove carbon from the atmosphere (save forests, use less land, waste less)