PSYCH 211 Test #3
1/63
There's no tags or description
Looks like no tags are added yet.
Name | Mastery | Learn | Test | Matching | Spaced | Call with Kai |
|---|
No analytics yet
Send a link to your students to track their progress
64 Terms
Nominal
category or name; mathematically arbitrary (no math just a response of term, name, or assigned number). Where are you from? SSN? Most independent variables are nominal
Ordinal
rank; order. Relative meaning, but not absolute meaning. 1st, 2nd, 3rd. No mathematical meaning. Rank different fruits. Placement in a race
Interval
Actual amounts, units of measurement. The space between two adjacent scores are equal, but not true zero. Zero can act as a midpoint on a test and not a failure or nothing. Zero does not mean lack of the thing. Excited or calm with neutral as a middle. Rate happiness on a scale of 1-10. What time do you got to sleep?
Ratio
Interval but has an absolute zero point that means lack of something. Can not go negative. Can make ratio statements. How much time do you spend on your phone per week? How many siblings do you have? Independent variables can be this if you were talking about giving dosage of a drug
Sample Size
(N) The number of individuals in the sample
Experiment
used to support causal claims. One variable is manipulated and the other is measured
Manipulated variable
The independent variable. Variables that are being manipulated
Measured variable
The variable that is measured. Dependent variable.
Independent variable
The manipulated variable
Condition/level
an independent variable’s levels
Dependent variable
the measured variable, or outcome variable
Control variable
any variable that an experimenter holds constant on purpose
Comparison group
A group in an experiment whose levels on the independent variable differ from those of the treatment group in some intended and meaningful way. Also called comparison conditions
Control group
a level of an independent variable that is intended to represent “no treatment” or a neutral condition
Treatment group
the other conditions
Placebo group
when the control group is exposed to an inert treatment such as a sugar pill; also known as a placebo control group
Confound
when there are several possible alternative explanations or potential threats to internal validity
Design Confound
an experimenter’s mistake in designing the independent variable; it occurs when a second variable happens to vary systematically along with the intended independent variable
Systematic variability
Differences across the conditions of the IV; due to Individual differences, The effect of our IV, A design confound (aka confounding variable)
Unsystematic variability
Individual differences but not specific to or aligned with IV (occurs both within and across conditions)
selection effect
occur when the method of selecting participants or groups leads to a sample that does not accurately represent the target population
random assignment
randomly assigning participants to groups in a study
Matched groups
separate groups of people but matched on traits that are important
Independent-groups design
between-subjects. Pros → no order effects; lower demand characteristics (participants feel the need to respond differently; good subject effect, expectancy effect)
Cons → need more participants; selection effects: Random assignment doesn’t always work to avoid confounds
Within-groups design
repeated-measures. Pros → needs fewer participants to find a significant effect; Conditions are guaranteed to be equivalent (re: Ps) because you are testing the same person each time
Cons → order effects; higher demand characteristics
Posttest-only design
also known as an equivalent groups, posttest-only design, is one of the simplest independent designs
Randomly assigned to independent variable groups and are tested on the dependent variable once
Pretest/Posttest Design
or equivalent groups, pretest/posttest design, participants are randomly assigned to at least two groups and are tested on the key dependent variable twice—once before and once after exposure to the independent variable
Repeated-measures design
a type of within-groups design in which participants are measured on a dependent variable more than once, after exposure to each level of the independent variable
Order effect
biases caused by the sequence in which participants experience experimental conditions, rather than the treatments themselves
Practice effect
a long sequence might lead participants to get better at the task with some specific order effects due to repeated testing
Fatigue effect
people get tired or bored toward the end with some specific order effects due to repeated testing
carryover effect
some form of contamination carries over from one condition to the next
Counterbalancing
they present the levels of the independent variable to participants in different sequences
Demand characteristics
subtle cues in an experiment that allow participants to guess the researcher's hypothesis, causing them to change their natural behavior to fit that expectation
Descriptive statistics
Used to measure the numbers and compare in one set of data. Not to make inferences outside of the set.
Data matrix
a rectangular, two-dimensional grid used in research to organize information, where rows represent cases or observations and columns represent variables or attributes
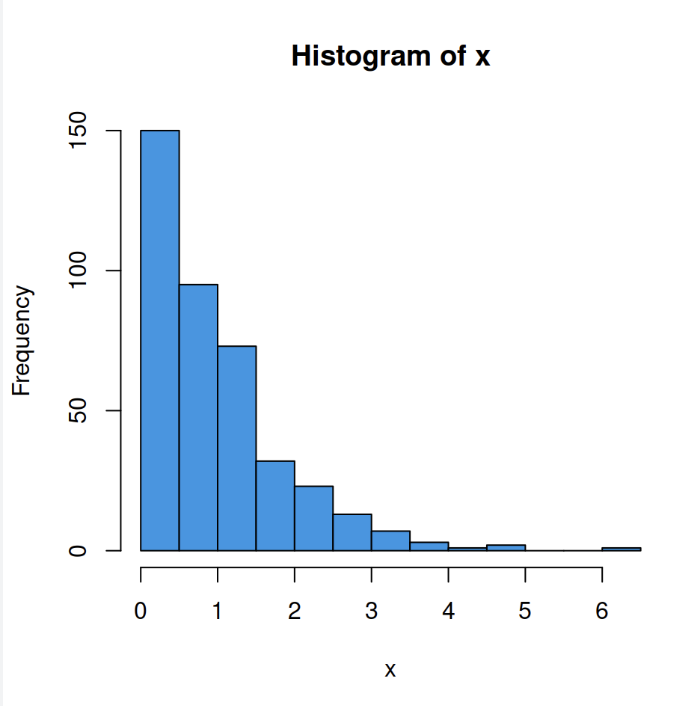
Frequency histogram
Normal distribution
scores in the middle are much more frequent
skewed distibution
One pronounced tail, more scores on one side than the other. Not symmetrical
positively skewed
Less at the end loaded at the beginning (Tail points greater)
negatively skewed
Less at the beginning loaded at the end (Tail points less)
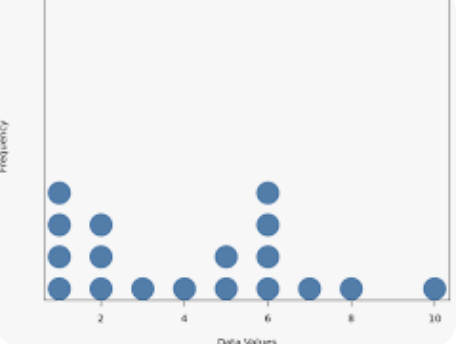
Dot plot
a simple data visualization that displays numerical data points as dots on a graph, typically along a single axis (number line) to show frequency, distribution, and outliers
Central Tendency
the peak(s) of the data set.
Mode
score that occurs most frequently. Mostly used with nominal data, but is sometimes used with numerical data in cases where an uncommon amount of one score is present
Exists where the peak is the highest in a normal distribution
Bimodal
two peaks/clusters.
Median
The middle score in a set of data. the middle score when you line up all the scores from lower to highest (has to be numerical [ordinal]).
Used for abnormal distribution. Used with ordinal/interval data
Exists where the peak is highest in a normal distribution
Mean
The average. Add up all scores and divide. Used with ordinal/interval data. Normal distribution is centered around the mean.
Range
From the lowest score to the highest score. Highest score minus lowest score
Interquartile range
Find the median. Find half between the median and the beginning. Find half point from the median and the end. This splits into 4 quartiles. Interquartile range only considers the number in the first quartile and the third quartile as the relevant data. 3Q-1Q= IQR. Distance between third and first quartiles
Variance
Quantify the amount of deviation of the scores compared to the mean. Average of the SQUARED deviations around the mean. SD^2 = (Sigma(X-M)^2)/N. Everything in the parentheses is called the sum of squares. SD^2 is the symbol for variance
Standard deviation
Transforms the variance to avoid certain interpretational problems. Literally just take the variance and throw the square root on the answer. SD=v/SD^2. Gets rid of the issues. Puts it into units of standard deviation making it easier to compare data sets
Deviation score
How much do the scores in the data set deviate from the mean. Take every possible score and subtract the mean. Anyone who scores the mean has a deviation score of zero
box plot
visually summarizes data distribution using a five-number summary: minimum, first quartile (Q1), median, third quartile (Q3), and maximum
outlier
on the tails of the distributions.
Z-Score
z= (x-m)/SD
Relative standing
Compare scores within and across distributions. Is the score to the right or left of the mean? How far away from the mean? Z-score transformation
Correlation coefficient (r)
The degree of association
Equation: r= (Sigma[ZxZy])/N
Scatterplot
plots all values down on a graph to determine association
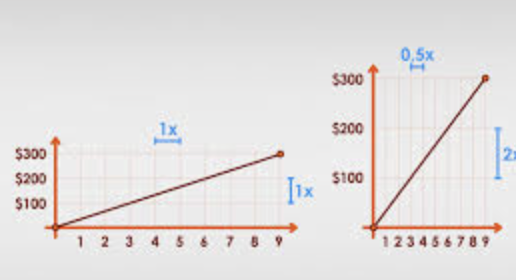
Linear relation
a statistical association between two variables that forms a straight line when graphed. It signifies that for every unit change in one variable, the other variable changes at a constant, proportional rate
Positive association
x goes up y goes up /
Negative association
x goes up y goes down \
Zero association
occurs when there is no association or correlation between variables
Bar graph
(Histogram) with score/measurement on X and frequency on Y
Line graph