Macroeconomic Review
1/141
There's no tags or description
Looks like no tags are added yet.
Name | Mastery | Learn | Test | Matching | Spaced | Call with Kai |
|---|
No analytics yet
Send a link to your students to track their progress
142 Terms
GDP
The market value of all final goods and services produced within a country in a year.
GDP formula (as total spending)
Y= C+I+G+NX
“Value Added” Formula for GDP
Sum of value added + Total sales - Cost of intermediate outputs
Gross Domestic Income Formula for GDP
Total wages + Total profits
Limitations of GDP
1. Prices are not values
2 Nonmarket activities are excluded
3. The shadow economy is missing
4. Environmental degradation isn't counted
5. Leisure doesn't count
6. GDP ignores distribution
Nominal GDP
Adds up the market value of total production in a year using the current prices prevailing in that year.
Real GDP
Excludes the effects of price changes, so it isolates economic growth that's due to changes in the quantity of output produced.
Change in real GDP formula (percent)
Percent change in nominal GDP - percent change in prices
Four Strategies for Scaling Big Numbers
1. Evaluate what it means per person
2. Compare big numbers to the size of the economy
3. Compare big numbers to their own history
4. Use the Rule of 70 to evaluate long-run growth rates
Rule of 70
Years it takes something to double = 70/Annual growth rate
Inflation
A generalized rise in the overall level of prices.
can also be described as a rise in the cost of living.
also a decline in the purchasing power of money.
Consumer Price Index (CPI)
tracks the average price consumers pay over time for a
representative "basket" of goods and services.
Steps to measure inflation
1. Find out what people buy and construct a representative basket of goods and services.
2. Collect prices from the stores where people do their shopping.
3. Tally up the cost of the basket of goods and services.
4. Calculate rate
Inflation rate formula
=price level this year-price level last year/ price level last year X 100
Real Variable
A variable that has been adjusted to account for inflation
Nominal Variable
A variable measured in dollars (whose value may fluctuate over time)
Inflation Adjustment Formula
Todays Dollars = Another times dollars X Price level today/Price level in another time
Inflation Adjustment: Formulas for relatively small percentage changes
Percent change in real value = Percent change in nominal value - Percent change in prices
Real interest rate = Nominal interest rate - Inflation rate
Money illusion
The (mistaken) tendency to focus on nominal dollar amounts instead of inflation-adjusted amounts.
creates nominal wage rigidity (reluctance to cut nominal wages).
Different Measures of Inflation: Consumer Prices
1. Cost of living adjustments -> Consumer Price Index (CPI)
2. A less-volatile inflation measure -> CPI-Median
3. Forecasting underlying inflation trends -> Core inflation (excluding food and energy)
Different Measures of Inflation: Business Prices
1. Cost of input—→ Producer Price Index (PPI)
2. Estimating the price of all output and hence real GDP → GDP deflator
Inflation Overstates the Cost of Living Because of ...
Unmeasured quality improvements
New products
Substitution bias
Money
Any asset regularly used in transactions
Medium of exchange
Unit of account
Store of value
Costs of (expected) Inflation
Menu costs for sellers
Shoe-leather costs for buyers
Costs of (unexpected) Inflation
Confuses the signals that prices send
Redistribution
Menu Costs
the expenses and resources companies incur when changing their nominal prices
(such as reprinting menus)
Shoe Leather Costs
the time, effort, and resources people waste managing their money to combat high inflation,
The Inflation Fallacy
The (mistaken) belief that inflation destroys purchasing power
Economic Growth
Increased production of goods and services, leading to rising living standards.
Ingredients of Economic Growth
labour input
human capital
physical capital
Labour input
Number of workers to transform raw materials into products and services that people want to buy.
Human capital
The skills and knowledge of people developed through education, practice, and training.
Physical capital
The total amount of tools, machinery, and structures that
can be used in the production of goods and services.
Technological progress
New methods for using existing resources to produce more valuable output.
increases GDP per person for any level of capital per person
relies on new ideas
Production function
The methods for transforming labour input, human capital, and physical capital into goods and services (outputs).
Constant returns to scale
Doubling all inputs (labour input, human capital, and physical capital) leads to a doubling of all the outputs.
Diminishing returns
When one input (labour input, human capital, or physical capital) is held constant, increases in the other inputs will, at some point, begin to yield smaller and smaller increases in output
Why ideas generate unlimited growth
can be freely shared
don’t depreciate with use
may promote other ideas
Catch-up growth
The rapid growth that occurs when a relatively poor country (with low capital stock) invests in its physical capital
Why institutions matter for economic growth
They provide the framework that creates the right incentives for people to invest in physical and human capital and generate new ideas and products.
Property rights
Without this and a trusted enforcement system, no one creates wealth.
Government policy to encourage innovation
can support development of new ideas by:
1. Increasing the marginal benefit through intellectual property laws
2 Decreasing the marginal cost by subsidizing research and development
Income inequality
The difference in annual income between people.
Alternative measures of inequality
Permanent income
Inequality of opportunity
Wealth
Consumption
Permanent income
Your average lifetime income
Inequality of opportunity
Lack of intergenerational mobility
Poverty line
An income level, below which a family is defined to be in poverty.
Absolute poverty
Judges the adequacy of resources relative to an absolute standard of living.
Relative poverty
Judges poverty relative to the material living standards of your contemporary society.
Government Redistribution: Social Safety Net
The cash assistance, goods, and services given to those at the bottom of the income distribution.
Means-tested -- > Eligibility is based on income and sometimes wealth.
Minimal support -> lifts about a third of people living in poverty out of poverty. Increased child benefits have cut child poverty in half.
Government Redistribution: Social Insurance
Government-provided assistance against bad outcomes such as unemployment, illness, disability, or outliving your savings.
Benefits are based on uncertain outcomes
Everyone pays into social insurances
Benefits are based on past earnings
Government Redistribution: Taxes
Pay for the safety net and social insurance.
Progressive taxes
those with more income tend to pay a higher share of their income in taxes.
Ex. Federal income taxes, however
Investment gains are taxed at a lower rate
Higher income people get bigger tax breaks
Investment
Spending on new capital assets that increase the economy's productive capacity
the flow of new purchases of capital that add to stock.
Capital Stock
The total quantity of capital at a point in time.
declines over time due to depreciation, which includes wear and tear, obsolescence, accidental damage, and aging
Tools to Analyze Investment
Compounding: Helps you calculate how money grows over time when you leave it to accumulate interest in the bank.
Discounting: how much money in the future is worth today.
Compounding formula
Future value in t years = Present value × (1 + r)t
Discounting Formula
Present value = Future value in t years X 1/(1 + r)t
Interest rate
The rate of r cents per dollar (use the real r for real values and nominal r for nominal values).
*the rate of return you could get from investing your funds in your next best alternative
Rational Rule for Investors
Pursue investment opportunity if:
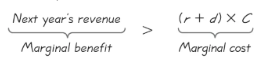
Depreciation Rate (d)
The proportion of an investment's remaining productive capacity you lose each year due to ___.
Market for Loanable Funds
the market for the funds used to buy, rent, or build capital
Supply Shifters in the Market for Loanable Funds
changes in personal saving rates
government saving
foreign savings
Demand Shifters in the Market for Loanable Funds
technological advances
expectations
corporate taxes
lending standards and cash reserves
Consumption
Household spending on final goods and services.
Marginal propensity to consume (MPC)
The fraction of each extra dollar of income that households spend on consumption.
MPC formula
Slope = change in consumption / change in income
Saving
The portion of income that you set aside, rather than spending on consumption.
= Income - Consumption
The Rational Rule for Consumers
Consume more today if:
the marginal benefit of a dollar of consumption today is greater than (or equal to) the marginal benefit of spending a dollar-plus-interest in the future.
Permanent Income Hypothesis
The idea that you choose how much to consume based on your permanent income (your best estimate of your long-term average income) rather than current income.
Consumption smoothing
The idea that you should maintain a steady or smooth path for your consumption spending over time.
Hand to Mouth Consumers
households that spend all their available income in every pay period, holding little to no liquid wealth (cash, savings)
Changing income
Causes a movement along consumption function
Shifters for consumption function
real interest rates
expectations of future income
taxes
wealth
Working age population
Noninstitutionalized civilians age 16 and over
Not in labour force
Neither employed nor unemployed
included in working age population
Labour force
working age population that either has a job or would like a job
included in working age population
made up of employed and unemployed people
Labour force participation rate
the share of the working-age population that is either employed or unemployed
Labour force participation rate formula
Labour force/Working age population X 100
Unemployment rate
The share of the labour force thats unemployed
Unemployment rate formula
unemployed/labour force X 100
Equilibrium unemployment rate
the unemployment rate to which the economy tends to return in the long run
Underemployed
Someone who has some work but wants more hours or whose job isn't adequately using their skills.
Discouraged searcher
Someone who wants a job but isn't counted as unemployed because they arent currently searching for work since they don't believe theyll find anything suitable.
Involuntarily part time
Someone who wants full-time work and is working part-time because they haven't found a full-time job.
Frictional Unemployment
Unemployment due to the time it takes for employers to search for workers and for workers to search for jobs.
Sources:
1. Job search resources
2 Skills mismatch
3. Employment Insurance and other income support
Structural Unemployment
Unemployment that occurs because wages don't fall to bring labour demand and supply into equilibrium.
Sources:
Efficiency wages: Higher wages paid to encourage greater worker productivity
Institutional causes:
Unions
Job protection regulations
Minimum wage law
Cyclical Unemployment
Unemployment that is due to a temporary downturn in the economy
Business cycle
Short-term fluctuations in economic activity. reflects the tendency for actual output to deviate from potential output (measured using the output gap)
Output gap
Actual output - Potential output/ Potential output X 100
Expansion
A period of rising economic activity
Recession
A period of falling economic activity
Features of business cycles
1. Business cycles are not cycles.
2. Recessions vary in their causes, their duration, and their depth.
3. Some variables lead recessions, while others lag.
4. The business cycle is persistent.
5. A typical business cycle involves a short, sharp
recession, followed by a long and gradual expansion.
6. Many economic variables comove up and down together over the business cycle.
Okun’s Rule of Thumb
For every percentage point that actual output falls below potential output, the unemployment rate is around one-third a percentage point higher.
Seasonally adjusted
Data stripped of predictable seasonal patterns.
Annualized rate
Data converted to the rate that would occur if the same rate had continued throughout the year.
Nominal variables
Variables expressed in dollars, using the prices of that year's data.
Real variables
Variables adjusted for inflation so you're comparing quantities, holding prices constant