ECON1102 - After mid-sem exam
1/36
There's no tags or description
Looks like no tags are added yet.
Name | Mastery | Learn | Test | Matching | Spaced | Call with Kai |
|---|
No analytics yet
Send a link to your students to track their progress
37 Terms
Explain how the types of gaps in the business cycle influnce the levels of unemploymnet in the economy and why
Expansaitonary gap
this is when the levels of unemployment in the economy is lowers than average as the economy is porducing above it’s potential output
Contractionary gap
occurs when the economy is producing belows its potential, and there is higher levels of unemployment as not all available labor is being utlized
What is unemployment called when the economy is opreating at it’s potential GDP and outline it
Natural rate of unemployment
Occur when there is only frictional and structural levels of unemployment
Cyclical levels of unemployment is 0
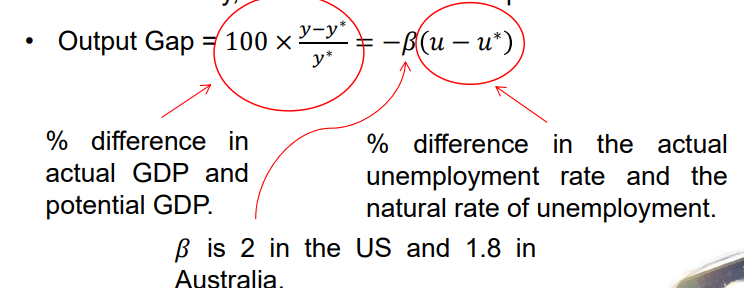
What is the purpose of Okuns law
it describes the loss or gain to the economy (output) through GDP from there being a change in unemployment whether that be a increase or a decrease.
State the output gap of Okuns law
Output gap = percentage change in GDP = -b(1.8) %difference in unemployment
Explain the change in GDP and calculate the cyclical unemployment
Unemployment (u) = 10.3%
Natural rate of unemployment (u*)= 8.08%
Potential gdp (r*) = $118 658.3 m
Cyclical Unemployment
= 10.3 - 8.08
= 2.22%
this is the cyclical unemployment amount
Change in GDP
= -beta (u - u*)
= - 1.8(always that in AU) (0.1030 - 0.0808)
= - 0.040 or -4%
Suggest actual GDP is 4% lower than the potential GDP of $4,746.33m (4% of potential GDP)
Australia is in a recession
Explain the types of unemployment during both cgaps
Contractionary gap
there is POSTIIVE cyclical unemployment
this is because not all of labor is being used and there is an excess since unemployment is lower than the natural rate
Expansionary gap
There is NEGATIVE cyclical unemployment
this is because labor is being used more intensively than normal and cannot be maintained so the unemployment rate is too low.
State the formula for planned aggregate expenditure in the economy
its called PAE so planned aggregate expediture
PAE = C^d + I^p + G + X
C^d = this is the amount of consumption that comes from importing something, so it’s C - M.
I^p = Planned investment
Explain the meaning of the planned investment and the acutal investmnet in terms of the keynsian model
Planned investment is the amount of investment that is expected to have been been invested e.g. if you have 100 shoes and expect to sell 50 shoes you have 50 shoes that are your planned investment
Actual investment is how much is actually invested when reality happens and changes the outocme so imagine instead of 50 sold you sell 60, so now you ave 40 which is your actual investmetn which is higher
Why this is important? This is becuase it signals to producrs to reduce or increase output up until the point where they return to equilibrium which influcnes output.
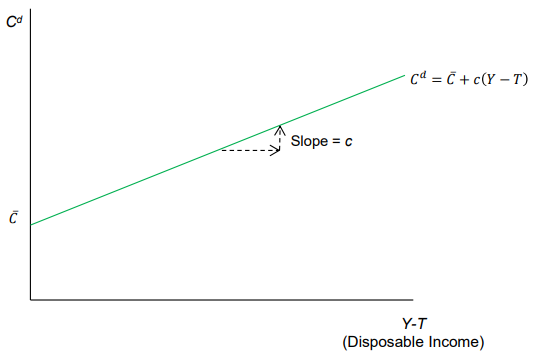
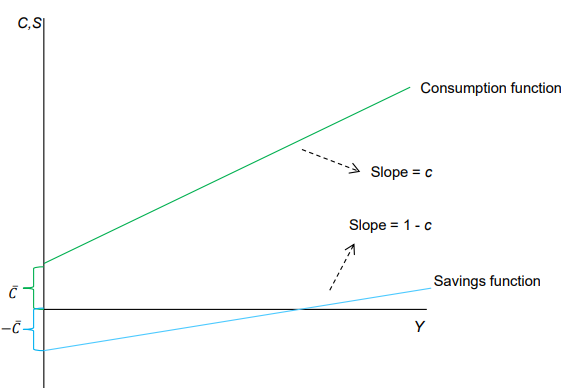
Explain the consumption function in the context of the aggregate expenditure model
C^d = C(bar) + c(Y - T)
c(bar) = this is the amount of spending that happens regardless of the level of income, all factors other than disposable income
c = MPC rate at which consumption increases when disposeable incoem increases
(Y-T) = disposable income which is income minus NET TAXES (taxes paid - transfer payment received)
Explain the consumption function diagram
x axis = dispoeable income (Y-T)
y axis = leve of consumption
slope = c (margnal propensity to consume)
y intercept = C bar so the exogenous consumnption
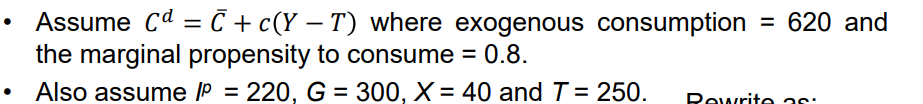
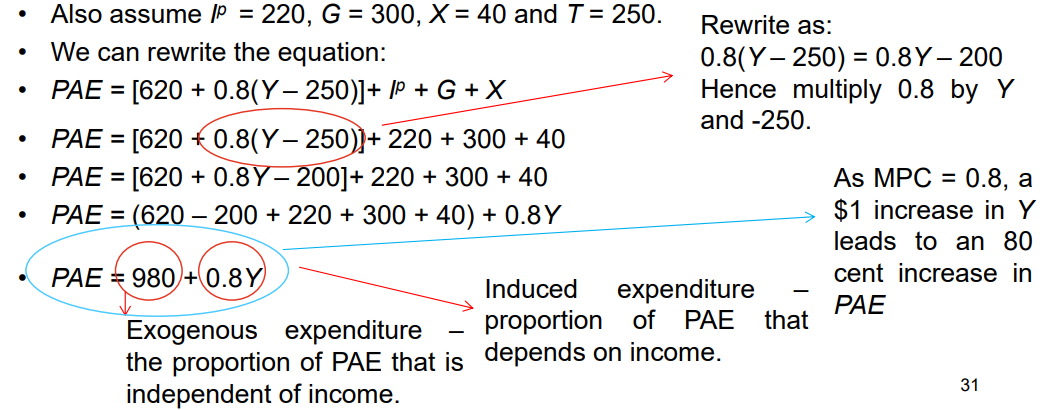
How do you solve for the equation of the planned aggregate expenditure
subsitue the consumption function into the planned aggregate expenditure equation
substitue the values and solve as appropriate
What are injections and waht are wirthdrawals in the keynesian aggregate expenditure model
Injections
anything other than consumption
so it’s investment, government spendin and domestic exports
rewrite it as INJ^P = I^P + G + X
Withdrawals
Part of income not spent on goods and services produed domestically
WD = S + T+ M
Equilibrium
occurs when INJ^P = WD
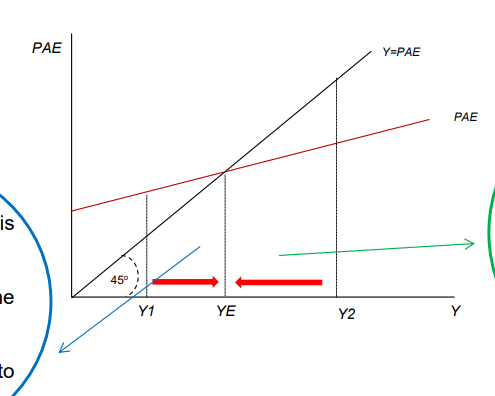
Explain what would happen if planned aggregate expenditure exceeds income / output and was less than income / output and the effect this would have on the firms
Exceeds income / output
it is PAE > Y or INJ^P > WD
Initially firms will exaust their acutal investment amoutn of stock to keep up with demand,
then after it is depleted they will increase output to match planned AE, causing expansion in the economy
Less than income / output
it is PAE < Y or WD > INJ^P
firms sell less than they want and they have a higher excess of stock than anticipated, they will then cut production to match planned AE in the economy causing the economy to contract
What are the components of the two sector keynesian modela and how do you calculate them
Consumption
it is calculated by C = Cbae + cY
so it is exogenous consumption + marginal propensitty to consume multiplied by income
Savings
it is calculated by S = -Cbae + (1-c)Y
so it is negative exogenous consumption + 1 minus margianl propensity to consume multiplied by income
Explain the diagram for the 2 sector keynesian model and why is it that the consumption is negative for the savings function
Why is it negative?
some consumption has to happen even when incoem is 0 e.g. food or whta not
How is the equilbriu deterine in the two secotr keynesian model
it is determined by adding the consumption functiona + investment function to get the PAE
A Y = PAE function is also added which is perfeclty 45 degrees
the point of intersection i the equilbirum of that
x axis = Y
y axis = PAE
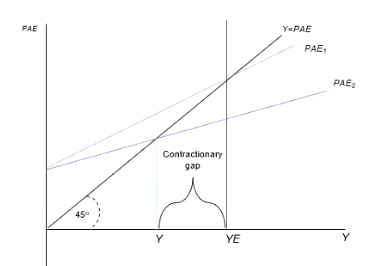
Explain and illustrate how to label a scenario: There is an economy operating at a point where real gdp is equal to potential gdp and that value of $4 800, the equation of the line is PAE = 960 + 0.80*Y. Now what would happen if exogenous consumption decreased by 10 and how would hte governmetn restore this?
x axis = Y
y axis = PAE
point of intersection is the YE = 4 800 so this is point A
the lower point is the Y and this is created by exogenous consumption decreasing by 10 so this is now point B
The difference is called the contractionery gap
Governmnets may increase spending, the increase in spenidng could influence consumers to start spending more through potential transfer payment or more confidnce
This increases consumption back from B to A closing the contractionary gap
to find the new gdp you do the new exogenous consmption / difference in mpc
so in this case it’s the
950 / 0.2 = 4 750
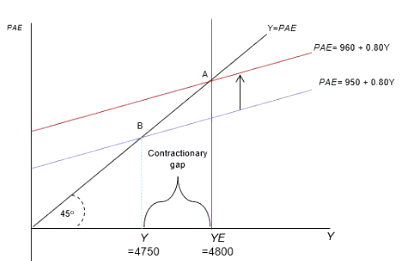
The equation of an economies planned aggregate expenditure is PAE = 960 + 0.8Y, and the equilibrium level of gdp is 4800, assume the exogenous consumtpion falls by 10. What is the new equilibrium
divide the new exogenous consumtpion by the difference in the MPC
so it’s 950 / 0.2
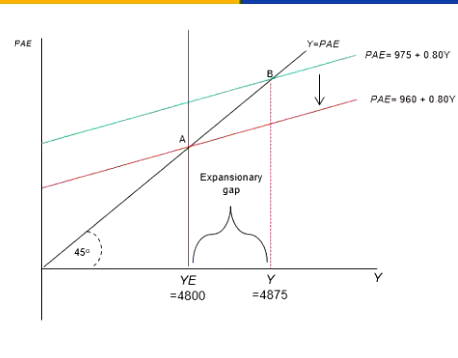
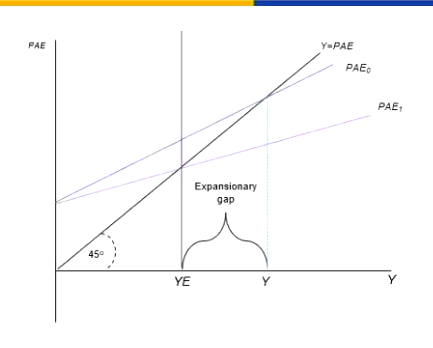
What should the government do if there is an expansionery output gap to return it to equilibrium
x axis = Y
y axis = PAE
point of intersection is the YE = 4 800 so this is point A
the expansionery is the point above it
to return it to the potenital gdp the governmnet shoudl decrease spending by the amoun tthat exogenous consumption has changed
What were the reaosns tha thte GFC didn’t impact Australia that severely
Australi’’s housing market did not collapse
housing prices rose significantly, and then when people were unable to make mortgage repayments if they lost their jobs etc… the banks reposesed them
this increased supply in the housing market and lowered the prices in the economy as a result
Since prices fell this cuased a spiral effect and lowered economic activity even further
Strenght of AU financiai system
AU has more government oversight and regulation preventing banks from acting like they did in teh USA
Strong export growth
exports were still strong from china and india
AU had very aggressive monetary and fiscal policies
AU spent lots of money and gave payments to people to spend money and gave them money
Imagine a scenario where there is a contractionary output gap which exists in the economy due to a fall in consumer confidence. How would the government go about returnig the economy to its potential gdp.
what the government would do to return it to that level is to lower the amount of taxes or increase transfer payments
Lower taxes makes it so the slope of the PAE curve changes so that it becomes more steep and it intercepts at the point where PAE is 4 800 instead of 4 750.
the reason it becmoes more steep is that lowers level of taxes means that there is more disposeable income, which then means that consumption will increase. This will therefore cause the PAE to be more steep.
How would changes in taxes allow for the expansionary output gap to become closed.
a increase in taxes means that disposeable incomes will decrease
reduction in disposable income means that consumption will also decrease, a decrease in that will cause the PAE curve to flatten
It will flatten up until the point it returns to equilibrium.
What are the problems with fiscal policy
supply side view
the argument is that tax cuts are necessary to increase the GDP so people work harder and supply more labor
Problem of defecits
can lead to large budget defecits and they need to be repaid so they need to be finances
this causes the publci debt to be larger
Relatively inflexible
the decision can’t change very quickly and those decisions are predicted for one year in the future with budget planning
it required legislation and changes to happen.
What are automatic stabalisers
this is where the output gaps which exist in the economy are automatically filled in.
e.g. contractionery gap
the governmnet receives less revenu from taxes and therefore has to increase government spending through transfer payments to reduce long term recessions
the opposite is true for the expansionary gaps
so the government is automatically changing the amounts of government spending to stablise it
What are some uses for the fiscal policy
Redistribution of income
it can close income inequality, through taxes and transfer payments e.g. if you’re a lower income earner you can get subsidies such as on the childcare etc…
if you earn more money you get taxed more aggressively, and lower you get taxed less
Demographic change
Publci debt
how does hte lorenz curve work in the economy
the closer the lines is to the perfecly straight line of equity the more equal the country is
Assume that a person buys a bond in 2021 with a coupon rate of 5% and the amount they paid for the bond was $1000, they will sell it after 2 years. THe interest rate in 2022 is 6% would they buy the person bond in 2023?
No!
the reason they won’t buy it is because the return will be lower
the total return from that bond over the tiem period
the amount they will earn in 2022 is $50, since it’s $1000×1.05. And in 2023 they will earn another $50
In 2022 the other people can earn a retunr of $60, ($1000×1.06), so they wont buy a bond that only offers $50 when they can get $10 more without it
Assume that a person buys a bond in 2021 with a coupon rate of 5% and the amount they paid for the bond was $1000, they will sell it after 2 years. THe interest rate in 2022 is 6% how much should the person sell the bond for
you calculate the value of the bond in 2022
2022 value = $1000×1.05
= $1050
sell value
1050/1.06 (current interst rate)
=$990.56
so you should sell the bond for $990.56 for someone to conisder buying it (as the return they can get will be the same)
Assume that a person buys a bond in 2021 with a coupon rate of 5% and the amount they paid for the bond was $1000, they will sell it after 2 years. THe interest rate in 2022 is 4% how much should the person sell the bond for
you do
$1000/1.04
=$1009.62 the reason this is higher is because the returns from that bond are a lot higher than the amount that exist for that current interst rate return of just 4%
What are the parts of the financial system
Bonds market
Trading in bonds include bond returns which are influenced by the cash rate of the RBA.
If there is changes to the bonds rates it influences levels of funding received by firms and the government and effects areas of spending in the economy.
Stock market
The stock market is influenced by the cash rate, if cash rate rises stocks tend to fall as less of the profit yielded by firms is retainable (as more has to be paid in interest payments)
lower levels of stock investment means less funding and less funding means less economic activity
the opposite is also true
Bank
the bank helps fund investment by giving out loans and allowing households and firms to save their funds.
What are the reasons for why people use money
Medium of exchange
without money we would have to barter for everything
Unit of measurement
without money we can’t have a relative yardstick to compare things too and such. So we can quantify something within currency
Store of value
it holds wealth
What are the kinds of money what is constituted as money
m1
this is the currency plus the deposits in the bank
so everything in your everyday account plus the cash you have on hand
m3
this is m1 and all the deposits of the private non-bank center, so things that may be in time deposits or something like that which is your money but you can’t spend it as of now
broad money
m3 and everything created by the wider financial system
Calculate the value of the money supply if Australian people choose to hold $500 000 in cash and deposti the rest into the banks at the banks desired reserve-deposit ratio is 10%
Money supply = $500 000 + bank reserves / desired reserve - deposit ratio
MOney spply = $500 000 + $500 000 / 0.1
Money supply = $5.5 million
Explain what happens if the RBA prints lots of money but goods and services remain relatively constant
It creates hyperinflation
the demand for good and services exceeded the supply which caused price levels to increase
Waht is the velocity of money and how do you calcualte it
Velocity
this is the way that money is transferred from people, from person to person e..g you buy milk from shopkeepr, that shopkeeper gives it to the supplier of milk adn then supplier to the farmer etc…
the faster it moves the quicker the velocity
Calculation of velocity
nominal GDP / money stock
Calculate the velocity of the money In December 2009, the value of Australia’s currency was $46.2 billion, M1 was $251.3 billion and nominal GDP was $320.5 billion. The velocity of money
you can calculate it two ways
you can either use the m1 as M(money stock)
or use the currency as M(money stock)

What is the quanity equation
you get this by re-arranging the velocity equation
M*V = P*Y
you assume that velocity and the real GDP are constnat
therefore any change in the money supply is equally proportional to the change in the price levsl
so if money supply increases by 10% then it can be assumed that the price level will also increase y10% and it does NOT affect GDP