Stats Final push
1/15
There's no tags or description
Looks like no tags are added yet.
Name | Mastery | Learn | Test | Matching | Spaced | Call with Kai |
|---|
No analytics yet
Send a link to your students to track their progress
16 Terms
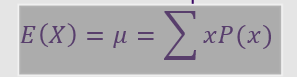
Average Expected of random variable
X is a random variable
x is the specific outcome X can take
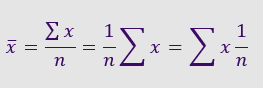
Average expected for a sample
Variance
Square each x and multiply by their respective probability and sum them. Then minus from the square of the mean.
Standard deviation
Root of variance
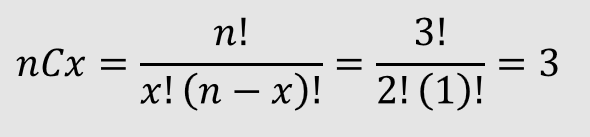
Combinations
n = number of sets
x = number of objects
eg picking 2 (x) out of 3 (n) vegetables.
Probability of certain combination
Find the combination for it, then divide by the total number of outcomes.
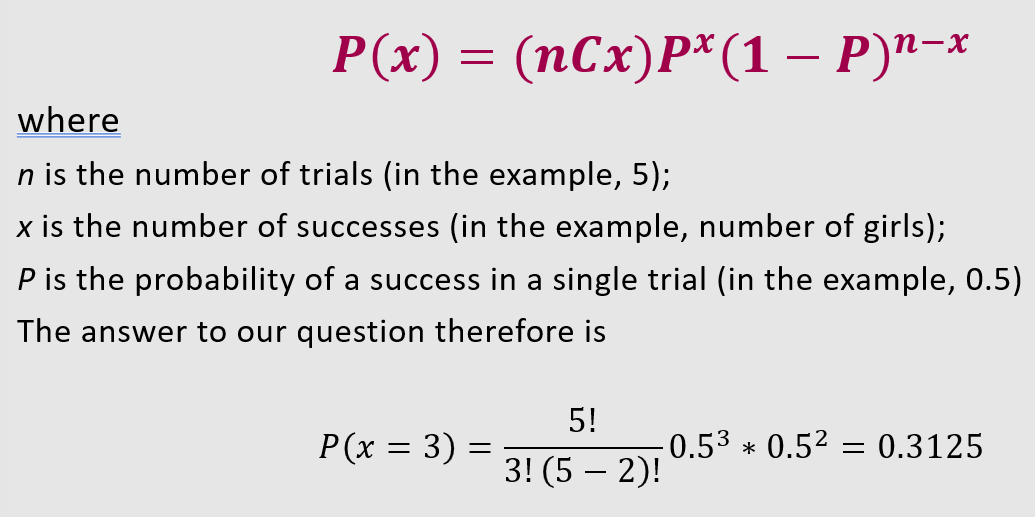
Binomial distribution function
Binomial distribution layout, mean and variance
X~B(n,P)
Mean: nP
Variance: nP(1-P)
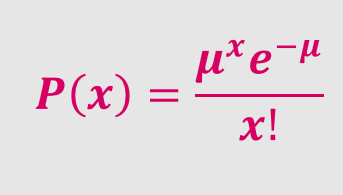
Poisson Distribution function
myoo = mean
x = number of sucesses
remember that successes and mean are proportional
Approximation to binomial
Binomial is nP but when nP is equal or less than 7 we use poisson.
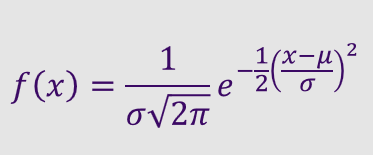
Normal Distribution
x is a particular value under X the random variable
eg height of student X x = 170cm
Standardised normal distribution

Using z values
5% ci = 1.96
10% ci = 1.645
1% = 2.576%
Sample X
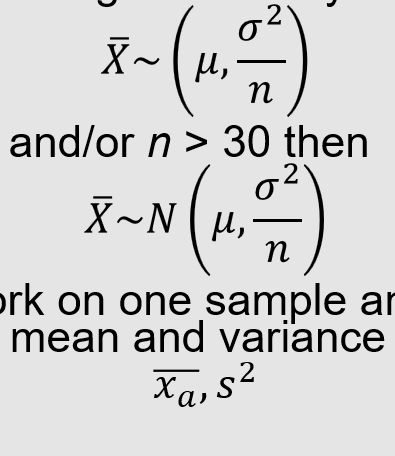
Hypithesis testing with unknown pop variance and small sample
Use t-test
use sample variance and calculate as usual.
THen use degrees of freedpm (n-1) and the t statstical table to fins t value.