Old Ones Don't use
1/155
There's no tags or description
Looks like no tags are added yet.
Name | Mastery | Learn | Test | Matching | Spaced | Call with Kai |
|---|
No analytics yet
Send a link to your students to track their progress
156 Terms
Mean and Standard Deviation for Binomial distributions
np
√np(1-p)
Mean and Standard Deviation for Geometric distributions
1/p
(√1-p)/p
Proportions One Population Mean and Standard deviation
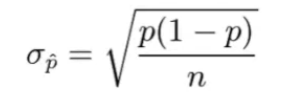
√p(1-p)/n
p
Proportions For two population mean and Standard Deviation
p1-p2
√p(1-p)/n +√p(1-p)/n
Means for one population standard deviation
SD/√n
chi-square statistic
(observed-expected)2/expected
The confidence interval for a parameter is of the form _.
point estimate ± margin of error.
A Type I error occurs when the null hypothesis is and is rejected.
true.
To calculate the margin of error, you subtract the from the upper bound of the confidence interval.
point estimate.
The _ tests if the observed counts are consistent with expected counts.
Chi-Square test.
In a ___ random sample, each group of a given size has an equal chance of being chosen.
simple.
The central limit theorem states that when the sample size is sufficiently large, the sampling distribution of the mean will be approximately ___.
normally distributed.
The variable is one that takes on categorical values.
categorical.
The standard deviation gives the typical __ that the values are away from the mean.
distance.
In regression analysis, the ___ measures the strength and direction of the linear relationship between two quantitative variables.
correlation.
___ occurs when the treatment groups are not randomly assigned and thus the explanatory variable cannot be said to have caused the change.
Confounding.
The ___ describes the probability of making a Type II error.
P(Type II error).
The Law of Large Numbers states that simulated probabilities tend to get closer to the true probability as the __ increases.
number of trials.
To ensure the results can be generalized, a sample must be ___ selected.
randomly.
An outlier is any value that falls more than __ above Q3 or below Q1.
1.5 IQR.
When checking the Large Counts condition, use __ when calculating.
p0.
In a matched pairs design, subjects are arranged in __.
pairs.
For a binomial random variable, the number of trials is a __ number.
fixed.
In a double-blind experiment, neither the subjects nor the researchers know which treatment is ___.
administered.
Population
A large group of people or other things
Sample
subset of a population
Statistical Unit
A member of the sample
Population parameter
a number that describes a population
Subject
Human Unit
Observational Study
Statistical Study that observes characteristics or behaviors without changing them
Survey
Experiment
Assigns Units to different treatments and observes the effects of the treatments
MUST be random
(blank) is the variable that is adjusted
Explanatory or independent variable
(blank) is what the measured variable is
Dependent or Response variable
(blank) is a variable that is unaccounted for and has an effect on (blank) and (blank)
Confounding
explanatory
Reponse
(blank) accounts for confounding variables so you can infer changes in the (blank) that are due to the explanatory variable
Control
Response
(blank) is the group that doesn’t have treatments and it’s purpose is to determine if having a treatment creates new effects
Control Group
(blank) is a variable that is constant to prevent confounding variables
Control Variable
Completely Randomized Design
Units are assigned to treatments at random and are not based on any characteristics
Randomized Block Design
Units with similar characteristics are placed into blocks based on confounding variables and units are assigned treatments at random.
Matched Pair Design
Units with similar characteristics are paired and one unit in each pair is assigned a treatment with the other is the control group
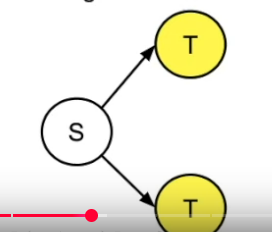
Randomized Design Diagram
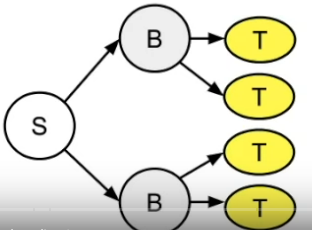
Block Design Diagram
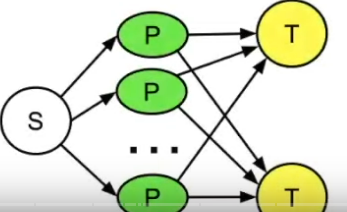
Matched Pair Diagram
(blank) is when the subjects don’t know their treatment group and the observers don’t know who belongs in each group
Double Blind Study
(blank) when EITHER the subjects don’t know their treatments OR the observers
Single Blind Study
(blank) has no effect
Placebo
(blank) is a positive or negative trend between two variables
Correlation
(blank) is when changing one variable causes changes in the other
Causation
(blank) can infer causation
(blank) cannot infer causation
Experiments
Observation
(blank) is being able to receive consistent results to ensure it is correct
Replication
Law of Large Numbers
Repeating something many times allows it to get closer to the expected results
(blank) observes or samples the entire population
Census
The 5 sampling methods
Simple Random Sampling
Systematic Sampling
Stratified Random Sampling
Cluster Sampling
Convenience Sampling
Simple Random Pros and Cons
Unbiased
requires all population members
Systematic Pros and Cons
Unbiased, easier than SRS
patterns can cause bias
Stratified Pros and Cons
Addresses all groups (unbiased)
Needs all population members
Cluster Pros and Cons
Simple and unbiased
biased if chosen clusters don’t represent the population
Convenience
Easiest
most biased method
Sampling Bias
Not all members are equally likely to be sampled
Undercoverage bias
Not all groups are represented
Response Bias
Not accurate repsonses
Non Response or Voluntary
Those not responding
or those who have a strong opinion
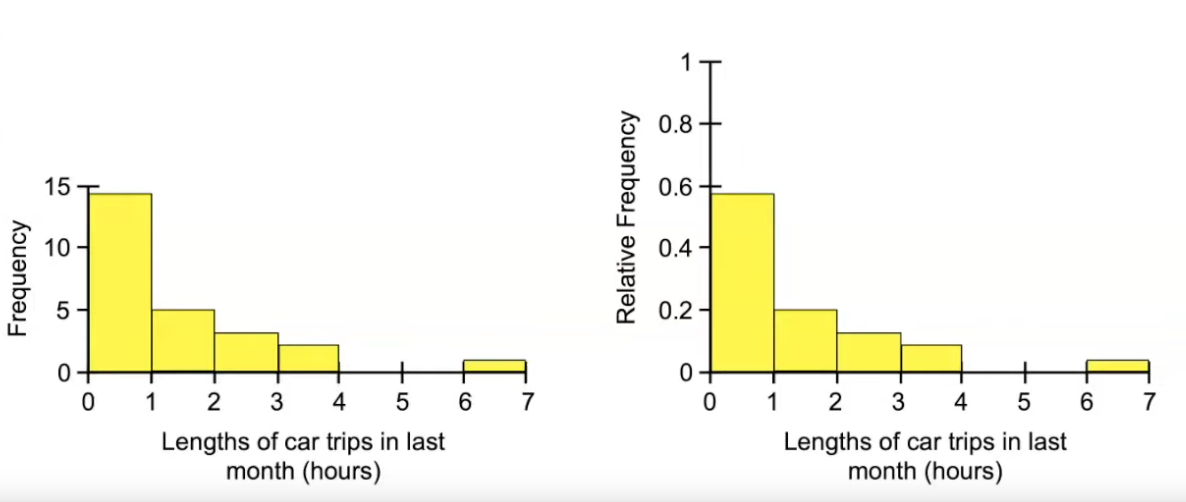
Histograms
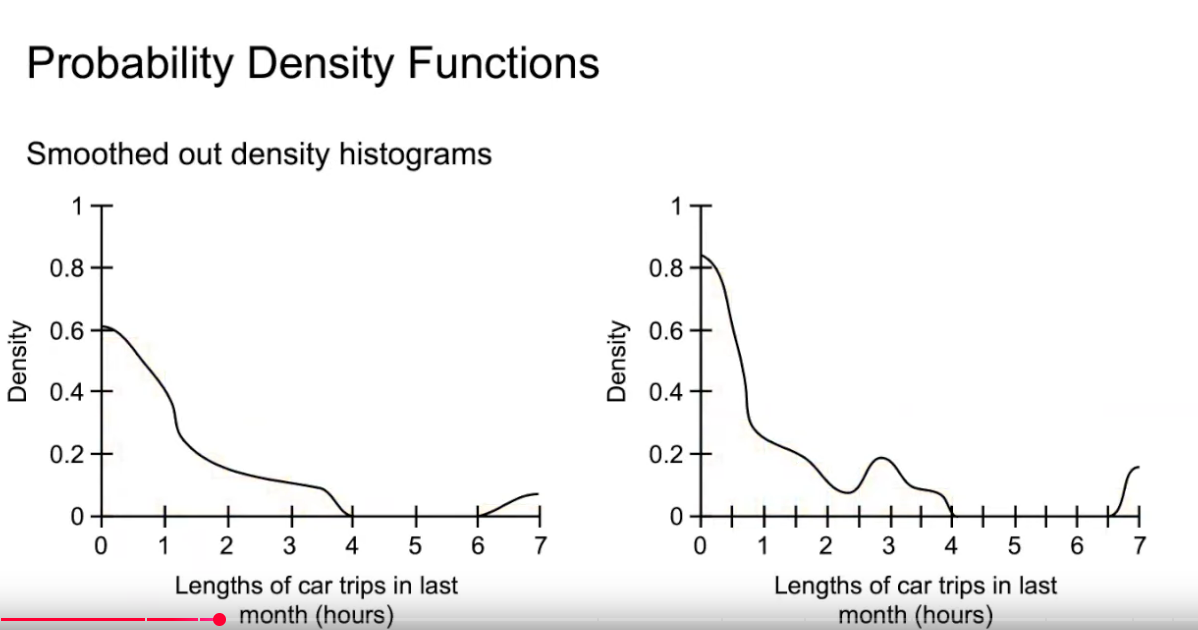
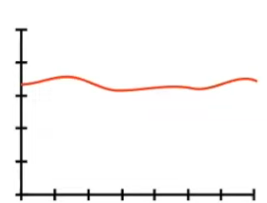
Probability Density Functions
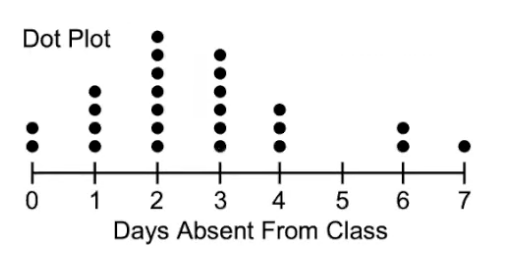
Dot Plot
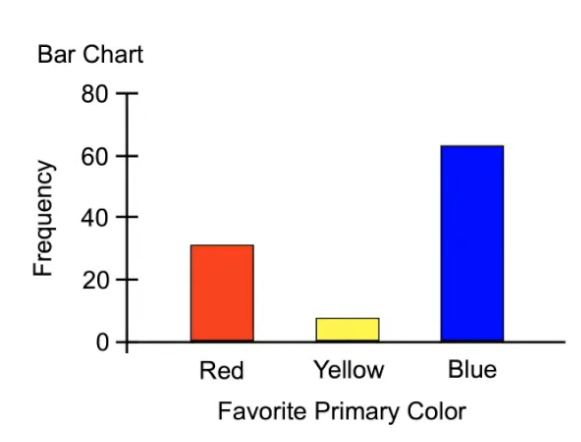
Bar Chart
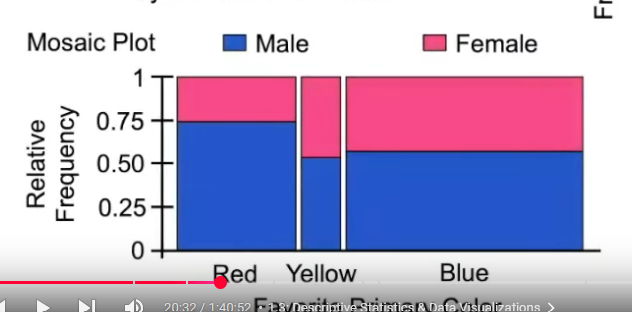
Mosaic Charts
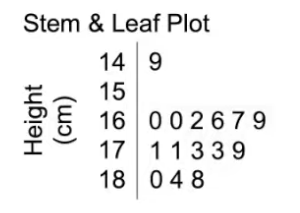
Stem and Leaf Plot
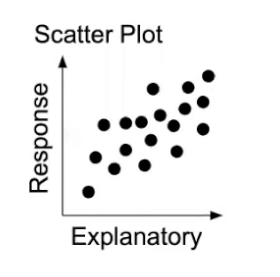
Scatter Plot
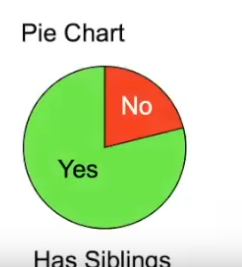
Pie Chart
(blank) is the lowest value that excludes outliers
minimum
(blank) is 25% of the data that falls below it or the 25th percentile
Lower Quartile or Q1
(blank) is the 50th percentile
Median
(blank) is the 75th percentile
Upper Quartile or Q3
(blank) is the highest value that excludes outliers
Maximum
IQR
Q3 - Q1
(blank) is a value that differs greatly from other observations
outliers
Lower outlier equation
Q1 - 1.5(IQR)
Upper Outlier equation
Q3 + 1.5(IQR)
(blank) describes a sample while (blank) describes a population
Descriptive Statistics
Population Parameters
How to describe a skewed population?
Minimum
Q1
Median
Q3
Maximum
IQR
How to describe a normal population?
Mean
Standard deviation
Variance
Range
(blank) are countable values
Discrete Variables
(blank) can take on any value in a given range
Continuous Variables
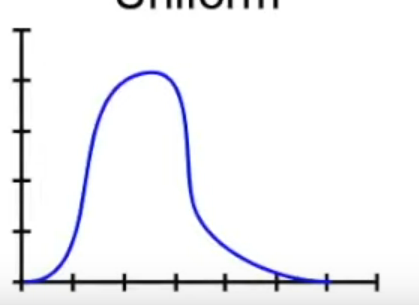
Uniform
Unimodel
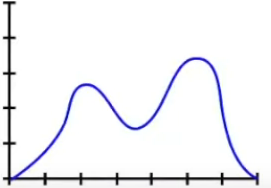
Bimodel
Normal Distributions there are (blank)
68%
95%
99.7%
Z score formula
x - mean / standard deviation
How to Describe Distribution
Shape
Center
Variability
Content
Comparisons (if possible)
The mean is equal to the (blank)
Percentage
How to calculate if the number of successes is at least ten?
np (trials x percent)
How to calculate if the number of failures is at least ten?
n(1-p)
How to find the standard deviation
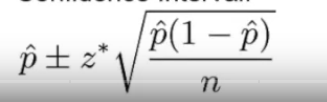
How to find the Confidence interval
What are the required conditions for a Confidence Interval?
Random Sample or Random Experiment
Normality of Sampling Distribution np > 10 and n(1-p) > 10
(When without replacement) 10% rule ( n < 0.1N) N=total population
Two ways to Interpret Confidence interval
We are C% confident the true proportion of the population is between (point estimate - margin of error) and (point estimate + margin of error)
About C% of all samples of the specified size from the population will produce a confidence interval containing the true population proportion
The maximum possible standard deviation is (blank) when (blank)
√0.25/n
p = 0.5
Step 1 for Confidence Intervals
Random Sample
Normality (np) and (1-(n-p))
10% rule (n < 10(N))