GCSE Geography Paper 2 (Human)
1/210
Earn XP
Description and Tags
Urban futures, Dynamic development, UK in the 21st century, Resource reliance, Fieldwork. 1h30m, 70 marks, 35% of GCSE
Name | Mastery | Learn | Test | Matching | Spaced | Call with Kai | Chat |
|---|
No analytics yet
Send a link to your students to track their progress
211 Terms
urbanisation
the process by which an increasing percentage of a country’s population live in towns & cities
more people now live in towns & cities than in rural areas, but urbanisation varies across the globe
ACs show the highest levels of urbanisation, with the lowest levels in africa & SE asia
urbanisation growth rate differs between & within countries globally
global urban trends
| Advanced | Emerging | Developing |
Rate of urban growth | Slow or declining | Rapid | Fastest |
Examples | UK, Germany, Japan, America | India, Russia, Brazil, China | Sub-Saharan countries - Rwanda & Ethiopia, Asian countries - Vietnam, Bangladesh, Philippines |
Causes | Industrial revolution pulled population into developing urban areas at the time. Nowadays many people in are being pushed away from overcrowded cities. ACs tend to have good transport & communication networks so people can live in rural areas & commute / work from home | Key trade hub cities see greater growth due to investment from the government & TNCs – eg Lagos, Shanghai, Mumbai, Sao Paulo, St Petersburg Trade like finance, electronics & manufactured goods | Most new economic development is concentrated in big cities through investments in low cost manufacturing of textiles, clothes & shoes Push-pull factors lead to higher rates of rural to urban migration Cities experience higher levels of natural increase in population |
ACs have lower rates of urbanisation as towns & cities already exist
due to modern transport & communication urban areas are sprawling into rural regions to create conurbations, adding to the growth of urban areas
conurbations
an extended rural area typically consisting of several towns merging with the suburbs of a central city
due to modern transport & communication urban areas are sprawling into rural regions to create conurbations, adding to the growth of urban areas
megacities
cities with more than 10 million people. have a powerful attraction for people & businesses. influential cores with large peripheries
the largest growth of megacities is in asia eg tokyo
reasons for growth of cities
economic development encourages population growth leading to desirability of goods & services. all megacities act as service centres within the formal economic centre. but megacities in LIDCs (mumbai, dhaka) are also important manufacturing centres with thousands working in the informal economy
population growth: young people are drawn to live in megacities with their vibrancy, fast pace & opportunities. there’s also internal growth where people who have moved into cities have children, sustaining population growth (mexico city, mumbai, pearl river delta)
economies of scale: it’s cheaper to provide goods & services in one place than spread across several cities - financial savings for local governments in infrastructure provision. communication & transport are centralised, saving time & money
multiplier effect: a city prospering encourages inward investment, leading to more development & growth, generating further need for skills, labour & job growth. this cycle multiplies the positive effects & growth continues (san francisco & the digital development)
world cities
can be any size but exert particular influences around the globe. are considered prestigious, with status & power. they are critical hubs in the global economy
the 3 top (alpha) world cities are london, new york & tokyo. these are the financial centres of the world, each with smaller networks of world cities feeding into them
there are only 4 world cities in the southern hemisphere
urban primacy
a situation where a single city (a primate city) dominates a country in terms of population, economic activity and political influence
some cities have urban primacy & exert dominance over the rest of the country. they’re usually cities with the largest concentration of urban population and don’t have to be country’s capital
all economic growth is concentrated in the city to the cost of the city’s rural fringe
political power becomes focused in the city & decisions affecting the whole country are made in primate cities, often benefitting the primate city rather than the whole country’s needs
primate cities are a bigger draw for migrants & small cities miss out on new business & investments
rapid primate growth concentrates urban problems eg pollution, poverty, crime, congestion
causes of urbanisation
modern growth of cities began with the industrial revolution in britain in the 19th century with the pull of work to factories in growing cities from the push of a harsh rural existance
urban living became linked to better literacy & education, improved health & a longer life expectancy through more access to health & social services. urban populations can enjoy cultural entertainment & experiences plus opportunities to participate in political debates & policies
main factors affecting the rate of urbanisation:
speed of economic development: economic growth drives urbanisation. faster growth of secondary & tertiary employment sectors = faster growth of urbanisation
rate of population growth: economic growth needs a supply of labour. this demand can be met through natural increase in urban population (slow) or rural-urban migration (more important as it attracts more people)
counter urbanisation: people moving from an urban area into the surrounding rural region
natural increase: accounts for 60% of urban population growth due to lower death rates & higher birth rates
importance of cities
people have always lived in cities & towns in order to trade goods & services
they’re essential to the development of a country’s economy & are centres of opportunity, entertainment, education, religion, culture, political administration, industry etc
urbanisation & growth in LIDCs
since the 1950s EDCs & LIDCs have seen rapid growth in urbanisation. there are 3 main reasons:
mass rural-urban migration due to population growth & lack of resources in rural areas (push factors)
lure of the city & opportunities (pull factors), although many find informal employment & poor housing
natural increase - development + improving health care = lower infant mortality & death rates but still high birth rates
reasons for rapid growth in rates of urbanisation:
most new economic development is in big cities
push-pull factors lead to high rates of rural to urban migration
cities experience higher levels of natural increase in population
decline of industry in ACs - industry moving to EDCs & LIDCs to take advantage of a cheaper workforce leads to industrial growth in emerging countries & pulls people from rural regions to urban areas with hope of better life & employment
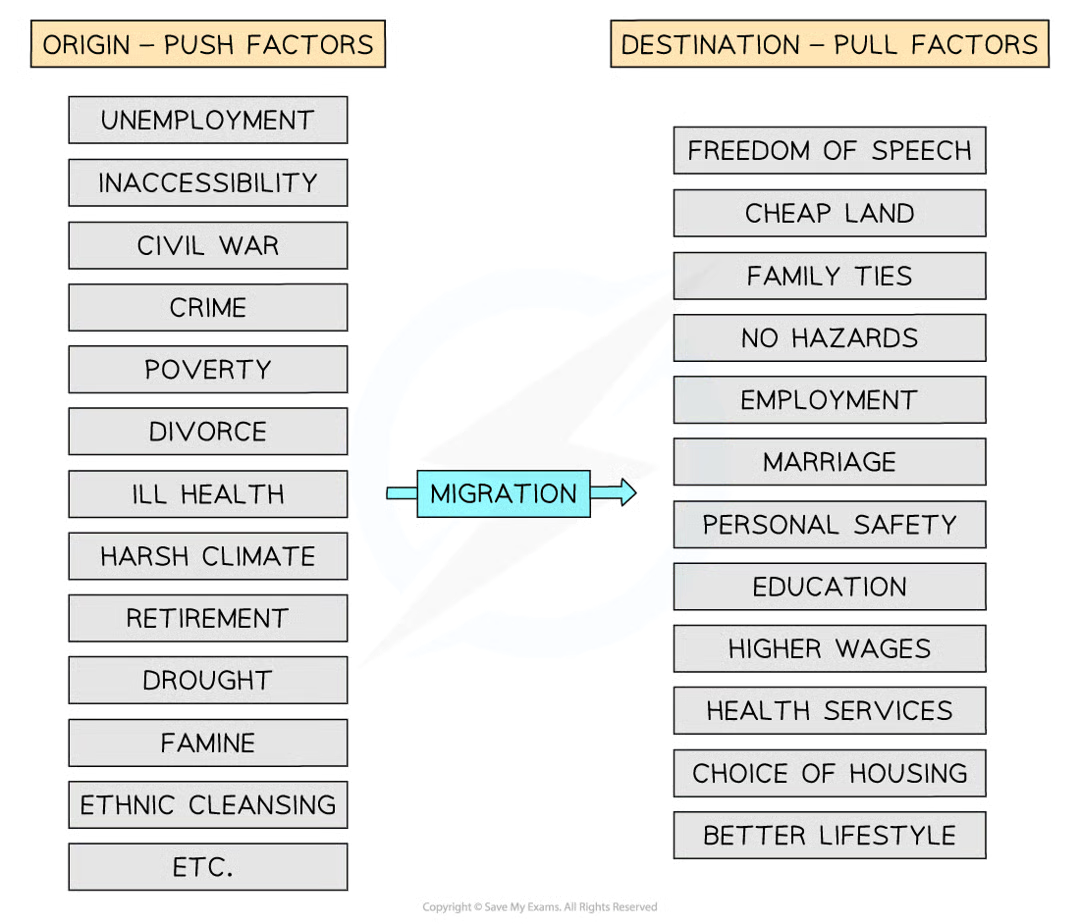
push-pull factors
push factor - the reality of the current situation, what makes the person consider moving
pull factor - the perceived outcome, what the person imagines the move will being to the place of destination
push-pull factors are unique to each person depending on their end goal. they can be divided into social, economic, political & environmental
consequences of rapid growth in LIDCs - informal settlements
informal settlements are a problem in LIDCs & EDCs, especially in megacities, when the availability & affordability of housing can’t keep up with the rate that urban population increases, so people build their own homes on vacant land using scrap materials
these are unplanned & unregulated with little sanitary facilities, freshwater or reliable energy supply. they are usually built on land not owned by them in areas of no economic value, on the urban fringes, along main roads / railways, or clinging to the side of steep slopes
some cities have mega-slums - very large, overcrowded areas in megacities
informal settlements present risks like fire, flooding & landslides. they typically suffer from:
poor, overcrowded small housing built close together with inadequate materials & with uncertain electricity supplies
restricted access to water
little/no sanitation facilities & no solid waste disposal = polluted & degraded environment
inadequate health facilities + poor living conditions = increased sickness & death rates
insecure living conditions & people may be forcibly removed by landowners / authorities
other challenges are the amount of waste produced as the city grows, air pollution, sewage & toxic chemical pollution of waterways, congestion on poorly managed / planned road systems, lack of public transport, lack of qualified doctors, teachers etc, high levels of unemployment & crime, informal employment & child exploitation
urbanisation pathway
the differences between ACs, EDCs & LIDCs can be shown as a pathway over time. countries become more urban as they develop economically
as they move through stagers the pace begins to slow & flatten out / decline as counter urbanisation gains speed

urban trends in ACs

urban settlements first appear as a result of agglomeration - people gather together in one area to sell goods & live, small trading posts & villages begin to develop
as towns grow they expand outwards in suburbanisation, which adds to the built up area, creating new suburbs made up of mostly houses but also including places of employment & services
urban settlements continue to prosper & grow, people move out of the town / city altogether & commute to work from dormitory settlements where people only sleep. people continue to have links with the town / city they left & still make use of urban services, shops, education & healthcare
urban sprawl
urban growth if left unchecked leads to urban sprawl, where cities become too large. this creates issues like:
loss of farmland to build new homes
loss of green spaces like school fields & parks which are built on
impact on ecosystems - natural & built (removal of trees = more pollution etc)
impermeable surfaces = surface run off
in the UK the government introduced green belts to limit outward urban growth. changes were at urban fringes due to:
availability of space for housing / retail / manufacturing
cost of land is cheaper to develop
better access to main aerial routes for transport
many services are located at the urban fringe - hospitals, superstores, specialist manufacturing etc
counter urbanisation
the movement of people from an urban area into the surrounding rural region for causes like:
mobility & accessibility: higher personal car ownership, increase in public transport & road development = easier to access rural areas
increased wealth makes housing & travel more affordable
agricultural decline (mechanisation of farming) creates the availability of more land for housing
green belts mean people need to go further out to get a rural life
second homes & early retirement increase the movement of people from the city → country
re-urbanisation
the movement of people back into cities from the surrounding area as a result of lots of factors:
increase in jobs
regeneration of older areas through rebuilding / development (factories → apartments)
improvements in air quality
improvements in safety
deindustrialisation
the closure of factories & industries leading to large areas of derelict land & buildings. this leads to suburbanisation & counter urbanisation due to lack of jobs & poor quality environment
more recently this has lead to re-urbanisation as areas are cleared / redeveloped
urban regeneration & re-imagining
urban regeneration is the investment of capital into the revival of old urban areas by improving what’s there or clearing it away & rebuilding
over time, older parts of urban areas suffer a decline - factories move elsewhere meaning job loss and quality of life & housing become poorer meaning people move away. urban blight sets in & the area needs to be brought back to life - urban regeneration
urban re-imagining is changing the image & reputation of an urban area & the way people view it - focusing on a new identity / function, changing the quality & appearance, etc. it’s a good opportunity for brownfield site development
london docklands was completely redeveloped & regenerated, and now has new industries, more executive services, homes, entertainment & leisure
urban generation + urban re-imaging together = rebranding. these processes add to the continued growth of urban regions
lagos
nigeria’s largest & most populous city. developed on the west side of the sheltered lagos lagoon, next to the bight of benin on the atlantic ocean. borders benin, niger, chad & cameroon

attracts 600,000 new residents annually, making it v diverse. There are a mix of rich & poor - 4 billionaires & 6,300 millionaires. access to water & energy is slowly improving & transport systems are getting better
importance of lagos
regional: lagos island is the financiancial hub of the city. 6,300 millionaires & 4 billionaires live in lagos. the CBD & eko atlantic development provide high skilled jobs, industrial areas & ports provide low skilled jobs
national: the city has well connected transport + a major international airport & a busy seaport providing raw materials for local industries. lagos is one of the world’s fastest growing megacities & is nigeria’s leading city for trade & economy. 80% of Nigerian industry is in lagos
international: the port on tin can island connects nigera to the world through global trade in oil. lagos provides headquarters for national & global companies eg shell nigeria. it has the fourth highest GDP in africa. growing fasion & flim industry (nollywood)
migration in lagos
migration has resulted in an overcrowded, congested & polluted city with pockets of high density populations eg informal settlements & gated communities. incomes in lagos are 4x higher than rural areas, contributing to its rapidly growing population
migration into lagos from rural areas brings a wide range of ethnic groups, giving lagos a diverse ethnic population. international migration from neighbouring countries eg chad & niger. migrants from the USA, UK & china are employed by foreign businesses, mostly the oil industry
mainland lagos has an increase of 600,000 people per year, spreading north & west
wealthy areas eg victoria island with gated communities + informal settlements eg makoko (250,000 people) close to the lagoon with many people working in informal sector / fishing in the lagoon. makoko is built out into the lagoon & floods regularly
rural to urban migration = high rate of natural increase + youthful population. push factors:
poor education & health services
crop damage due to droughts & floods
low wages & long hours for subsistence farming
oil pollution has degraded the land
climate change brings unreliable rainfall to north of nigeria
history of lagos
1900: small fishing village on lagos island with access to the lagoon, atlantic & marshlands
1965: discovery of oil in niger delta = expansion across lagos island. people spread to victoria island then onto the mainland, where lagos grew in a linear pattern along the major transport routes
1990: inward migration saw rapid expansion of lagos including rise in slums. maroko’s informal settlement was cleared in 1990 but quickly redeveloped along with others on the mainland. lagos & victoria islands were connected to the mainland by 3 bridges. tin can island container port increased global links
2010: lagos officially becomes a megacity. eko atlantic begins development in 2009 on reclaimed land south of victoria island to create a new coastal city & try to solve the shortage of housing
2020: urban sprawl pushes further NW & includes areas around the airport. construction work on the 38km 4th mainland bridge was due to begin in 2019 but was delayed
lagos culture
city is at the heart of the film industry in africa (nollywood) - producing 1,500 films a year
although western influence is becoming more popular, traditional clothing, street vendors & markets are still popular, with lagos museum being built as part of the redevelopment of the onikan area of the city as a cultural hub
there is a growing arts scene & large street dance parties + events like the Badagry Festival, Lagos Street Carnival & the One Lagos Fiesta, gaining international coverage
home to afrobeat & afro hip-hop music movement, attracting musicians from all over the world
lagos ethnicity
over 250 ethnic groups represented due to heavy migration from other parts of nigeria & surrounding countries
originally inhabited by the Awori group of the Yoruba people
small minorities of american, british, east indian, chinese, white zimbabwean, greek, syrian, lebanese & japanese people
over 500 different languages spoken - english, pidgin & yoruba most common
lagos housing
77 people moving to lagos every hour means housing is v limited - renting is expensive & buying a home almost imposibble
housing ranges from skyscrapers, luxury apartments & high rise flats in the city centre to colonial mansions & gated communities on victoria island to tin shacks on the outskirts
very few people can afford to buy their own homes & with no government social housing roughly 2/3 of the population live in informal settlements - largest makoko
with the shortage of housing, a new urban district eko atlantic city is being built on land reclaimed from the sea & is protected by an 8.5km sea wall, helping to build confidence in lagos as a ‘go to’ city
lagos leisure
football is the national sport & some of the best players in europe are nigerian
as an emerging city leisure activities are limited & aimed at tourists, but they take advantage of the beaches & scenery - key areas eg landmark leisure beach, lekki leisure lake
lagos consumption
as the population rises so does the demand for resources. lagos consumes ½ of nigeria’s energy output
as more people become wealthier there’s greater demand for consumer goods so more resources are used
shopping malls & a mix of food markets & street vendors
growth of commercial & industrial zones with overall improvement to economic development & standard of life
lagos challenges: informal settlements
60% of the population live in informal settlements, typically found on unfavourable land eg swamps & the lagoon
the largest is makoko where homes are built on wooden slits in the low-lying lagoon due to the risk of flooding
the houses (huts) are built illegally with communal toilets & waste goes directly into the lagoon, polluting the water
there’s no running water & 3km to the communal water point
electricity is obtained illegally by connecting to the city’s supply
lagos challenges: informal sector jobs
60% of people work in informal jobs - scavenging through waste in rubbish dumps, becoming street vendors or working on the docks
street vendor stalls can be bulldozed to make way for new developments
informal jobs pay very little, require long hours & have no job protection
crime rates are high including gun / gang violence & drugs
one primary school but few parents can afford to send their children regularly
lagos health & services
rapid urbanisation causes dangerous levels of traffic congestion & pollution. there’s a lack of health care services & many people can’t afford to access it
most people don’t have access to clean water / sanitation leading to disease & illness eg cholera & diarrhoea
the stagnant water of the lagoon is a breeding ground to mosquitoes leading to the spread of diseases of malaria
lagos waste disposal
only 40% of the 10,000 tonnes of daily waste produced is collected & taken to large rubbish dumps eg olusosun
many of the dumps contain toxic waste where people pick over the waste to make a living. many of these people have no formal training / protective clothing & are exposed to unsafe material
sustainability in lagos
many ways the challenges in lagos are managed:
sustainable urban development: improving residents’ lives now without destroying opportunities & the environment for later generations
top-down action: intervention by local & national government & business projects
bottom-up action: communities & individual action
help from NGOs: funding by donations eg wateraid, educate nigeria etc
lagos sustainability: waste disposal
the authorities encourage residents of makoko to recycle plastics, metals & paper
some of the waste to the olusosun dump is diverted to makoko where it’s gathered up, compressed, covered in sawdust & sand to create new land in the lagoon. this helps alleviate waste + create new land for residents
the lagos state integrated waste management project is an initiative trying to improve sustainability by reducing the amount of waste that goes to landfill sites & reducing the air pollution landfill causes
the world bank is financing a project to collect waste from food markets to turn into compost. this stops the waste going to landfill sites where it releases methane as it decomposes. instead a useful product is created that can be used to fertilise farming land, increasing food supplies
where waste ends up in rubbish dumps the government aims to generate electricity from it by burning the methane released. this happens already at ikosi fruit market where electricity generated from rotting fruit is used to provide lighting. a larger scale project at olusosun involves pipes placed into rubbish to collect the methane & take it to generators. the electricity generated will be used to power the dump
lagos sustainability: air pollution
being managed through improving the road & rail networks. the new light railway will reduce the amount of traffic & congestion + reduce air pollution
residents are encouraged to use public transport / car share to reduce congestion & air pollution
public info & education have seen a reduction in the amount of raw sewage entering the waterways. stricter pollution controls are enforces with factories being fined for polluting the waterways
lagos sustainability: solutions to transport issues
alternative transport options eg rail are being created. the new light railway will reduce the amount of traffic & congestion + reduce air pollution
a fourth mainland bridge + improvements on 360 inner roads restored are due to begin construction
google maps & radio bulletins advise on traffic issues
businesses are encouraged to allow people to work from home / work flexible hours to avoid rush hour traffic
lagos: eko atlantic
new development 10km2 created from 3,000,000 m3 of sand
aim is to provide luxury homes for 250,000 residents with tree lined streets and world class sewage & waste disposal systems. want to welcome 150,000 daily commuters
investment comes from the lagos state government & private companies eg south energyx nigeria
but with 1.7 million people living in squatter settlements some have criticised the project as a waste of money
lagos: makoko floating school
built in 2014 & designed to take up to 300 children. designed by a nigerian architect with local people & part funded by NGOs & the UN development programme. floats so to adapt to rising sea levels
development
the improvement in people’s standard of living - can be:
economic: growth of the economy due to changes in economic activities & technology
social: improvement in people’s health, education, water & food supply
environmental: more sustainable use of the environment
country distribution
the IMF classifies countries into 3 groups - advanced countries (ACs), emerging & developing countries (EDCs) & low income developing countries (LIDCs)
ACs: good level of services, high GNI per capita, high standard of living for most of population, tertiary economic activities are dominant
EDCs: increasing levels of wealth, secondary economic activities increasing & primary decreasing, more exports, increased wages
LIDCs: high levels of poverty, low GNI per capita, low standard of living for most of population
measures of development: GNI per capita
Gross National Income - the average wealth per person in a country. dividing it by population means better comparisons can be made between countries
an average meaning variation in wealth is hidden - countries can have v different distributions but the same GNI per capita
not all wealth of a country is included - some is hidden eg income created in informal employment. doesn’t give any info about social / environmental development
measures of development: HDI
Human Development Index - a combined measure of average achievement in key areas of human development, health, education & standard of living calculated using:
life expectancy at birth
mean years of schooling for adults (25 yrs)
expected years of schooling for children at school entering age
GNI per capita
countries can be divided into 4 groups - very high (VHHD), high (HHD), medium (MHD) & low (LHD)
scored from 0 - 1. norway has the highest (0.957), niger has the lowest (0.394)
measures of development: happy planet index
a measure of sustainable wellbeing that doesn’t include economic development indicators. scored between 0-100
HPI = (experienced wellbeing x life expectancy) / ecological footprint per capita
experienced wellbeing = how satisfied people are with their lives (gallup world poll)
ecological footprint per capita = the amount of land needed to sustain the country’s resource consumption (WWF)
costa rica has frequently placed 1st above more developed countries. USA placed 122nd in the overall list below many poverty stricken countries eg haiti
well-being is highly subjective, ecological footprints of the least developed countries are lowed as people can’t afford to buy lots
factors affecting development
development isn’t a smooth continuous process & can occur for several reasons eg investment in agriculture improving food supplies improving health, improvements in power supplies to rural areas or improvements in access to education for women & overall literacy rates
it can be slowed, halted & reversed by war/conflict, disease, disasters or economic regression
human causes of uneven development - education, health, colonialism, politics, aid
physical causes of uneven development - climate, geographic location, natural hazards, natural resources
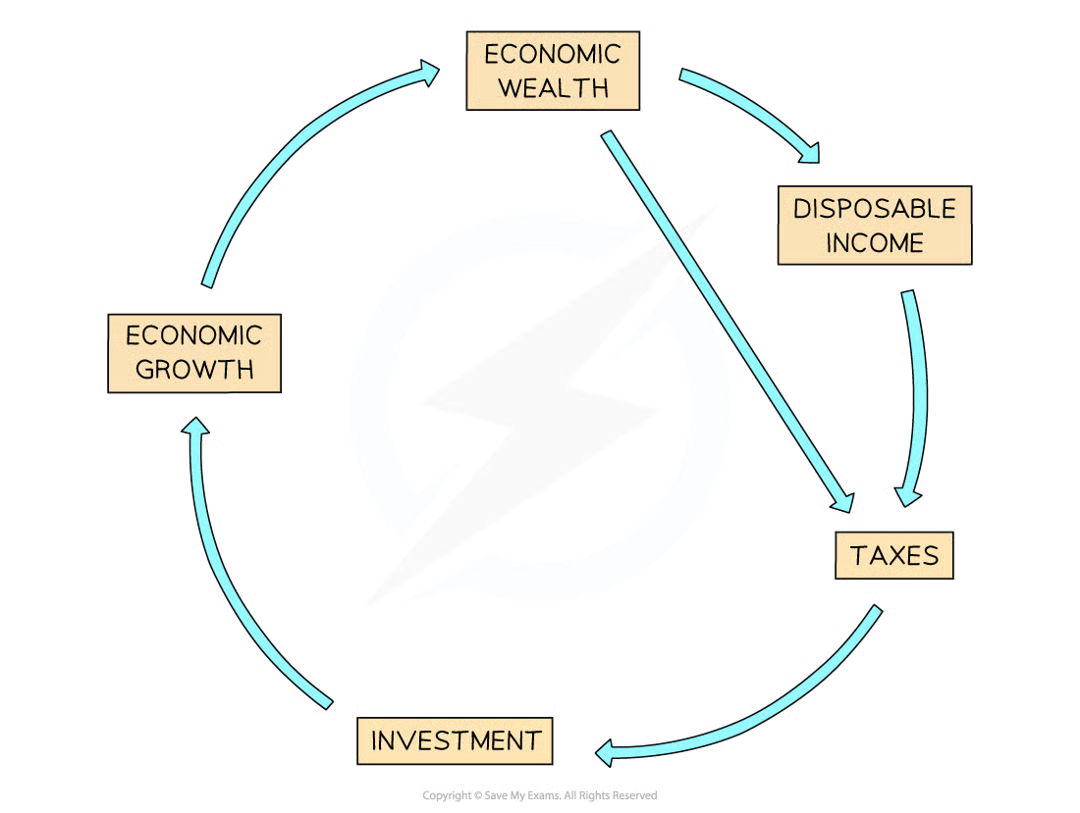
cycle of wealth
one of the key indicators for development. economic development creates wealth & if a country has a stable & effective government this leads to development
as the economy grows more people work & earn more money meaning the government can collect more tax & people have more disposable income to spend, increasing business profits
taxes & profits can be invested in future growth + infrastructure, education, healthcare etc
factors effecting development: education & health
linked to the wealth of a country. more wealth = can invest more in education & healthcare
a better educated population can help with development of secondary & tertiary economic activities, boosting the economy
a healthier population has a longer life expectancy & can work for longer, improving the economy
factors affecting development: colonialism
in the past countries across the world were conquered & ruled by european countries. as a result european countries became wealthier by selling / using colonies’ natural resources. this slowed development there because people weren’t ruling themselves & couldn’t invest in their own development
african people were enslaved & transported to other colonies to work on sugar & cotton plantations, further increasing european wealth
factors affecting development: politics
political unrest & corruption slows development
war & conflict slow development as money is spent on weapons & the conflict rather than development
factors affecting development: aid
the type of aid & whether it can reach the people determines whether it increases development
aid can lead to debt which countries struggle to repay, slowing development
factors affecting development: geography
climate: areas without extremes of climate tend to be more developed
geographic location: land locked countries find it harder to trade as they don’t have access to ports & goods must pass through other countries. flat fertile land is better for growing crops & building
natural hazards: rebuilding & dealing with impacts of these is expensive & reduces the amount of money that can be invested in development
natural resources: some countries have more valuable / abundant natural resources, increasing their income
factors keeping countries in poverty - debt
most countries in the world borrow money, but the effect of debt on LIDCs is greater because they borrow more & have less money available to repay it
repaying debt means a country has to reduce spending on infrastructure, education & healthcare. usually interest is charged on the debt so countries end up owing far more than they borrowed
factors keeping countries in poverty - trade
the exchange of goods between countries
most trade in the world is between ACs & the majority of it is controlled by TNCs that are mostly owned by & based in ACs
ACs mostly trade manufactured goods & services with prices going up
LIDCs mostly trade natural resources with fluctuating prices, impacting income
TNC
Trans-National Corporation - a business operating in at least 2 countries
HQs + research & development in ACs, production & manufacturing centres in EDCs / LIDCs because labour is cheaper & environmental regulations are fewer, allowing higher profits
jobs aren’t always secure & can be relocated at any time
money usually goes back to HQs in ACs
wages are usually v low
employees work long hours in poor conditions
provide new job opportunities, gaining new skills
new tech (eg computers) & skills are brought to poorer countries
money is spent to improve local infrastructure eg roads
factors keeping countries in poverty - political unrest
a situation where people are protesting against the government. 3 main factors that slow development:
unstable / undemocratic government: gov usually fails to invest in healthcare, education, social care, infrastructure development or improving the economy, leading to further instability & slowing development
corruption: politicians spend funds to their own benefit rather than improving the lives of their citizens. major development project contracts are given to family / friends at highly increased costs with minimal spending on materials
conflict: civil war, terrorism & tribal disputes use valuable resources & distract governments from development. conflict means the country loses money as fewer people work, military equipment is expensive and buildings & land are destroyed. also reduces the quality of life for population - loss of life, food, water & housing
ethiopia GDP per capita
$2,900
ethiopia literacy rate
52%
ethiopia life expectancy
67 years
ethiopia internet access
17%
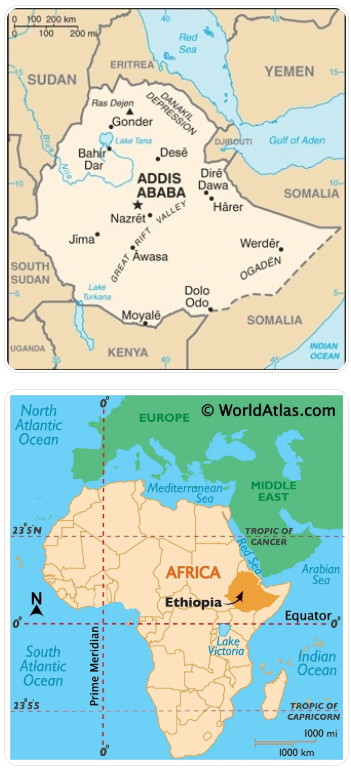
ethiopia location
east africa
just above the equator
landlocked - borders 6 countries
near the red sea
western highlands: wettest - one long rainy season, cooler temps (15-35o), good farming conditions but steep land makes it hard
central area: 2 rainy seasons & 1 dry season, unreliable rainfall, higher temps (25-40o)
eastern lowlands: v hot (30-40o), little unreliable rain, alternating wet & dry seasons, livestock but land overuse causes soil erosion & desertification
ethiopia agriculture
80% of population works in agriculture
80% of exports is agriculture
40% of GDP is agriculture
crops include coffee, pulses (eg beans), oilseeds, cereals, potatoes, sugarcane & vegetables. exports are mostly agricultural & coffee is the largest foreign exchange earner. ethiopia is africa’s 2nd biggest maize producer
through its investment promotion agency ethiopia has been encouraging business investment for decades using incentives eg import, export & income tax reduction / exemption and providing investors with access to land to lease for up to 50yrs
trade deficit
when imports are greater than exports
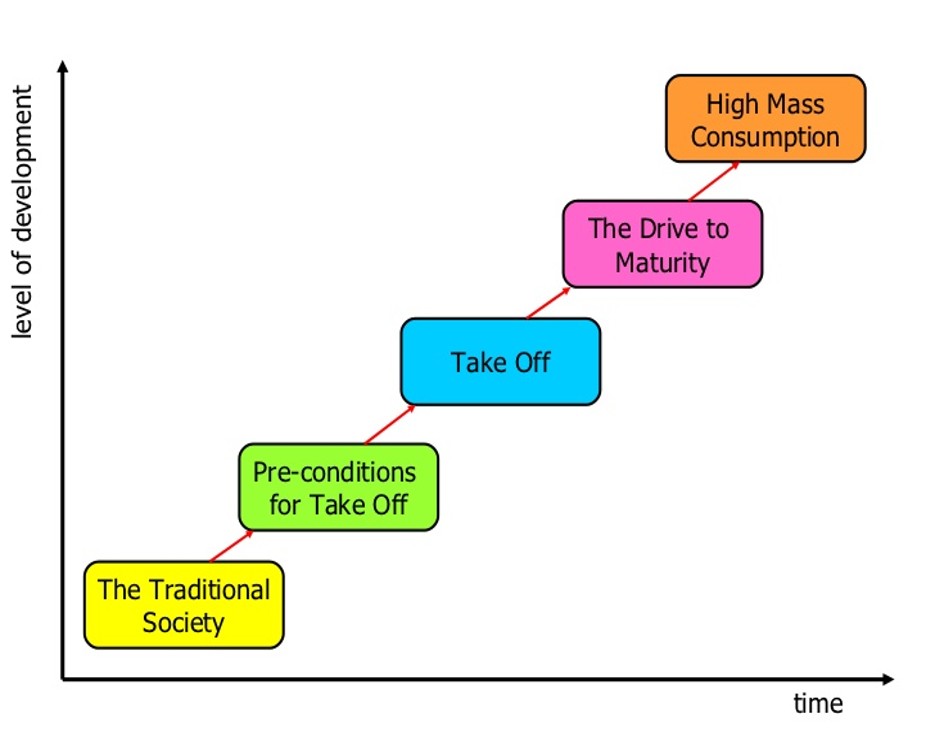
ethiopia has a trade deficit of $14 billion. in order to move through rostow’s model this needs to reduced to allow the country to spend more money on improvements to services eg infrastructure, education & healthcare
ethiopia exports
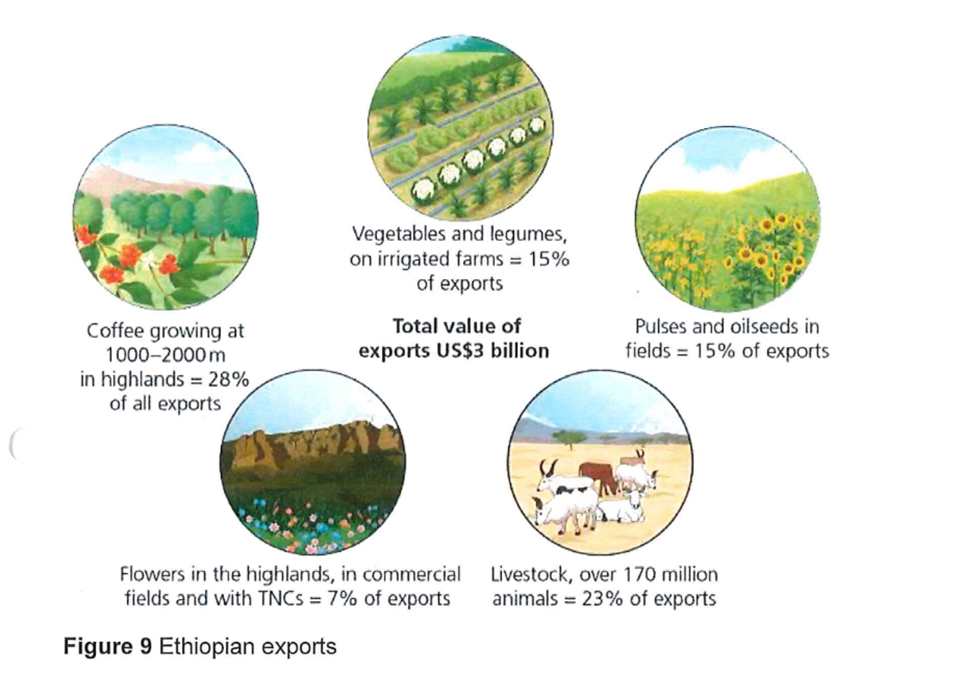
coffee is top export
ethiopia transports a narrow range of primary produce (mainly food & flowers), which is vulnerable to climate change, global economics & price fluctuations. there are also issues with ground transportation & food storage, affecting the quantity & quality of yield
relies on agricultural exports - flowers, veg, livestock - that’s v dependent on good weather / yield, meaning ethiopia can lose exports quickly & easily
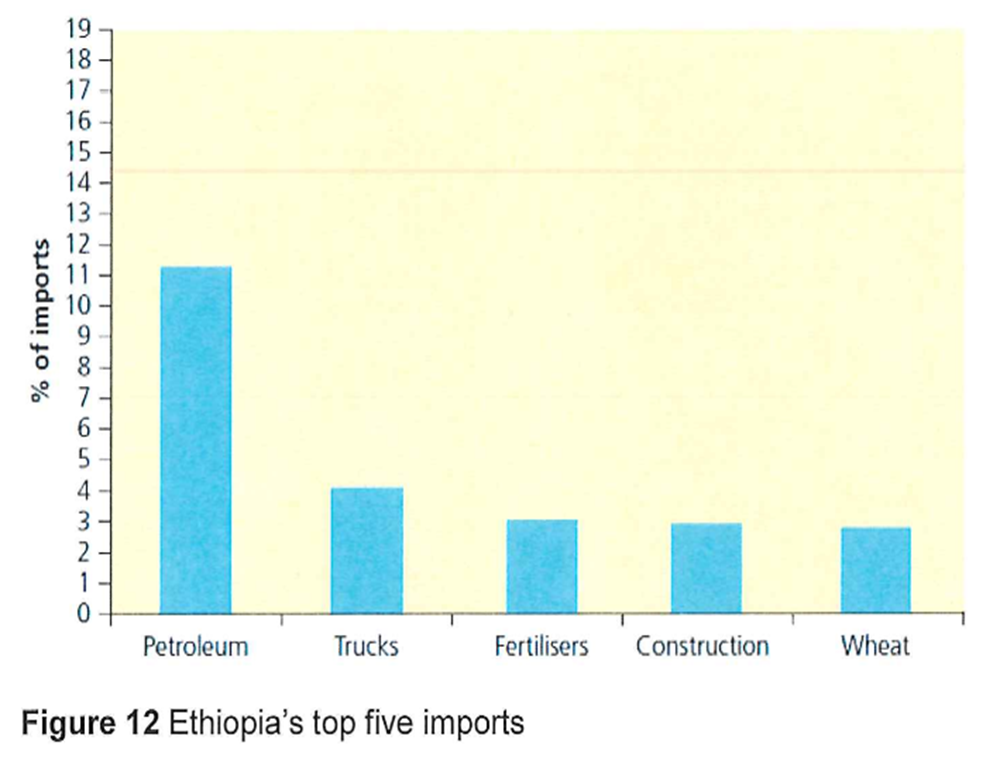
ethiopia imports
top 5 - petroleum, trucks, fertilisers, construction, wheat
rostow’s model of development
predicts how a country’s level of economic development changes over time from primary industry to secondary industry to tertiary & quaternary
traditional society: farming, fishing, forestry. little trade
pre-conditions for take off: manufacture, infrastructure, international trade begins
take off: rapid growth, industrialisation, increasing wealth
drive to maturity: economy grows, standards of living rise, use of technology
high mass consumption: high population, mass produced goods, high consumption
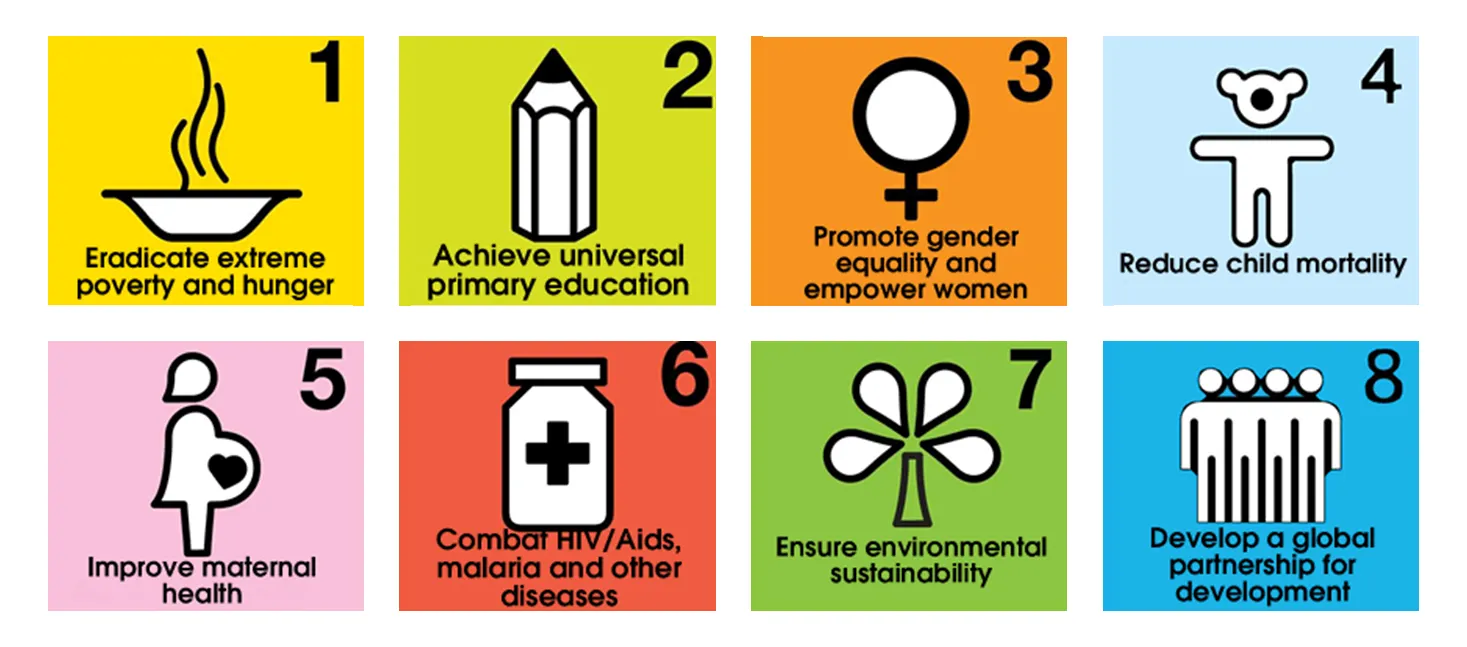
ethiopia millennium development goals
in 2000 world leaders from 189 countries agreed & signed the millennium development goals aimed at cutting world poverty in half by 2015 - 8 main goals with specific targets. there’s been mixed progress on reaching the targets across the world
1 - eradicate extreme hunger: population living in poverty dropped to 29%, 40% of kids are malnourished, 28% of population have insufficient access to food
3 - promote gender equality: 93% of girls are in primary school, greater representation of women in government, unemployment is higher for women & they’re still required to do traditional roles
TNCs in ethiopia - hilton hotels
ethiopia has increasingly strong global links. as part of the UN strategy there’s global support from other nations to help ethiopia meet their development goals. a range of TNCs have begun opearting in ethiopia in primary, secondary & some tertiary industries. one is hilton hotels
predicted over 1 mil jobs
~800k tourists expected
predicted to contribute $2 bil to GDP
economy can diversify
leakage of profits going back to ACs not Ethiopia
tourism & infrastructure isn’t developed enough to support 5* hotels
jobs are seasonal, low paid, long hours, unskilled & highest paying ones go to foreigners
increase in tourism could lead to cultural clashes between locals & foreigners & resentment towards tourism
aid
assistance given from one country to another eg money, equipment, training, loans
rebalances global inequality, repayment for benefits ACs got from colonialism, everyone should have the right to essential resources
countries may become dependent on aid, donors may give to the wrong things, corrupt governments use aid for the wrong things
foreign vs NGO aid
foreign aid: from the government of another country
NGO aid: from a NGO eg unicef
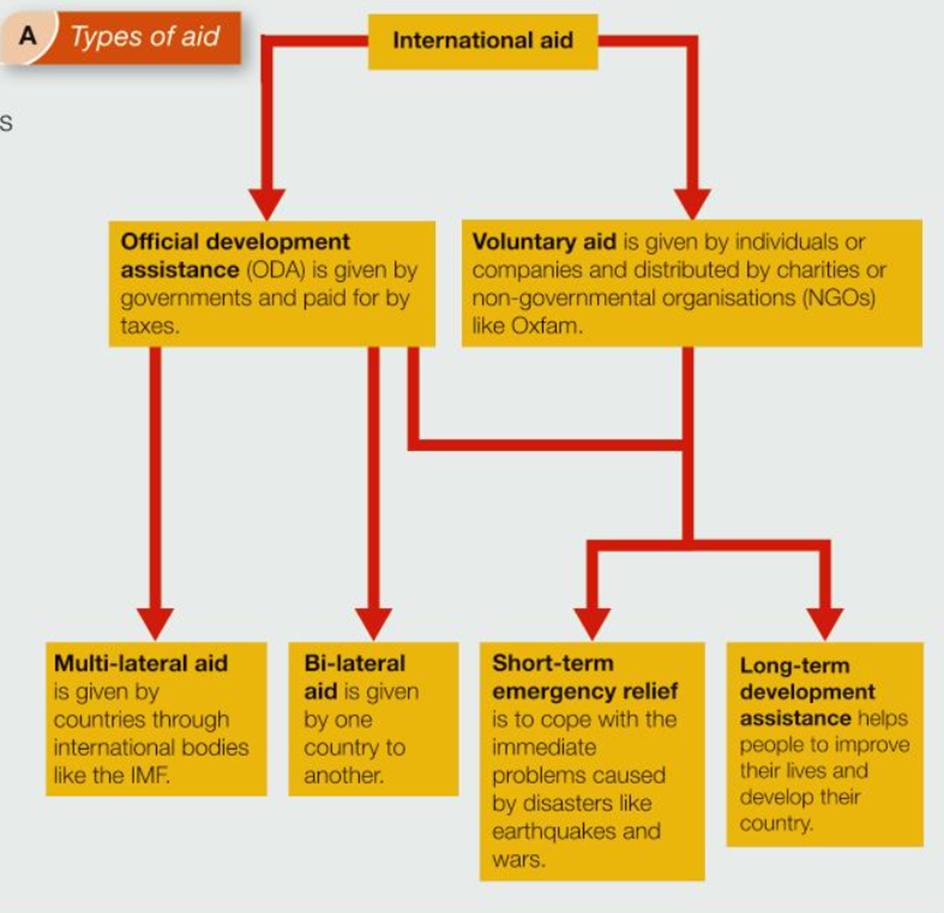
voluntary aid vs ODA
voluntary aid: given by individuals / companies & distributed by charities or NGOs
Official Development Assistance: given by the government of a country paid for by their taxes
short term vs long term aid
short term emergency relief: given to cope with immediate problems caused by disasters eg natural disasters, wars
long term development assistance: helps improve people’s lives & develop their countries
multi-lateral vs bi-lateral aid
multi-lateral aid: given by countries through international bodies eg worldbank
bi-lateral aid: given by one country to another
aid in ethiopia
charities like oxfam, farm africa & mission aviation fellowship have been working in ethiopia for over 30yrs
oxfam provides goat aid where a girl is given goats to look after, helping with the family + encouraging equality & responsibility
debt relief means ethiopia’s debt has gone from $10bil to $7bil
ethiopia depends on over $500mil a year of aid
top down development
large scale, advanced, expensive schemes
require loans eg from NGOs / other countries
decisions are made by the government & local people are rarely involved
top down development in ethiopia - gibe III dam
generates renewable energy to export - could make $400mil annually (more than most valuable export)
will help provide electricity to the country - rural population has very little access
potential to reduce impact of froughts
flood protection
lots of land is lost - homes & farming land that people rely on
lost land = potential for conflict between ethnic groups
involved a loan - impacting economy
alters seasonal flooding & reduces downstream volume of river
bottom up development
often run / supported by NGOs but led by local population
target specific small scale needs with an immediate effect
bottom up development in ethiopia - goat aid
helps reduce hunger & poverty - products from goats can be sold
promotes gender equality & responsibility
positive multiplier effect - give goats to others
improves development without causing as many social negatives as top down
goats help fertilise soil, stopping soil erosion & desertification
population could become overly reliant on charity work
could cause conflict between those who benefited & those who havent
only benefits a few people - helping lots would take lots of resources & time
not large enough benefit to increase GDP / development of country as a whole
if goats get ill more money needs to be spent taking care of them
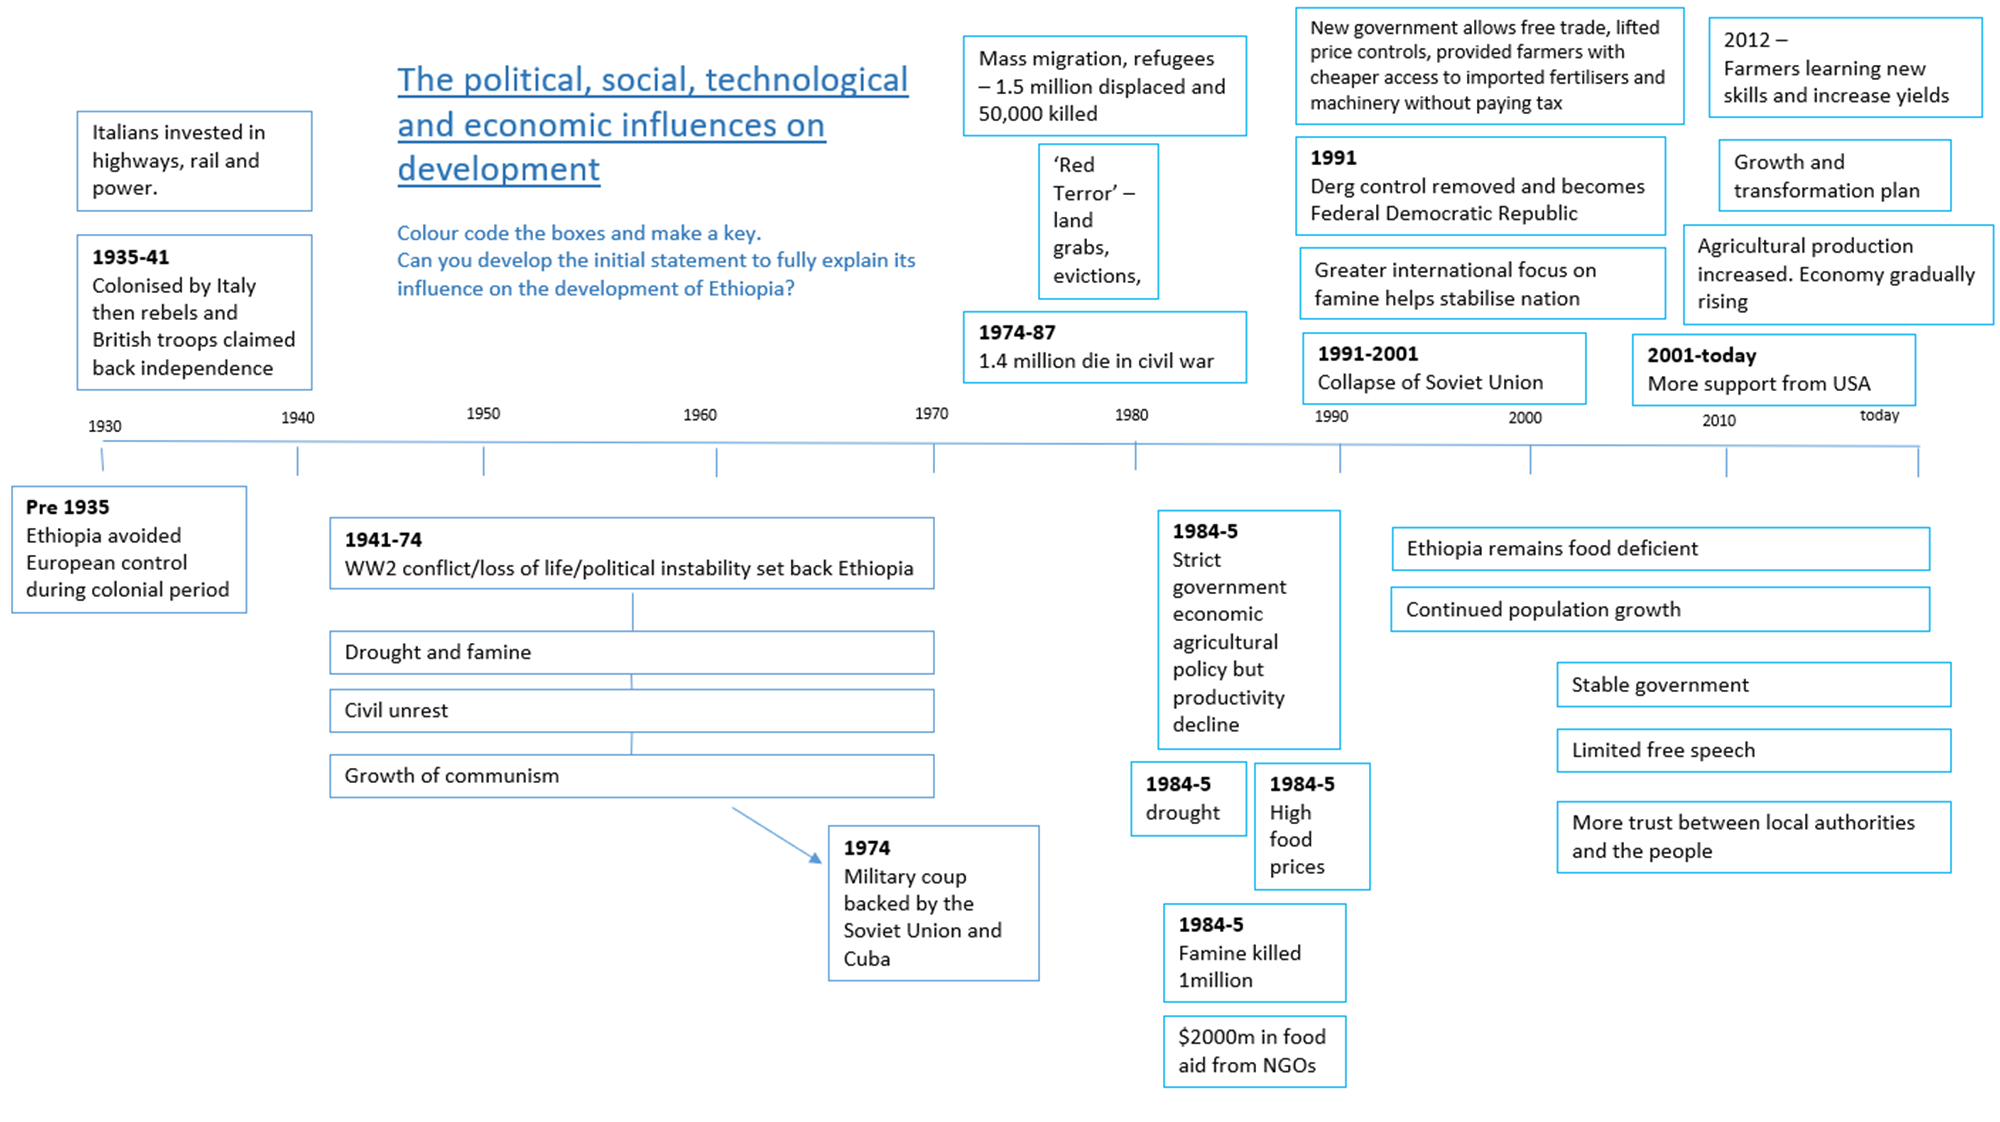
ethiopia history
UK location
western europe
35km off the coast of france
coastline along the north atlantic ocean, north sea, irish sea, english channel & celtic sea
uk: the political union between the nations of england, wales, scotland & northern island. United Kingdom of Great Britain and Northern Ireland. as a whole is a sovereign state, but each nation is a country in its own right
great britain: england, scotland, wales & associated islands. no norther ireland
british isles: purely geographical term - great britain, ireland (northern + republic) & all smaller islands
the isle of man and channel islands aren’t part of the UK but are crown dependencies - self governing but UK is responsible for defence & international relations
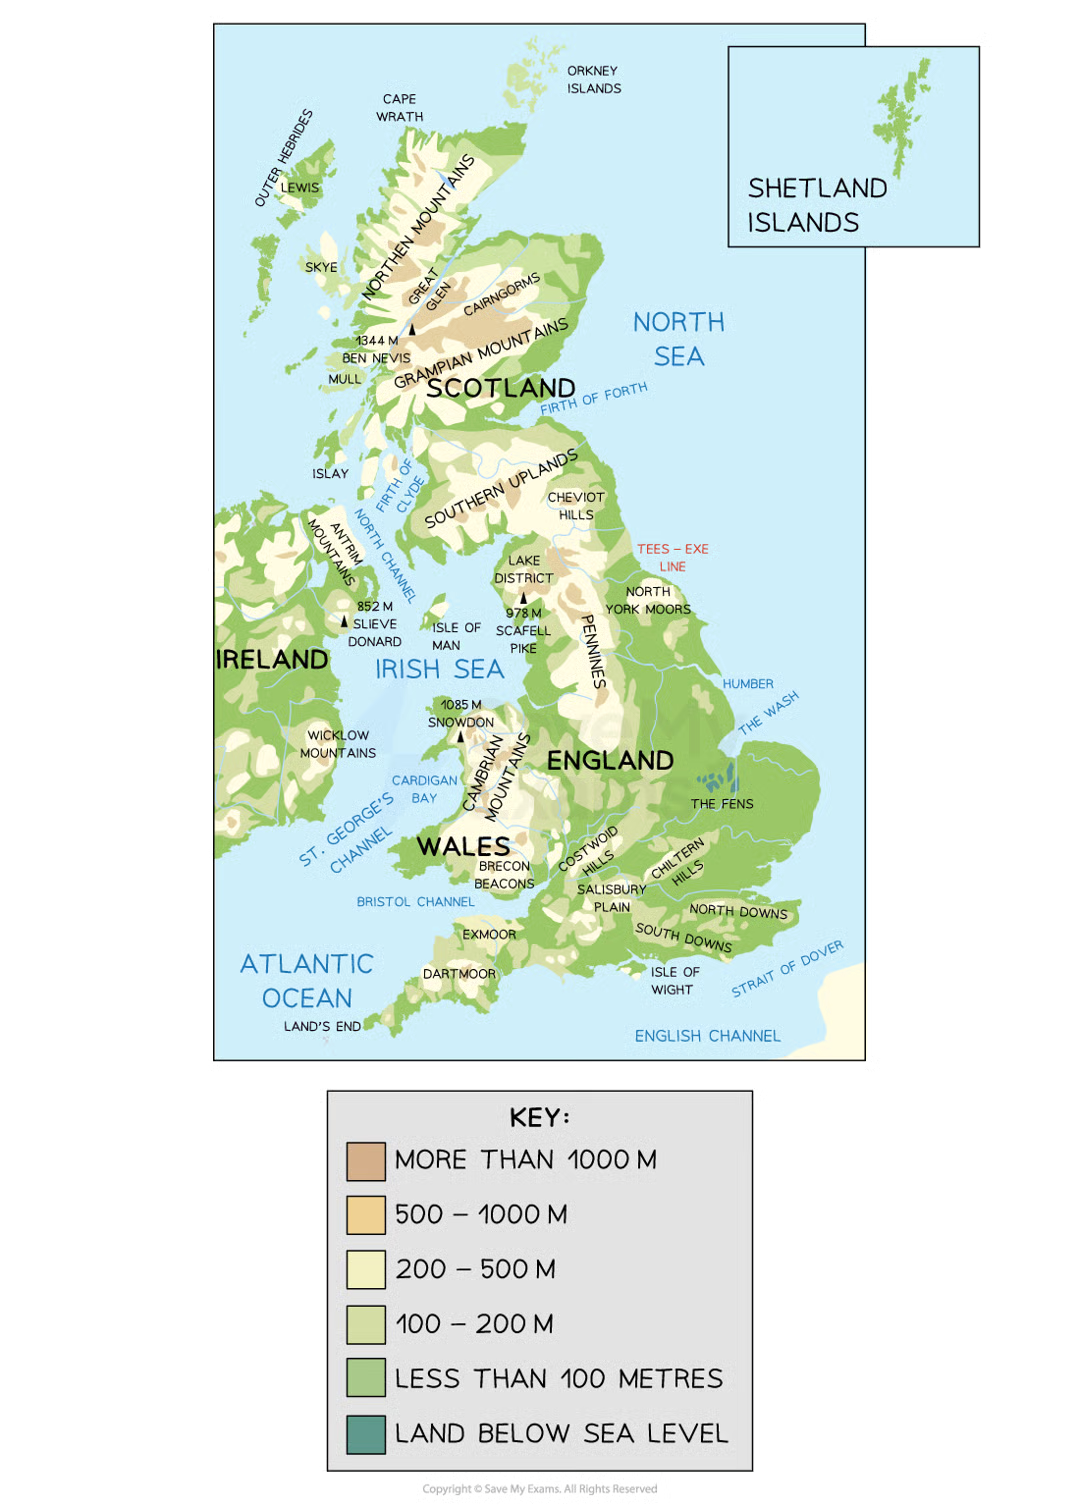
uk physical features
scotland & wales - mountainous regions. northern ireland has 3 main mountainous regions. the pennines are a ridge of mountains running down northern england. few roads / settlements but beautiful scenery & sparsely populated
coastal areas are low-lying especially in S & E - land is flat & more suited to settlements, roads & railways
the rest is made up of gently rolling hills & isolated high grounds & moors
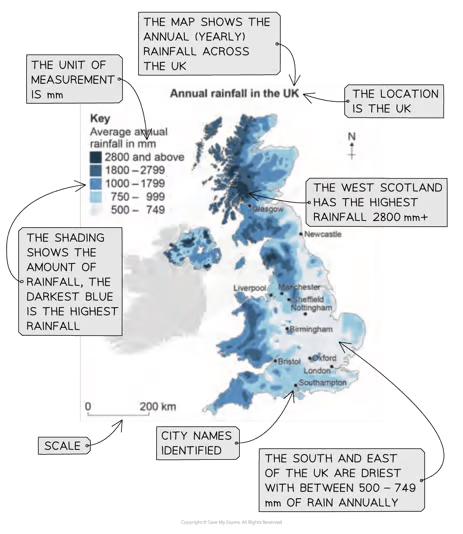
uk precipitation
highest in the north & west - average 2800mm annually. lowest in south & east - average 500-750mm annually
rivers transport precipitation from mountains to sea + natural lakes acting as storage for rain
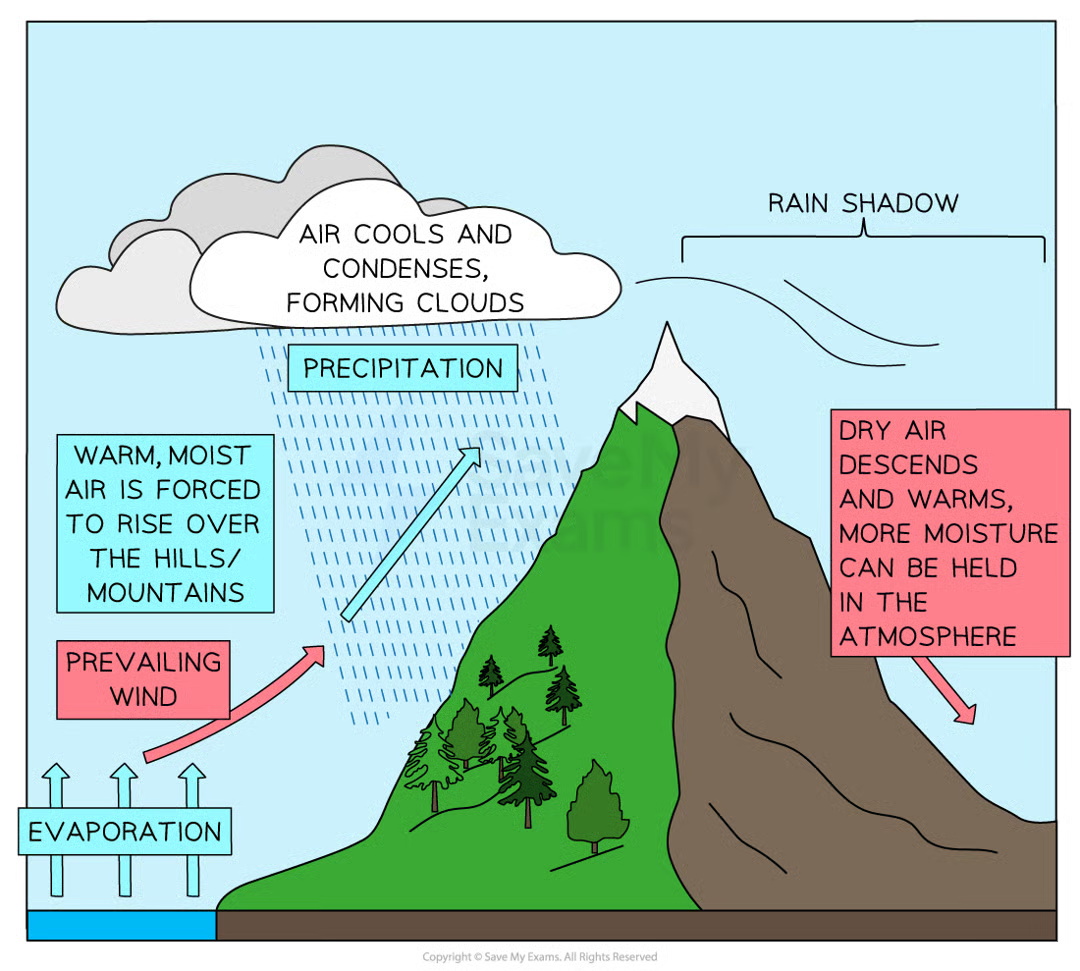
uk relief rainfall
the atlantic ocean + prevailing south westerly winds bring warm moist air. when it reaches the UK it’s forced to rise over the mountain ranges in the west, cooling & condensing to form clouds that rain. this leaves only dry air to carry on over the crest of the mountain, creating a rain shadow (dry area on the other side)
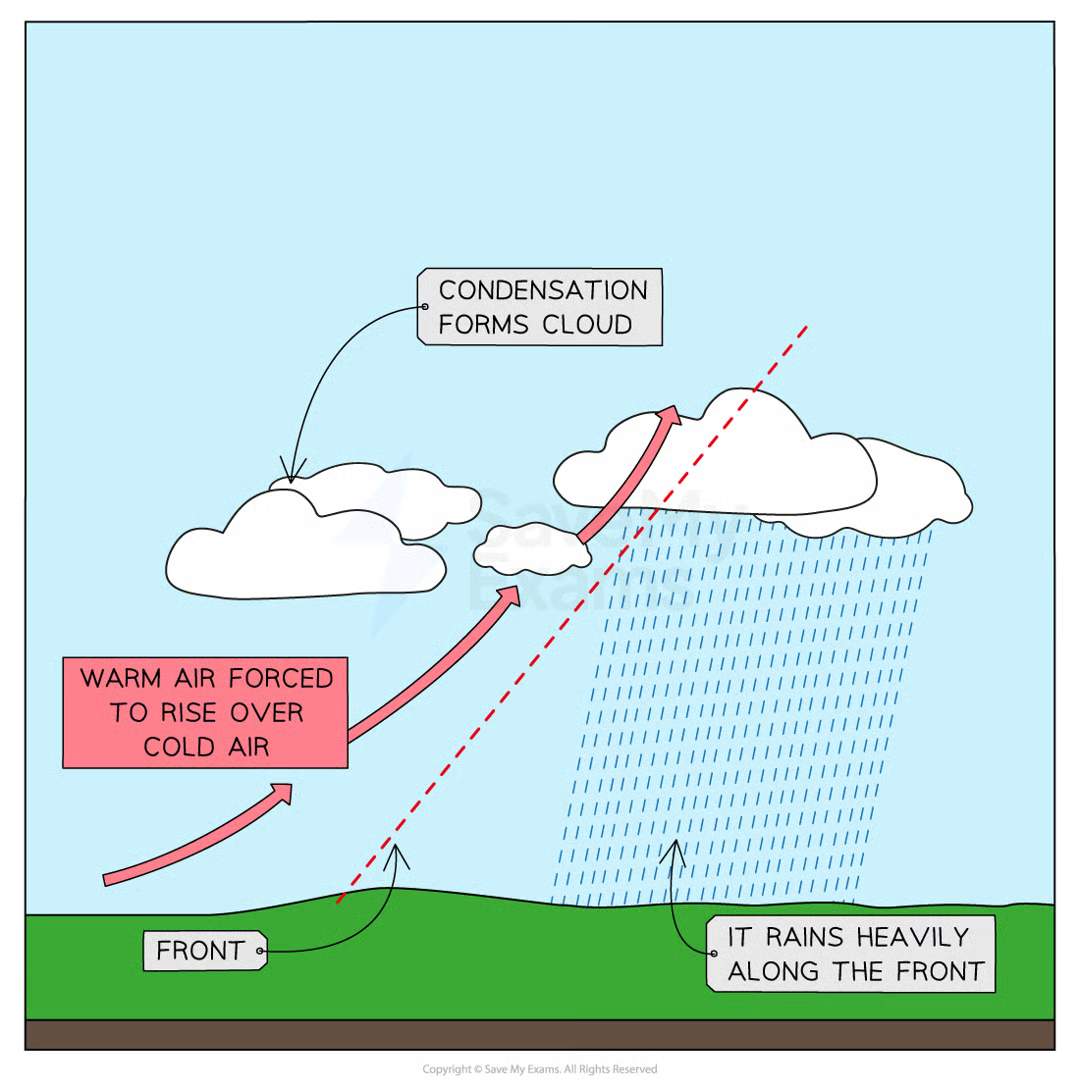
uk frontal rainfall
because of its position the warm SW winds meet the descending northerly cold polar air. the warm air is forced to rise over the cold air, cooling & condensing into heavy rain
this happens across the British isles & is the most common reason for rain
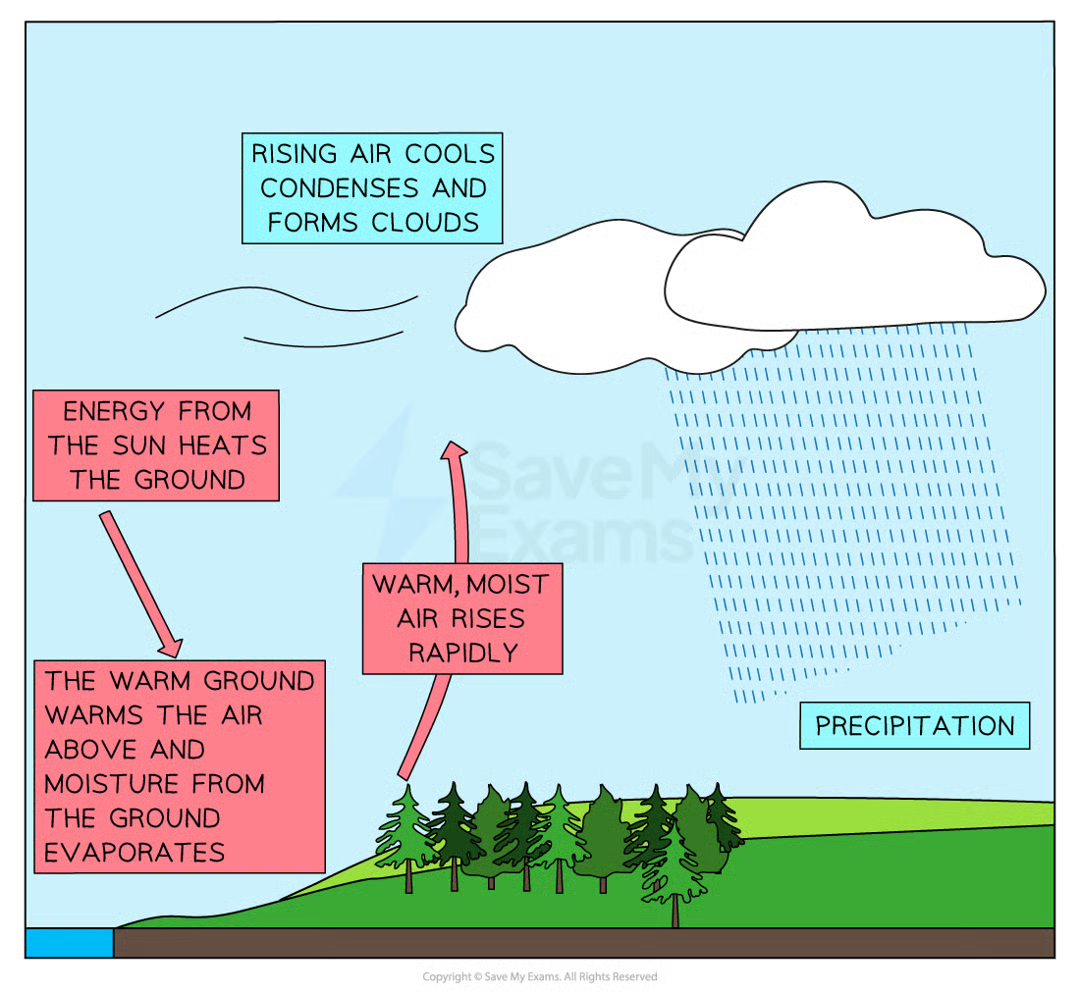
uk convectional rainfall
occurs when the ground heats the air above it. happens in the summer, particularly during heatwaves
the sun heats the ground which releases heat, warming the air above. warm air rises rapidly then cools & condenses to form clouds which can produce heavy rainfall & thunderstorms
uk water stress
rain is unevenly spread, leaving parts of the nation under or over supplied
most rain falls in the N & W but the greatest water demand is in the E & S (higher population, agriculture, industry)
solutions:
transfer water from wet areas to drier areas via pipeline eg water from north wales → liverpool
construction of new resevoirs to capture & store water in the east eg ardingly & arlington resevoirs in sussex
water conservation - repairing leaky pipes, encouraging people to use less water, installing water meters in new homes
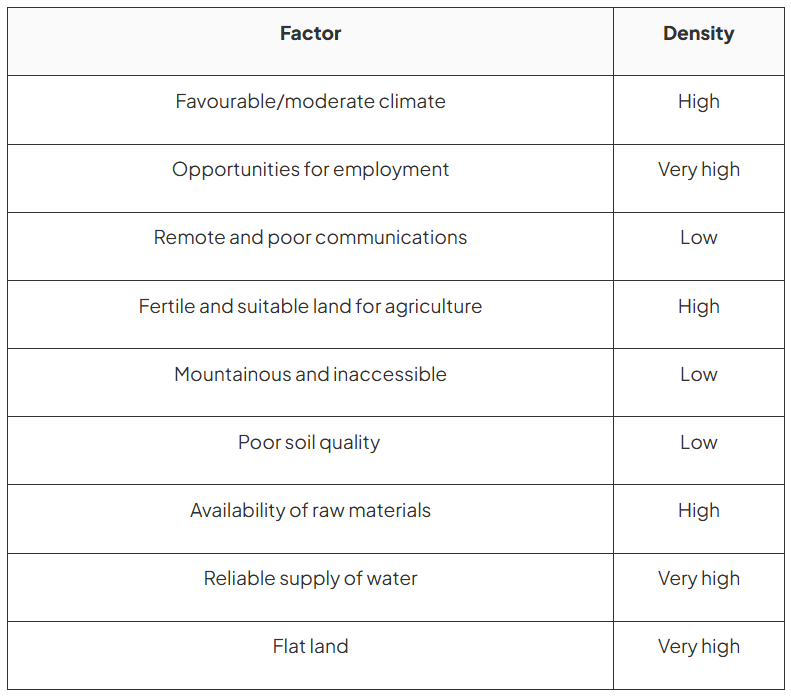
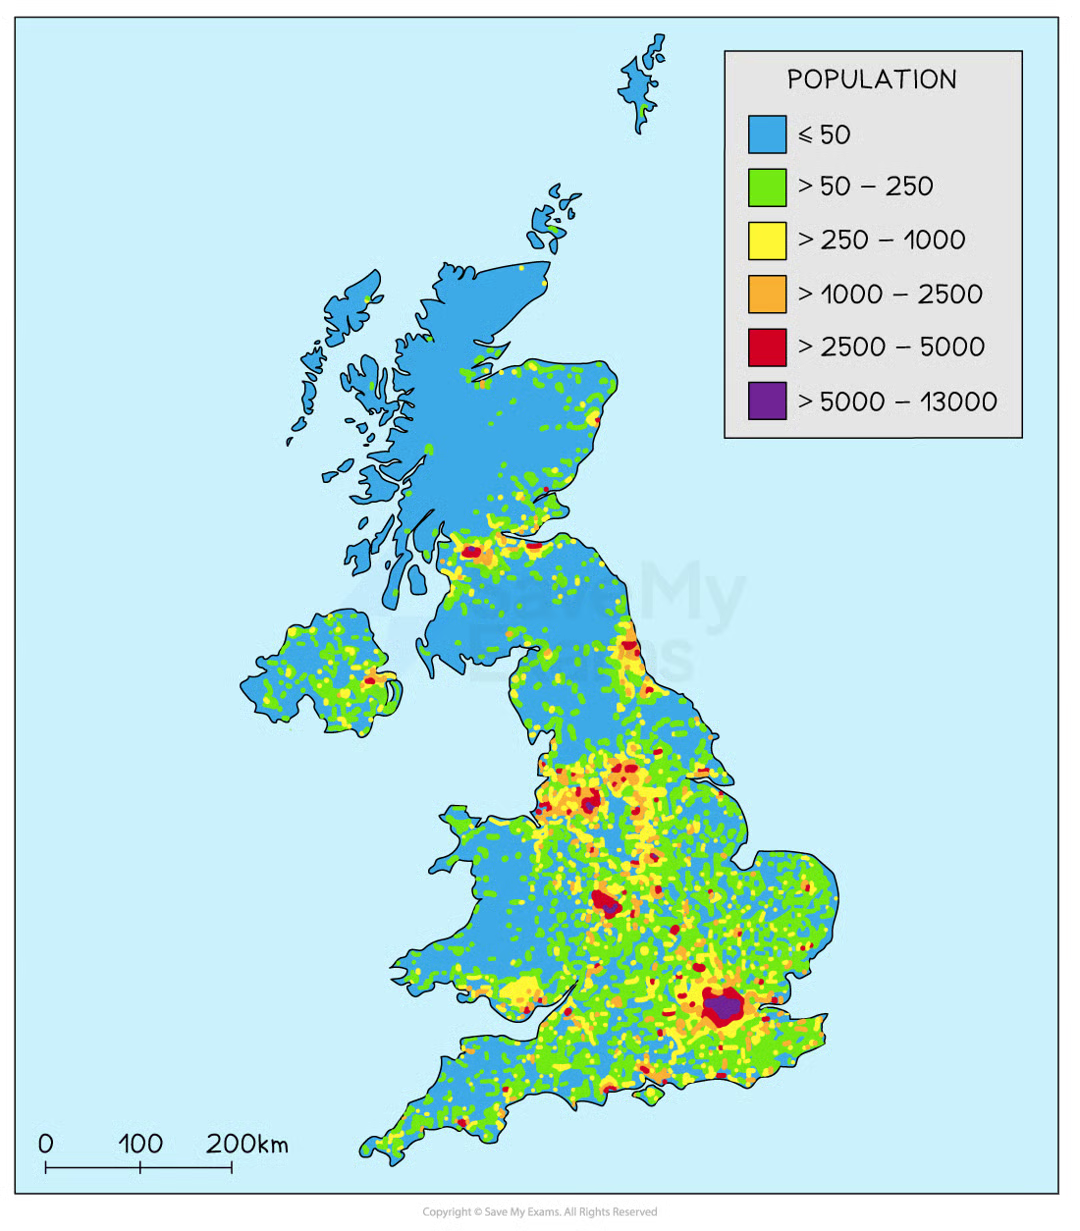
UK population density
uneven. average is 281 people per km2 but in urban areas (eg london) this can be over 5000, but in rural areas it can be less than 50
most populous region is the SE with cities (london, birmingham, manchester) & areas with attractions, employment & entertainment. lowest density in northern scotland - mountainous landscape, unpredictable climate. the rest has a high density population due to gentle hills, moderate climate & excellent transport links
uk land use
most of the UK is farmland & divided into grass (52%), arable (20%) & forest (12%). the rest is urban (14%), water (1%) and other (1%)
mountainous regions have rough pastures & moorlands, with a harsh climate & poor soil so crop growth is limited. main farming is sheep
grasslands in the west have a mild wet climate, ideal for rich pastures for beef, dairy & sheep
in the higher lands of wales rough pasture is good for sheep farming
arable farming in the S & E england due to warmer sunnier drier climate, suitable for crop & flower growing
coniferous woodlands in northern england, wales & scotland - poor soils & remote areas use for timber production
urban areas increase & growth is spiralling outwards. some cities are contained in a green belt (eg london) but others (eg southhampton) are spread over a greater distance
uk housing shortage
rise in population + growth of urban areas = housing shortage
rn the UK needs to built 250,000 homes a year but only ½ of that is being built. this means house prices are rising & becoming too expensive due to high demand
there’s also local opposition to new planning of housing estates, green belts preventing urban sprawl & reducing opportunity to build new houses & the price of land rising due to demand
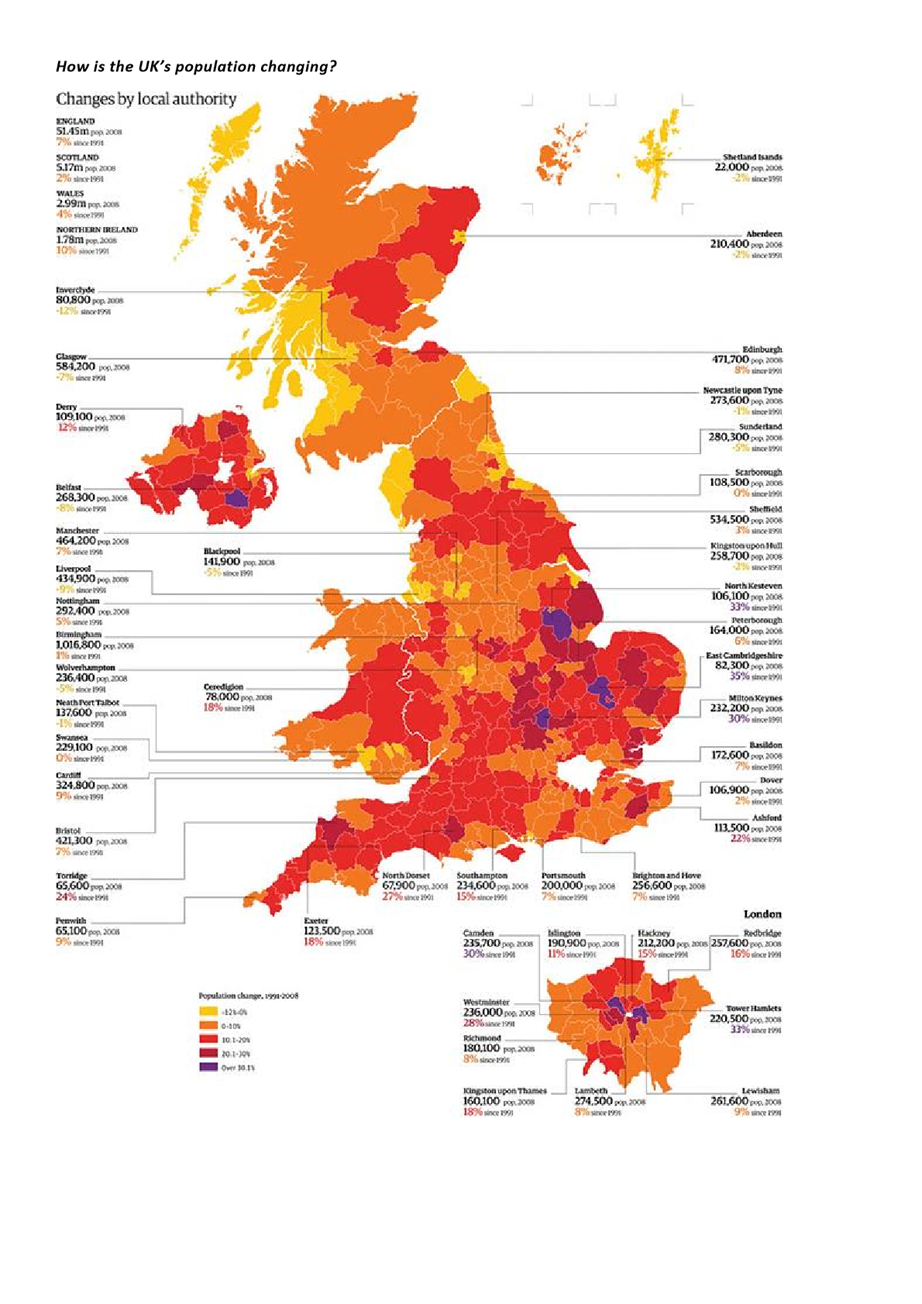
uk population trends
UK population is 69 million people
over the last 50 years it’s grown by nearly 20% (10 mil people). by 2030 its expected to reach 70 million people
growth is due to natural increase (births greater than deaths) and net migration (in migration greater than out migration)
migration
the movement of people across an official boundary, either internationally or nationally, with the intention of creating a permanent place of residence (permanent = more than 1yr)
2 types:
internal / national
external / international
impact of national migration on the UK
before the 18th century most of the population lived in rural areas, relying on agriculture for employment
during the 19th century the industrial revolution saw a rapid rise in the number of people concentrated in cities as they migrated from rural areas to find employment in the better paying secondary sector
now the uk is in the post industrial phase & the population is spread around the cities with urban sprawl
internal migration has led to the population density of the uk - majority of people live in urban areas
impact of international migration on UK
waves of migrants
during the 1850s irish famine
in the 1950s from the west indies seeking employment
from eastern europe after EU enlargement & removal of barriers
refugees from syria & ukarine etc
10 million of the 60 million usual residents in the UK were born outside the UK (17%) - 1 in 6 people
india is the most popular country of origin + pakistan, ireland, poland
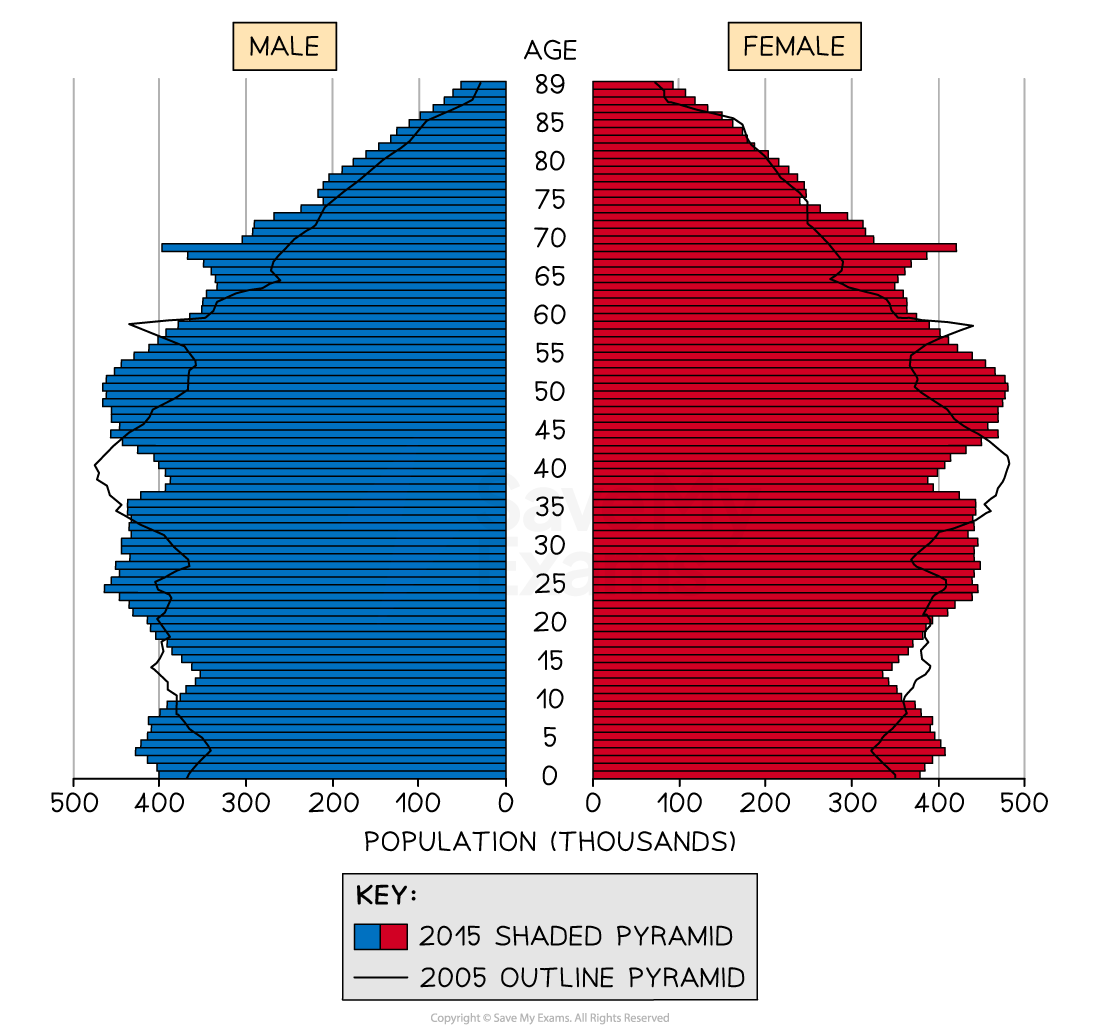
uk immigration age structure
most immigrants are young with young families of their own
in 2021 nearly 30% of births were to non UK born women
the total fertility rate increased for uk born woman to 1.54, but the rate for non uk women stayed at 2.03
in 2021 the most common country of origin for non uk born fathers was pakistan & romania was the most common for mothers
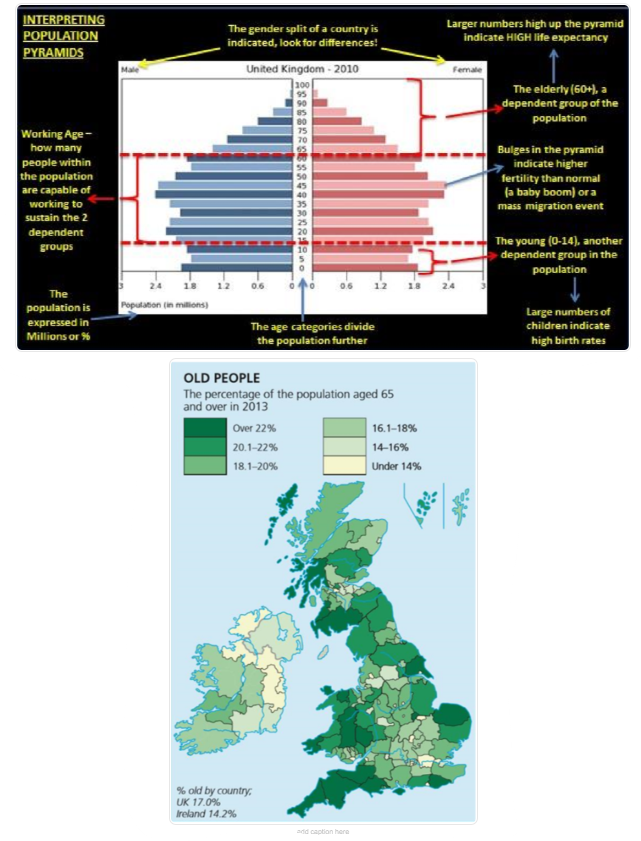
uk changing age structure
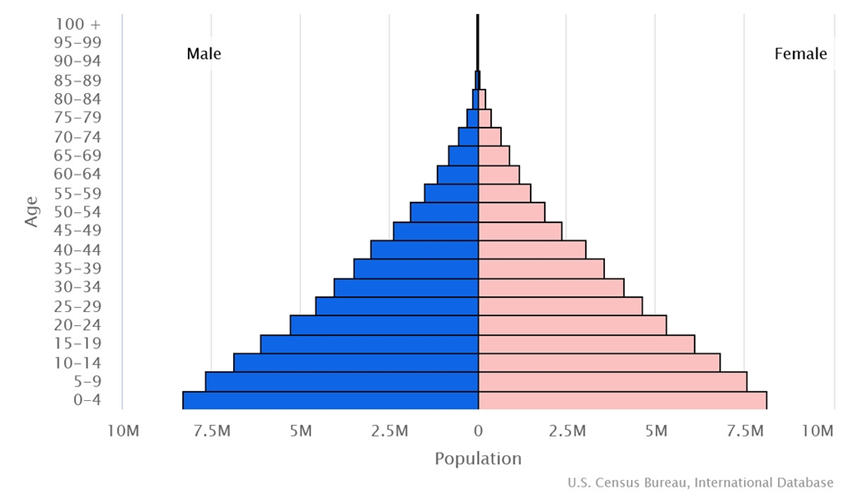
demographic transition model
based on historical population trends of 2 demographic characteristics (birth & death rate) to suggest stages that a countries total population growth rate cycles through as it develops economically
illustrates the 5 generalised stages of population change that countries pass through as they develop, based on the changes in western countries eg the UK. shows how birth & death rates change over time & how this affects the overall population as the country develops.
the gap between birth & death rates is natural change
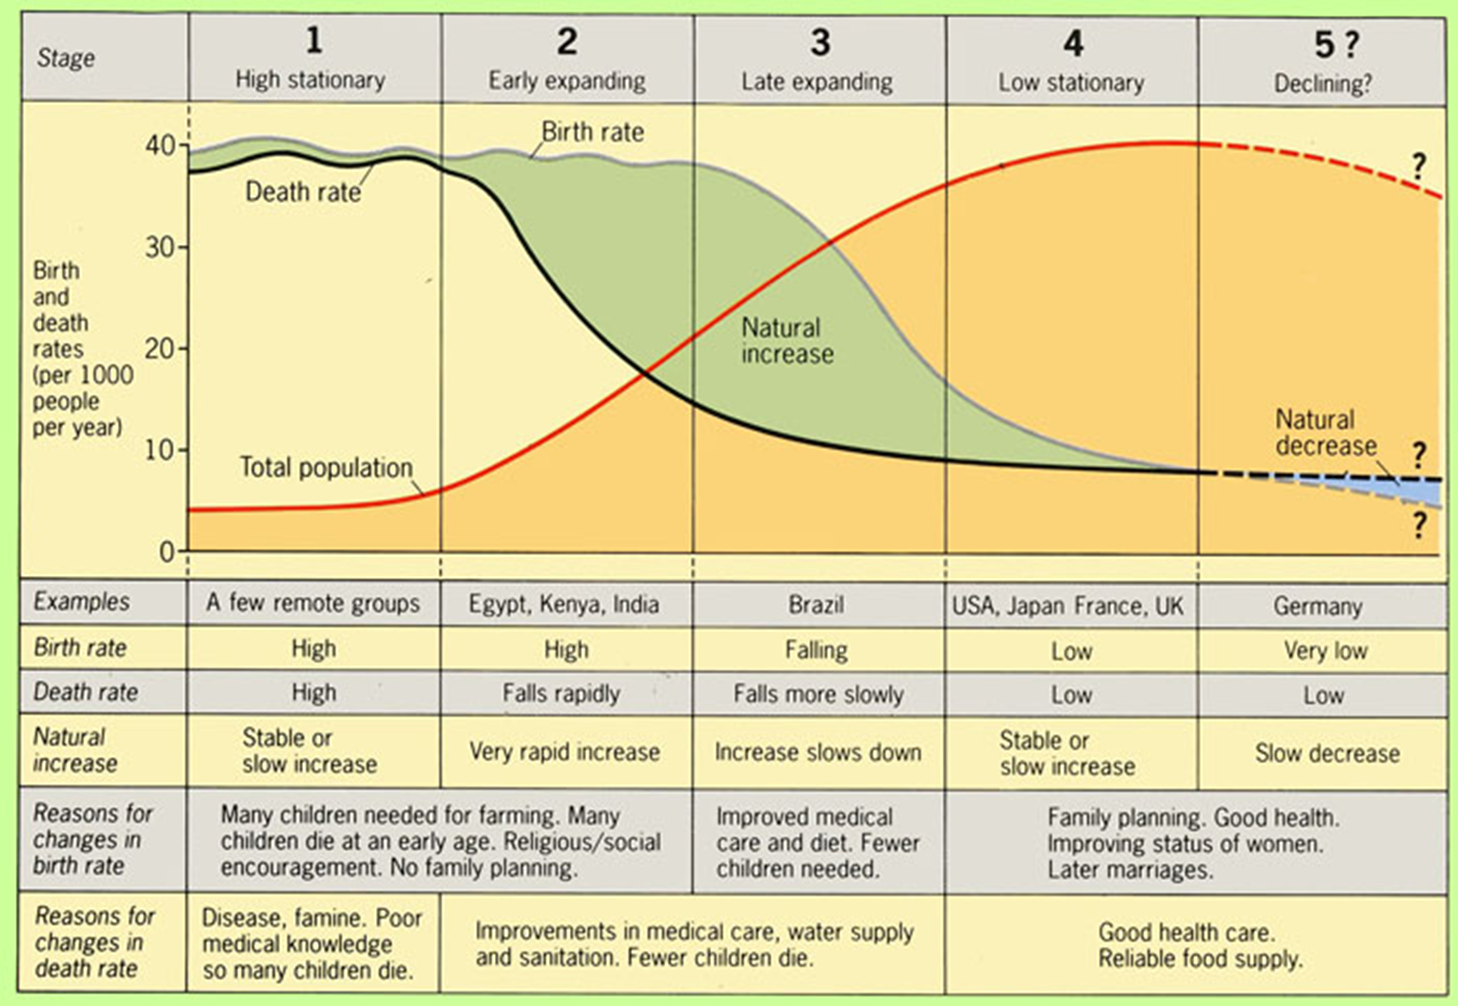
high fluctuating birth & death rates, population low & stable
early expanding as birth rates stay high but death rates rapidly fall & natural change increases
late expanding as birth & death rates decline rapidly - rapid natural change
low fluctuating birth & death rates, population stays high & stable, little natural change
decline? death rate increases but birth rates decline further, natural change falls
it’s unclear if the UK has entered stage 5 as this is unsustainable & not desirable. japan & berlin have & are struggling to find enough people to look after their young & old dependents
uk ageing population
~18% of the UK population are over 65
there’s more older people in coastal areas especially in E & SW england - popular due to warmer temps. lower in northern ireland & in big cities
urban core areas have the youngest average ages - 39 in major conurbations, 46 in remote rural areas
UK ethnic diversity
18% of the population belong to a black, asian, mixed or other ethnic group (2021), an increase from 14% in 2011
in bristol 28% of the population is from an ethnic minority group (up from 15% in 2011). this change has been driven by polish, somalian & indian people. bristol hosts 45+ religions, 187 countries of birth & 91+ main langs spoken
the mix of cultures means bristol’s entertainment & hospitality industries are world famous. the food industry is wide & varied and the community is accepting of new cultures
the st paul’s carnival is hosted to integrate & celebrate bristol’s ethnic diversity & brings visitors from all over the country, boosing bristol’s economy
economic changes
a country’s industrial structure = the % of people performing economic activities (the producing / buying / selling of goods & services)
economic activities can be grouped in to 4 sectors:
primary: the growth / extraction of raw materials - farming, fishing, mining, forestry
secondary: materials being processed to product a finished product - manufacture, food processing, factories, clothes, steel production etc
tertiary: the provision of a service - nurses, lawyers, shop assistants, chefs
quaternary: provision of specialist info / knowledge - research & development, hi-tech scientists, information technology

industrial revolution
when a country’s economy moves from mainly primary economic activities to secondary. the rapid growth of factories & mass production of products
uk economic changes
the uk has been in a post industrial stage since the 1970s and was the first country to experience the industrial revolution, and this involved the most significant economical changes - 1750 - 1900
pre-industrial stage: most people worked in the primary sector (farming / mining)
industrial stage: people moved into the secondary sector (manufacturing)
post-industrial stage: emphasis on service based tertiary & quaternary sectors of research & ICT
uk clarke-fisher model
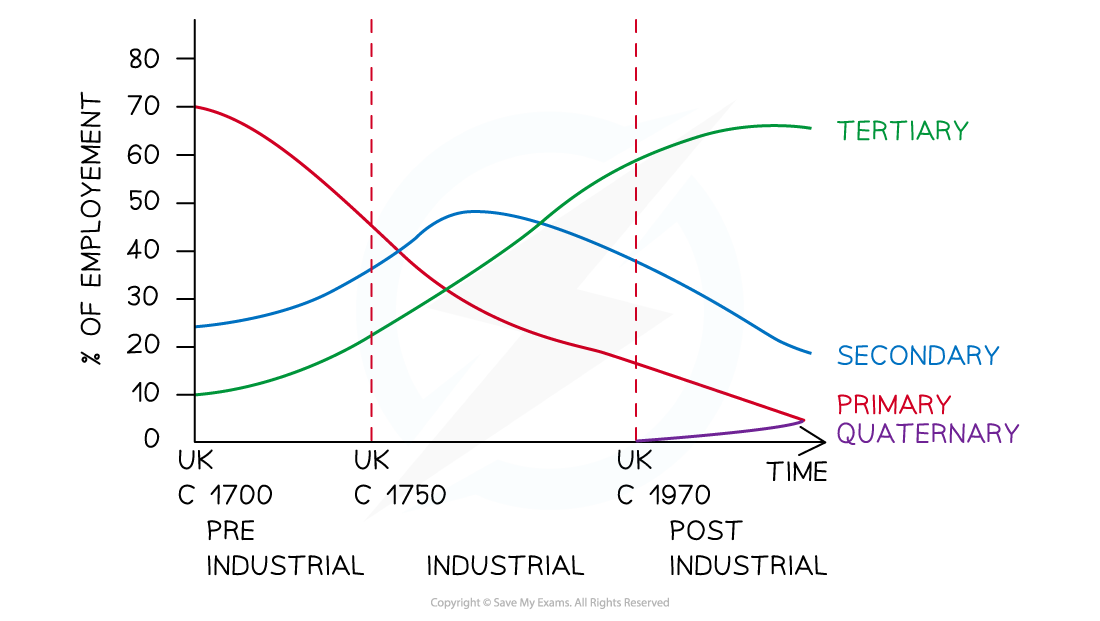
in the pre-industrial era most (70%) of people were employed in the primary industry & lived in rural areas
by the 1850s primary jobs were declining rapidly - 15% in 1900
in 1900 most people (>60%) worked in secondary jobs with tertiary jobs steadily increasing
by the 1950s tertiary jobs overtook secondary ones
from 1970s+ there’s a steady rise in the quaternary sector
by 2000 >70% of people were employed in tertiary jobs