Quantitative techniques and single-cell microbiology
1/45
There's no tags or description
Looks like no tags are added yet.
Name | Mastery | Learn | Test | Matching | Spaced | Call with Kai |
|---|
No analytics yet
Send a link to your students to track their progress
46 Terms
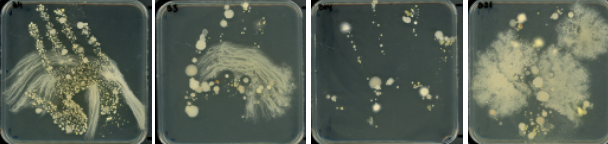
What does handprint microbiota contain?
Skin bacteria: possibly
Micrococcus luteus (small yellow colonies),
Staphylococcus epidermidis (small, thick white colonies),
Staphylococcus aureus (golden colonies)
Fungus:
Fluffy structure
(colonies differ in shape, size, colour)
How to determine bacterial growth or any other traits?
Bulk measurements
Clear media = more turbid media = higher density of bacteria
Compare e,g, if a strain grows better than the other strain in diff. conditions
Absorbance at (?) to assess the density of bacterial cells in batch culture using bulk measurements?
Absorbance at 600 nm A600 (optical density)
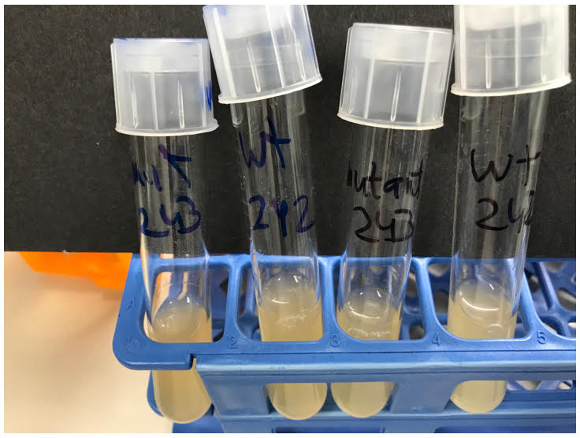
Where are bacteria cultivated?
Culture tubes, flasks, microplates
Population growth graph
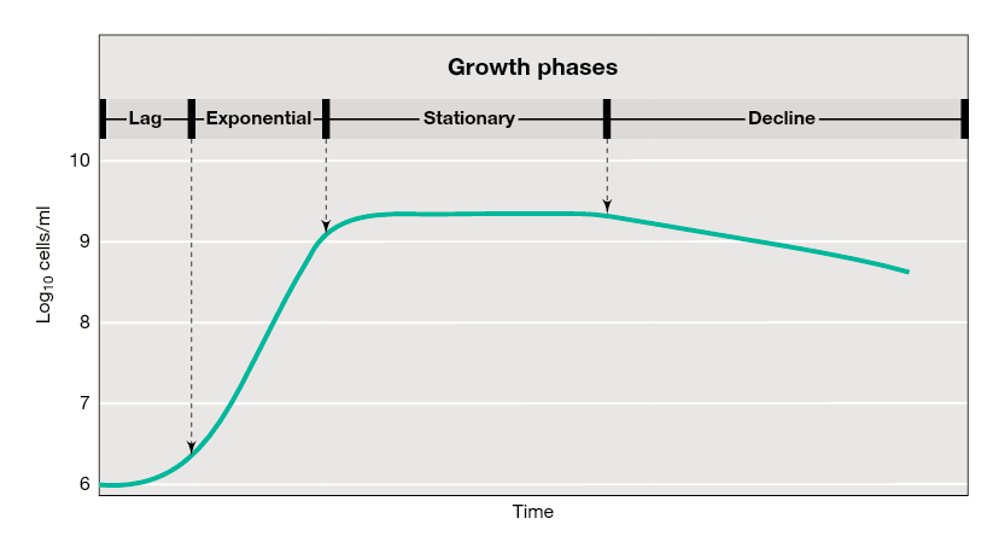
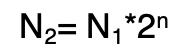
Measuring binary fission by calculating (estimate) the number of generations n
Calculate (estimate) the number of generations n from the increase in the number of cells N (or optical density)
Measuring binary fission by calculating the bacteria growth rate µ
Calculate the growth rate µ from the increase in the number of cells N during time t (t2-t1), in the exponential phase
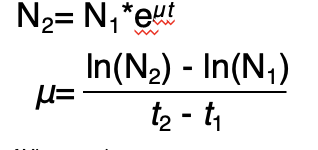
Why natural logarithm (ln) used when calculating the bacteria growth rate µ?
Describe the exponential nature of bacterial growth (population doubles at regular intervals)
→ (ln) linearizes exponential growth by converting the multiplicative way of exp. growth to an additive one
Data distribution: Problems of averages in data
Averages can hide important variations in data, and they don't take into account the distribution of data.
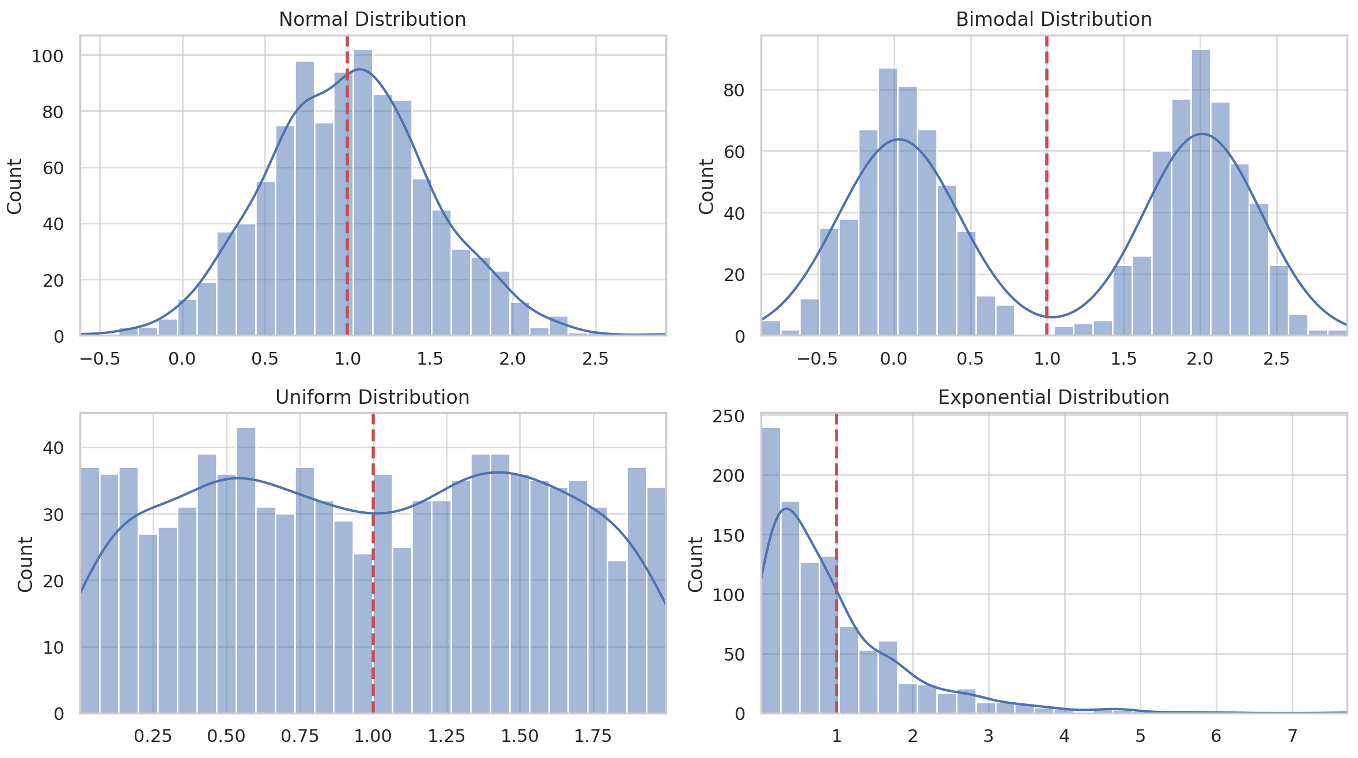
Data distribution: Averages in data example
Mean, median, mode, or other statistical measures that summarize data.

Phenotypic heterogeneity: Cell-to-cell phenotypic variation and temporal variation snapshot - What happen in both variation?
Fate of individual cells would be different in time
Diff temporal variation when measuring
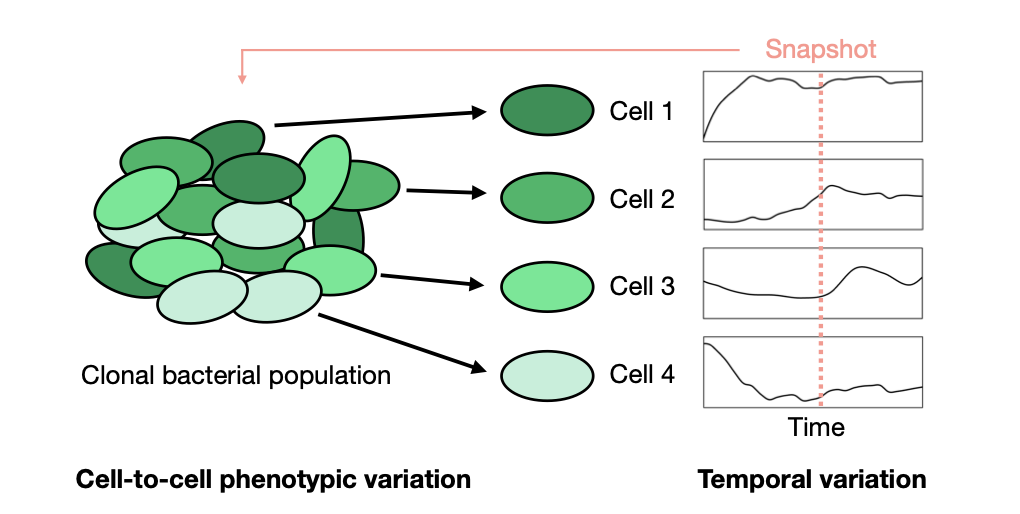
Exhibiting individuality in bacteria means
Phenotypic differences between genetically identical cells, even in homogeneous environments
→ Phenotypic heterogeneity/variation
Causes of phenotypic heterogeneity (diff gene expression): 2 Non-genetic sources
Diff. Environmental stimuli - diff. response
Stochastic gene expression – cellular & biochemical processes vary between cells and over time
(chemical reaction define w few mol. → noisy biochem processes)
Examples of phenotypic heterogeneity: Dormant cells v.s. persister cells at promoting individuality
Dormant cells: Metabolically inactive state/growth arrest
Persister cells: Dormancy and other molecular mechanisms underlie persistence
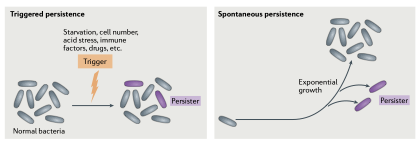
Examples of phenotypic heterogeneity: 2 types of persistence in persister cells
Triggered persistence: by stress conditions (env.)
e.g. limitation of different nutrients, high cell number, acid stress, immune factors and exposure to immune cells
Spontaneous persistence (by chance & rare): Few persister cells are made when the culture is in steady-state expo. growth
Examples of phenotypic heterogeneity: Speciality of persister cells
Cells tolerant to antibiotics (antibiotic persistence) and other stressors
(no active ribosome to be targeted when persisting(resting))
Why do persistent bacteria need to be looked out for in antimicrobial treatment?
Need to make sure all disease-causing cells are eradicated
OR ELSE, surviving persistence might cause reinfection (they can become active again)
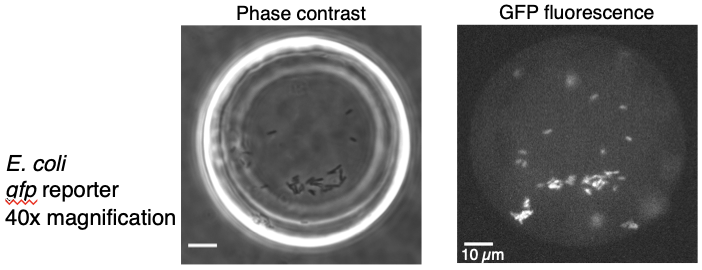
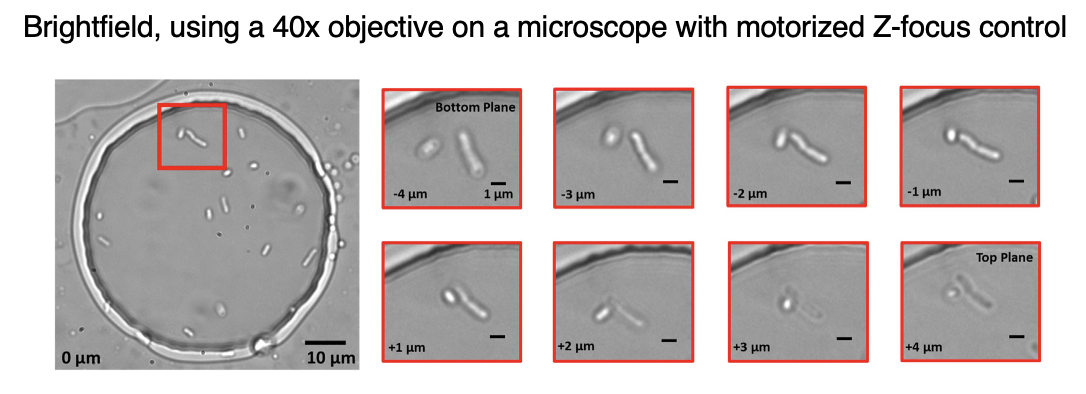
Single-cell microbiology techniques: Light microscopy types
Brightfield (low-contrast)
Phase contrast
Fluorescence
→ use 40x (100x) magnification
→ need Environmental control
Single-cell microbiology techniques: Time-lapse measurement
Understand temporal variability by allowing cells grow in a temp. across time
Single-cell microbiology techniques: Brightfield/phase contrast microscopy limitation?
Rely on transmitted light

Single-cell microbiology techniques: Phase contrast usage?
Enhances contrast for transparent and colorless specimens
Single-cell microbiology techniques: Fluorescence microscopy usage?
Uses high-intensity light (such as UV or blue light) to excite fluorescent molecules (fluorophores) within the sample.

Single-cell microbiology techniques: What does fluorescent dyes show?
Specific metabolic state of the cell/ membrane potential/ viability of the population
Single-cell microbiology techniques: What does fluorescent probes show?
Oligonucleotides hybridise bacterial cells
→ detect 16sRNA
-» diversity in population to quantify the abundance of diff species in a population
Fluorescent gene reporter systems usage (GFP)
Report and estimate on gene expression (regulated or constitutive gene expression)
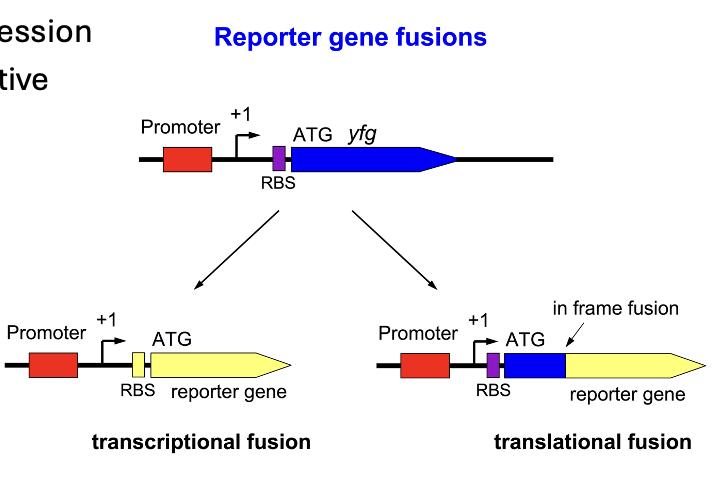
What does regulated gene expression refers to?
Genes that are turned on or off in response to specific signals or conditions (respond to stimuli)
Usage of fluorescent reporters for regulated gene expression
To monitor these changes by linking the reporter gene to regulatory sequences of the gene of interest

When is the fluorescent reporter expressed? and what does it show?
When the gene is activated
→ which allows gene expression visualization and quantification in real time
What does Constitutive gene expression refer to?
Genes that are continuously expressed at a constant level
Usage of fluorescent reporters for constitutive gene expression
By linking them to constitutive promoters, which drive continuous expression of the reporter gene
→ providing a constant fluorescent signal.
Single-cell microbiology techniques: Flow cytometry - how it works
Cells pass through a narrow channel one at a time
Light is used to illuminate the cells in the channel
A series of sensors detect the specific light scattering and fluorescent characteristics of each cell
Fluorescence-activated cell sorting
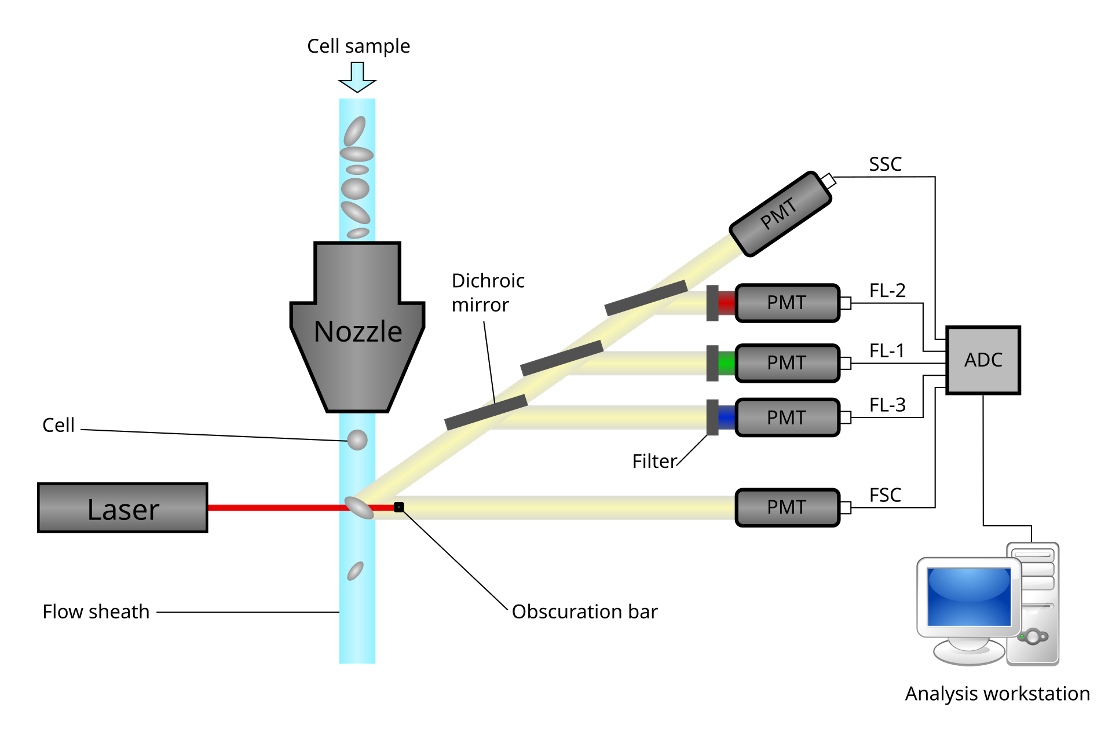
Single-cell microbiology techniques: Flow cytometry - Analyse rate
Analyze 10,000-100,000 bacterial cells in 1 minute
(faster than microscopy)
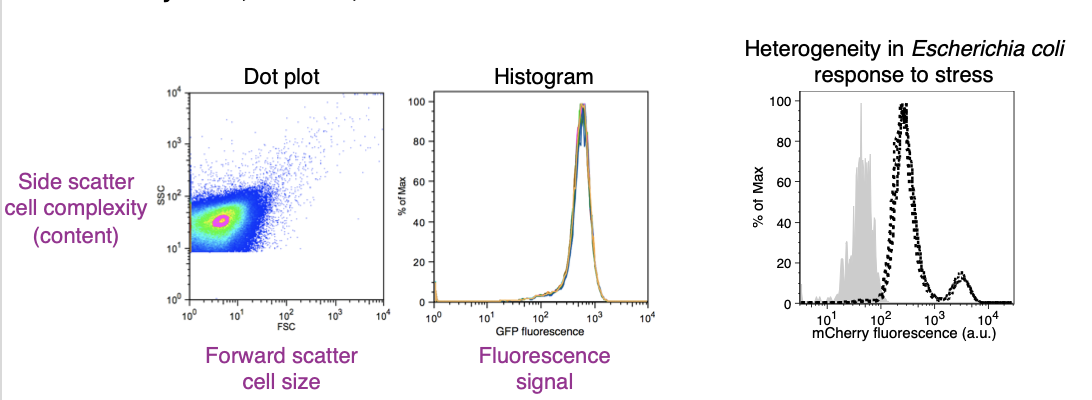
What is happening in Flow cytometry results
3 infos:
Forward scatter cell size - both prop.
Side scatter cell complexity - tells how known, fluid or granular a cell is
→ dot graph: dot = measurements for a cell
Fluorescence signal - histogram distribution
Last graph:
Grey = non stressful condition
Black = stressful
→ increase fluorescence = increase gene expression => also population arising (w diff. fluorescent intensities subpop.)

Single-cell microbiology techniques: NanoSIMS usage
Investigating metabolic complexity of a microbial population or entire community
Cells utilize substrates labeled with stable isotopes, e.g., 2H,13C,15N
Analysis of metabolic activity of single cells
Single-cell microbiology techniques: NanoSIMS (full name)
Nanoscale secondary ion mass spectrometry
Single-cell microbiology techniques: NanoSIMS - what samples used
Microbial sample or culture that is incubated with substrates labeled with stable isotopes
e.g. carbohydrates (source of carbon) or ammonium salts or nitrogen gas (source of nitrogen)
Single-cell microbiology techniques: NanoSIMS - how it works
NanoSIMS
uses an ion source to produce a primary beam of ions
where primary ion beam scans and erodes through entire sample on filter.
→ Scattered secondary ions are transmitted through a mass spectrometer, where the masses are measured.
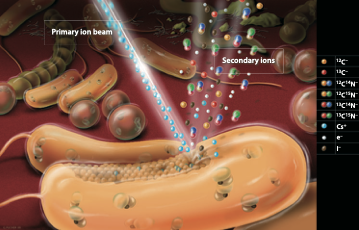
Single-cell microbiology techniques: NanoSIMS - Analysing substrate assimilation
By measuring incorporation of those stable isotope into biomass of microbial cells.
Single-cell microbiology techniques: What can be measured?
Variation in:
gene expression
cell size (morphology)
metabolism
growth (elongation rate)
motility
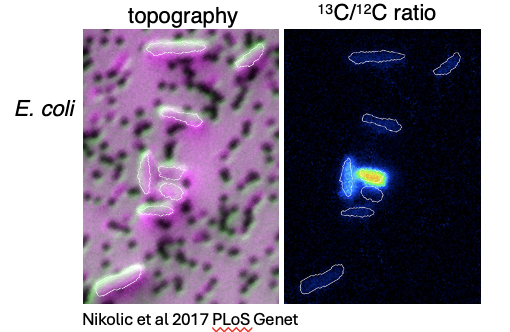
Example of phenotypic heterogeneity in metabolic functions: Methylorubrum extorquens (a member of a phyllosphere community) - what it shows
Growth on methanol (Single-carbon source environment)
Increase in fluorescence = increase in expression of methanol dehydrogenase (fused with reporter gene for MxaF-GFP)
→ NOT ALL CELLS hv same fluorescence intensities = not all use methanol - reflecting variation in growth rates of single cells
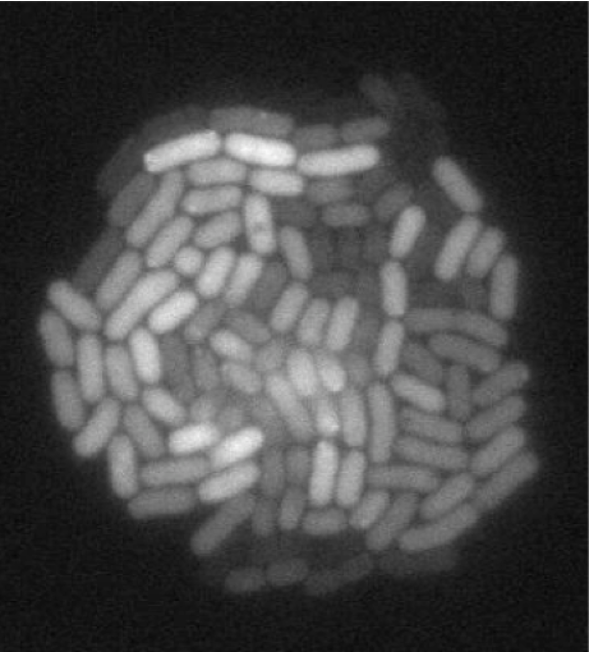
Heterogeneity in virulence: Salmonella Typhimurium - gene fliC
Flagellin gene fliC encodes the majority of flagellum
fliC promoter controls GFP expression during microcolony growth
FliC is a virulence factor of Salmonella that is essential for bacterial adhesion to epithelial cells and for bacterial motility.
(motile? = need Flagellin gene fliC)
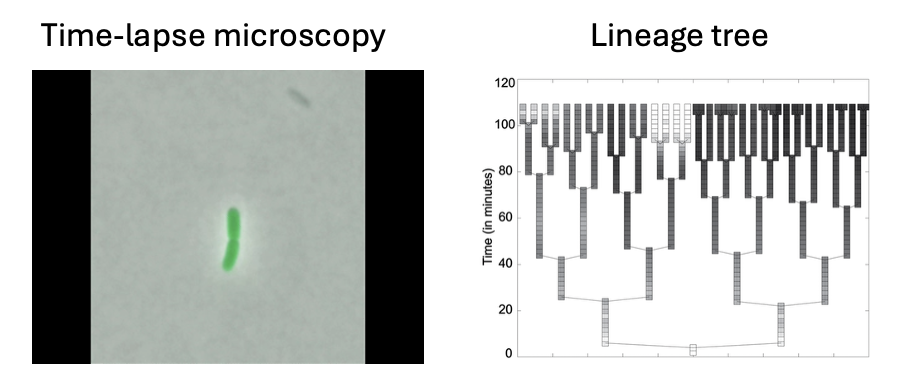
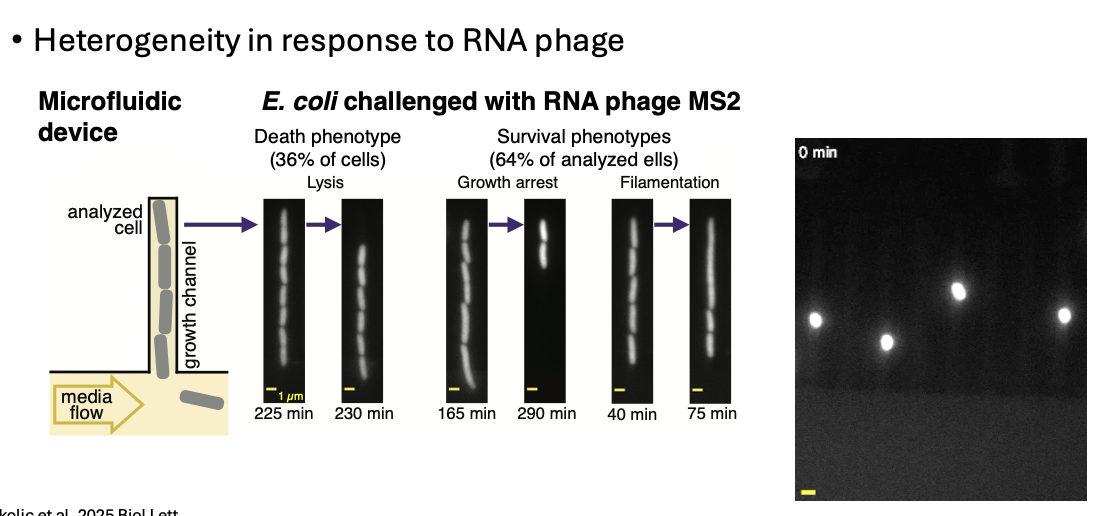
Time-lapse microscopy in a microfluidic device
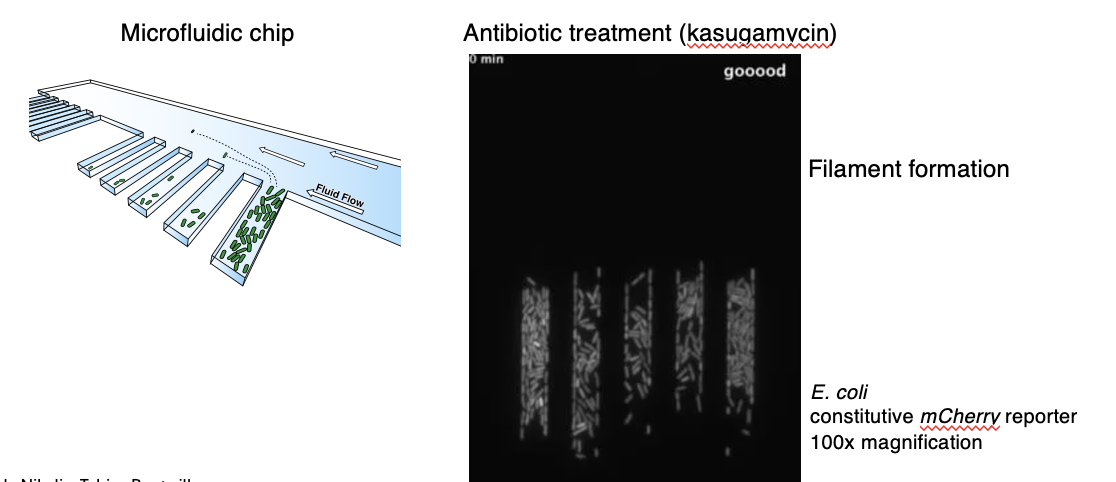
(Kasugamycin inhibits protein synthesis at the step of translation initiation)
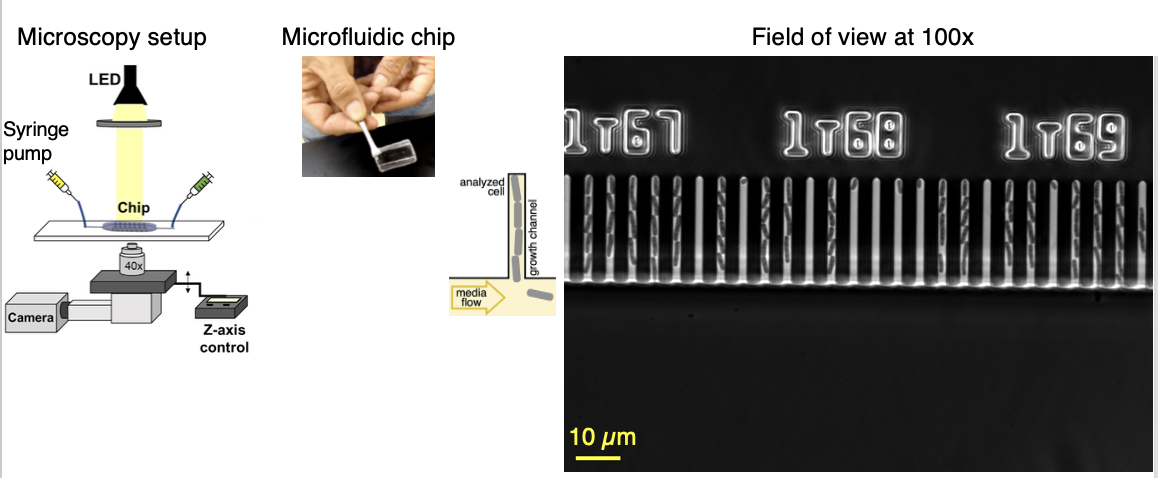
Droplet-based microfluidic technology
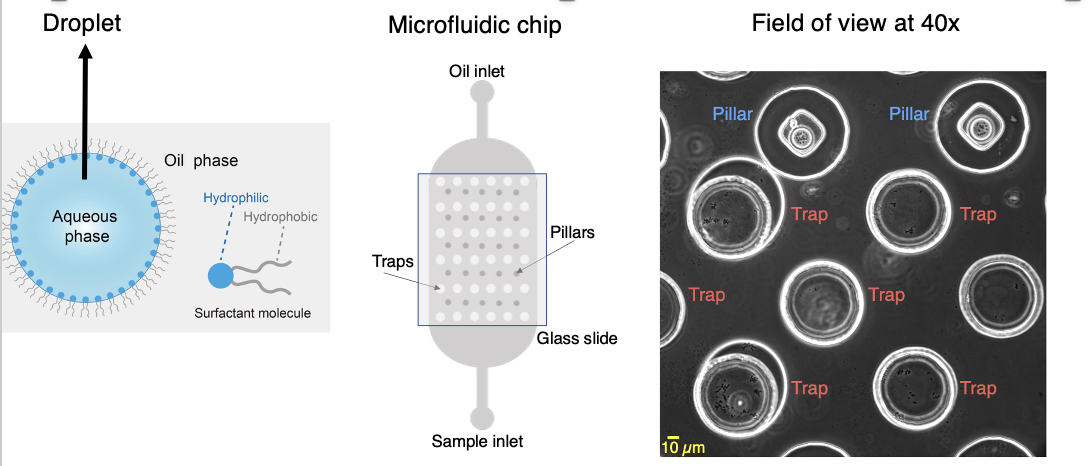
Time-lapse microscopy in a microfluidic device v.s.
Droplet-based microfluidic technology
Bacterial cells growing in 1D or 2D
Confined space, no motility
Continuous inflow of fresh nutrients
Easy switch from one medium to another
3D analysis
Motile bacteria
No inflow of fresh nutrients
Supports bacteria growing as planktonic cells or aggregates
Analysis of single cells and clumps
Droplets can be sorted and analyzed
Examples of current research with Time- lapse microfluidic devices
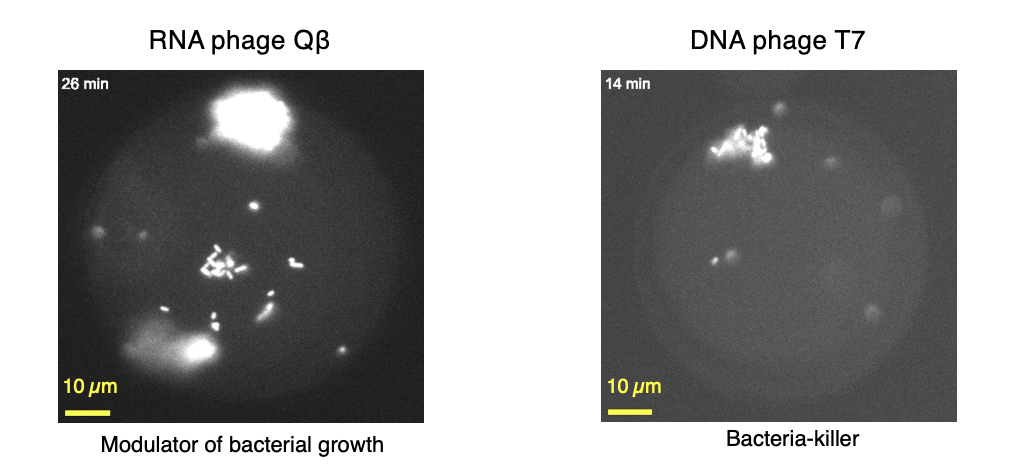
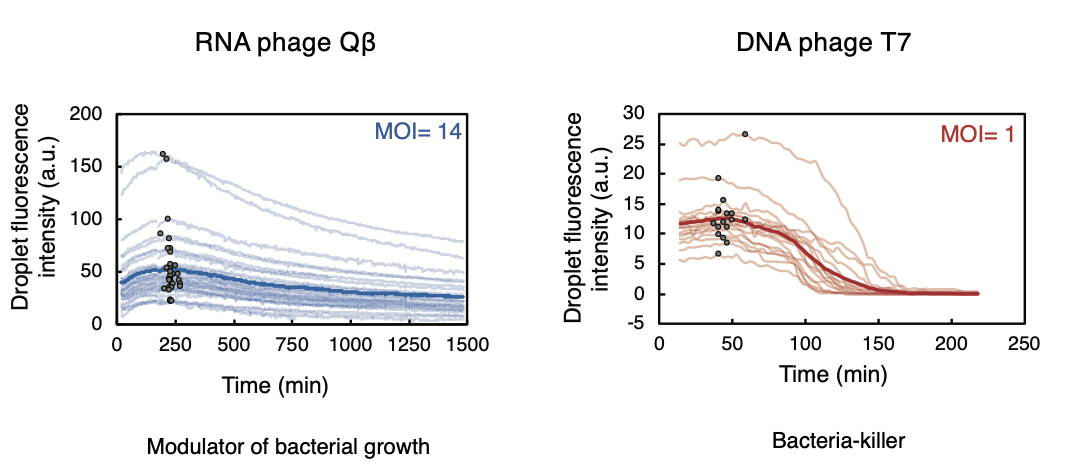
Why designing and choosing phage experiments important in medical studies?
All bacteria are susceptible to phages
Phage is virulent in the experiment until lysis
→ heterogeneous response show
->=> cannot extrapolate impact phages hv on the community just w phage sequences
=> phage could impose diff. response of bacteria (avoid results of antibiotic resistance)
===> avoid phage resistance and tolerance