Unit 7
1/44
Earn XP
Description and Tags
Skill: Selecting Statistical Methods
Name | Mastery | Learn | Test | Matching | Spaced | Call with Kai | Chat |
|---|
No analytics yet
Send a link to your students to track their progress
45 Terms
Why worry about error?
Random variation may result in errors in statistical inference, therefore, conclusions can be uncertain.
What is the t-distribution used for?
To model variation
In what scenario do we use the t-distribution?
When we use s instead of sigma (population st dev)
How does the t-distribution vary from the normal distribution?
More of the area is allocated to the tails of the density curve than in a normal distribution.
What is the relationship between degrees of freedom and the area of the t-distribution tails?
As the degrees of freedom increase, the area in the tails of a t-distribution decreases.
Why do we use interval of values?
To estimate parameters and account for uncertainty
What is the appropriate confidence interval procedure for estimating the population mean of one quantitative variable for one sample?
one-sample t-interval for means
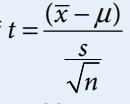
What is the formula to find the test statistic (t)?
A t-distribution with n −1 degrees of freedom
When do you use matched pairs?
When the samples are NOT independent from one another (ex: identical twins, same student w/ diff tests)
What is the appropriate confidence interval procedure for estimating the population mean of one quantitative variable for matched pairs?
Matched pairs = treat as one sample; find the difference between pairs of values and perform one-sample t-interval for means
List the conditions to calculate confidence intervals to estimate a population mean:
1) Independence between samples and/or between each unit
2) Randomness
3) If sampling w/o replacement, sample <10% of population
4) Check for APPROXIMATE normality
How do you check that the sampling distribution of x bar is approximately normal?
If skewed: n > 30 (CLT applies)
If n < 30, then you can use histogram or normal probability plot to check that data is not skewed and is free from outliers
How do you find the critical value t* with n-1 degrees of freedom?
1) use the critical value table w/ df —> if two tailed, do 1-(conf%)/2 for significance level; if one sided, then table can be used as is
2) OR calculator
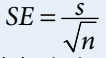
What is the standard error for a sample mean?
What is the margin of error for a one-sample t-interval for a mean?

What is the point estimate for a population mean?
The sample mean (x bar)
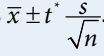
What is the confidence interval for the population mean for one sample with
unknown population standard deviation?
*This also applies to the mean difference between values in matched pairs.
Will a confidence interval for a population mean always contain the population mean?
No, because each interval is based on data from a random sample, which varies from
sample to sample.
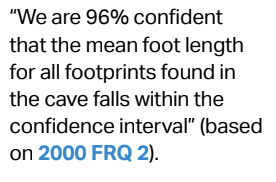
How do you interpret the confidence interval for a population mean?
We are C% confident that the confidence interval from ___ to ___ captures the population mean of (population mean in context)
What is the relationship between the width of a confidence interval and the sample size of a population mean, given all other things remain the same?
The width of a confidence interval for a population mean tends to decrease as the sample size increases due to less variability.
What is the width of the interval for one mean?
It is proportional to:

What is the relationship between the width of a confidence interval and the confidence level of a population mean, given all other things remain the same?
The width of the confidence interval for a population mean increases as the confidence level increases.
What is the appropriate test for a population mean with unknown population standard deviation (sigma)?
one-sample t-test for a population mean
What is the appropriate test for the mean difference between values in matched pairs with unknown population standard deviation (sigma)?
paired t-test for a population mean; think of matched pairs like one sample because the “sample” is the difference values
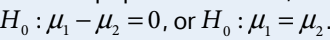
What are the null and alternative hypotheses for a one sample t-test for a population mean?

When finding the mean difference, μd, between values in a matched pair, it is important to:
define the order of subtraction
List the conditions to make statistical inferences when testing a population mean:
1) Independence between samples and/or between each unit
2) Randomness
3) If sampling w/o replacement, sample <10% of population
4) Check for APPROXIMATE normality
The p-value is computed by assuming what?
Assuming that the null hypothesis is true, i.e. that the true population mean is equal to the particular value stated in the null hypothesis
When do you reject the null hypothesis?
When the p-value is < alpha / significance level
When do you fail to reject the null hypothesis?
When the p-value is > alpha / significance level
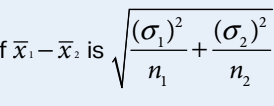
What is the standard deviation for a difference of two population means?
What is the appropriate confidence interval procedure for one quantitative variable for two independent samples?
A two-sample t-interval for a difference between population means.
What are the conditions to calculate confidence intervals to estimate a difference of population means?
1) Independence - samples should be independent from each other
2) Randomness (samples or random experiment)
3) when sampling w/o replacement, n1 < 10%N1 and n2 < 10%N2
4) Check for normality (approx) - if skewed, both n1 and n2 should be greater than 30
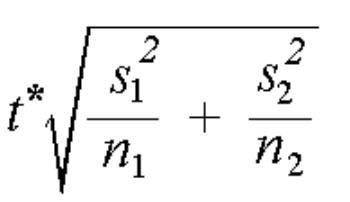
What is the margin of error for the difference of two population means?
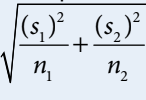
What is the standard error for the difference in two sample means with sample standard
deviations?
What is the point estimate for the difference of two population means?
X bar 1 - x bar 2

How do you calculate the confidence interval for a difference of two population means
where the population standard deviations are not known?
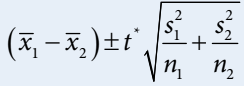
In the confidence interval for a difference of two population means with sample st dev, what do + t* represent?
The critical values for the central C% of a t-distribution with appropriate degrees of freedom
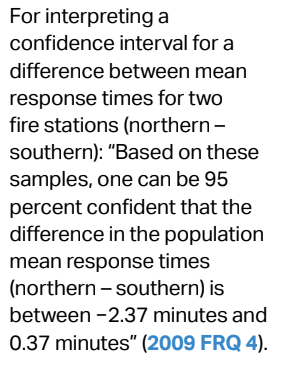
How do you interpret a confidence interval for a difference of population means?
In repeated random sampling with the same sample size (n), approximately C% of confidence
intervals created will capture the difference of (population means in context).
Identify the effects of sample size on the width of a confidence interval for the difference of two means, given all other things remain the same.
The width of the confidence interval for the difference of two means tends to decrease as the sample sizes increase.
What is the appropriate testing method for a difference of two population means?
two-sample t-test for a difference of two population means (given QUANTITATIVE var)
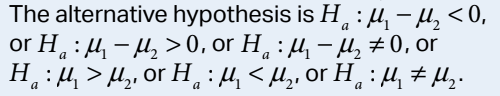
What are the null and alternative hypotheses for a two sample t-test for a difference of two population means?
What are the conditions for the significance test for the difference of two population means?
1) individual observations should be independent from one another
2) randomness stated
3) if sampling w/o replacement, n1 < 10%N1 and n2 < 10%N2
4) normality approx - if skewed, both n1 and n2 > 30; if NOT skewed, distribution of each should be free of outliers (check w/ npp or histogram)
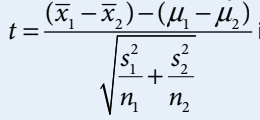
How do you calculate the test statistic (t) for a difference of two means?
How do you find the degrees of freedom for a difference of two population means?
Technology / calculator; BUT the df will fall between of n1 −1 and n2 −1 and n1 + n2 − 2.