Fisheries Management Final :(
1/140
There's no tags or description
Looks like no tags are added yet.
Name | Mastery | Learn | Test | Matching | Spaced | Call with Kai |
|---|
No analytics yet
Send a link to your students to track their progress
141 Terms
Fisheries management
The process of controlling fishery activities through data collection, planning, decision-making, and enforcement to ensure sustainability
Fishery
Activity involving harvesting wild fish or raising fish through aquaculture
Fishery unit
A defined group including fishers, species, gear, area, class of boat, and purpose of fishing
Fisheries management authority
Organization responsible for regulating fisheries, collecting data, enforcing rules, and allocating resources
Fish stock
A discrete, self-sustaining population of a species from which catches are taken
Stock assessment
Scientific evaluation of fish stock status, including size, yield, and exploitation level
Sustainability
Ensuring long-term productivity of fishery resources
Biological objective
Management goal focused on conservation, rebuilding stocks, and preventing species mortality
Economic objective
Goal to maximize profits, income, and reduce variability in fisheries
Social objective
Goal to ensure food security, employment, and community well-being
Political objective
Goal to maintain government support and generate revenue
Indicator
Quantitative measure used to track progress toward management objectives
Target
A specific value of an indicator used as a management goal
Management strategy
A blueprint outlining monitoring, rules, and enforcement in a fishery
Harvest control rule
A guideline that determines how fishing pressure changes based on stock status
Effort control
Regulation limiting fishing activity (e.g., number of boats)
Catch control
Regulation limiting total catch in a fishery, implemented using tools like TAC
Technical measures
Regulations like mesh size, closures, and gear restrictions
Fisheries management cycle
Process where society sets objectives, scientists advise, and managers implement strategies
Boom and bust cycle
Pattern of fishery development, overexploitation, collapse, and potential recovery
Industrialization in fisheries
Increased fishing capacity and demand due to technological advancements
Global fisheries period
Worldwide exploitation and integration of fisheries into global markets
Population vulnerability
Susceptibility of fish populations to fishing pressure based on traits
Life-history traits
Characteristics like growth rate, age at maturity, and fecundity affecting survival and reproduction
Behavioral traits
Species behaviors (e.g., schooling, migration) affecting catchability
Fishing impacts on populations
Changes in size, age, reproduction, and genetics due to fishing
Fishing impacts on communities
Changes in diversity, structure, and species interactions
Trophic cascade
Chain reaction in ecosystems caused by removal of key species (e.g., predators)
Fishing down the food chain
Trend of targeting lower trophic level species over time
Community stability
Ability of an ecosystem to resist or recover from disturbances
Resistance
Ability of a system to withstand change
Resilience
Speed at which a system returns to its original state
Reactivity
Magnitude of change after disturbance
r-selected species
Species with fast growth, early reproduction, and many offspring
K-selected species
Species with slow growth, late maturity, and few offspring
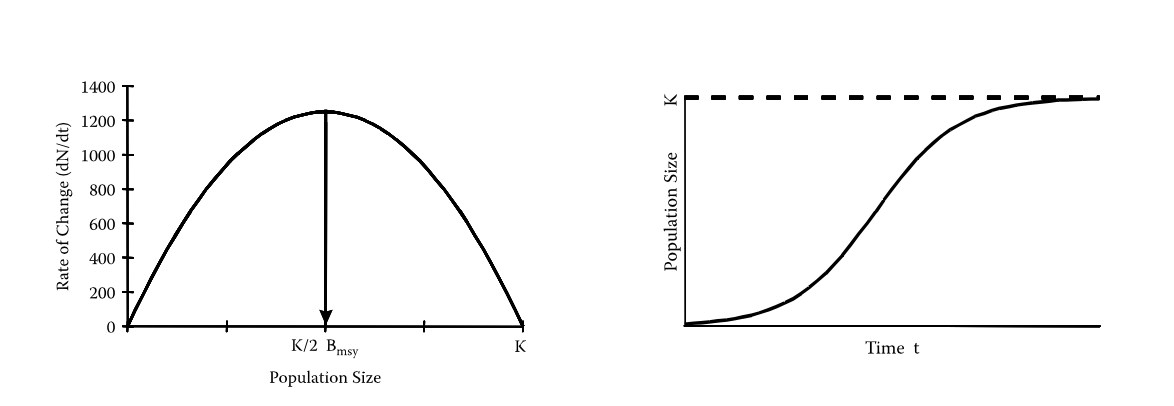
Logistic growth
Population growth that slows as it approaches carrying capacity
dN/dt = rN(1-N/K) Where: N = population size, r = intrinsic growth rate, K = carrying capacity
Rmax
Maximum population growth rate, indicating recovery potential
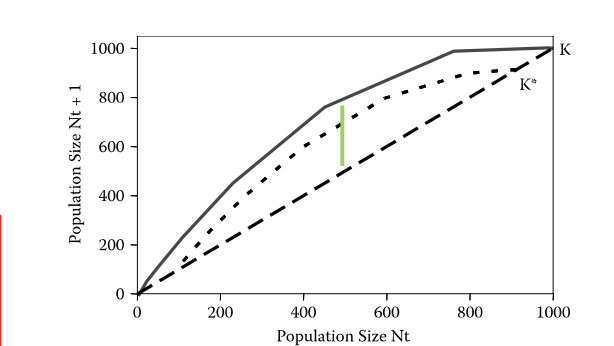
Carrying capacity (K)
Maximum population size an environment can sustain
CPUE (Catch per Unit Effort)
Measure used as an index of abundance. shown as C/E = qN where C = catch, E = effort, q = catchability, N = abundance
Catchability (q)
Efficiency with which fish are captured; C = qEN, higher q = easier to catch fish, depends on gear/behavior/technology
Fisheries independent data
Data collected through scientific surveys
Fisheries dependent data
Data collected from fishing activities (e.g., logbooks)
Gear selectivity
Tendency of fishing gear to catch certain sizes/species
Length-weight relationship
Equation describing fish weight as a function of length; commonly modeled as W = aL^b
Growth coefficient (b) in length-weight relationship
b = 3 indicates isometric growth, b > 3 indicates fish become relatively heavier with size, and b < 3 indicates fish become relatively thinner with size
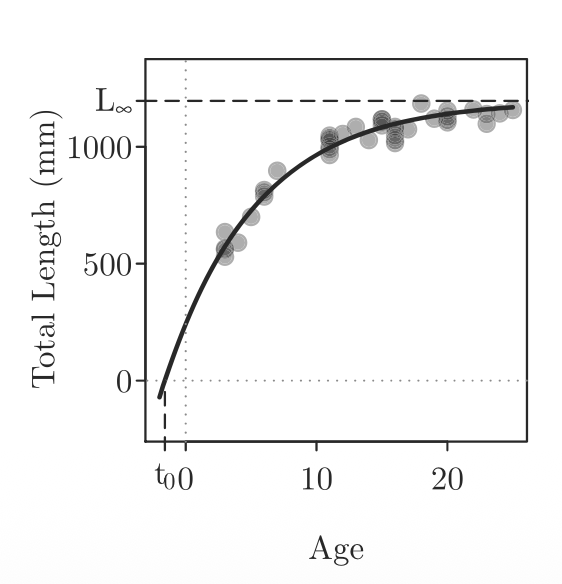
Von Bertalanffy growth model
Mathematical model describing individual fish growth over time; predicts length as a function of age and approaches a maximum asymptotic size (L∞). Parameters include K (growth rate) and t₀ (theoretical age at zero length). typically shown as Lt=L∞(1-e^-K(t-t0))
Natural mortality (M)
Rate at which fish die from natural causes
Fishing mortality (F)
Rate at which fish are removed by fishing, shown as F = Z - M
Total mortality (Z)
Sum of natural and fishing mortality, shown as Z = F + M
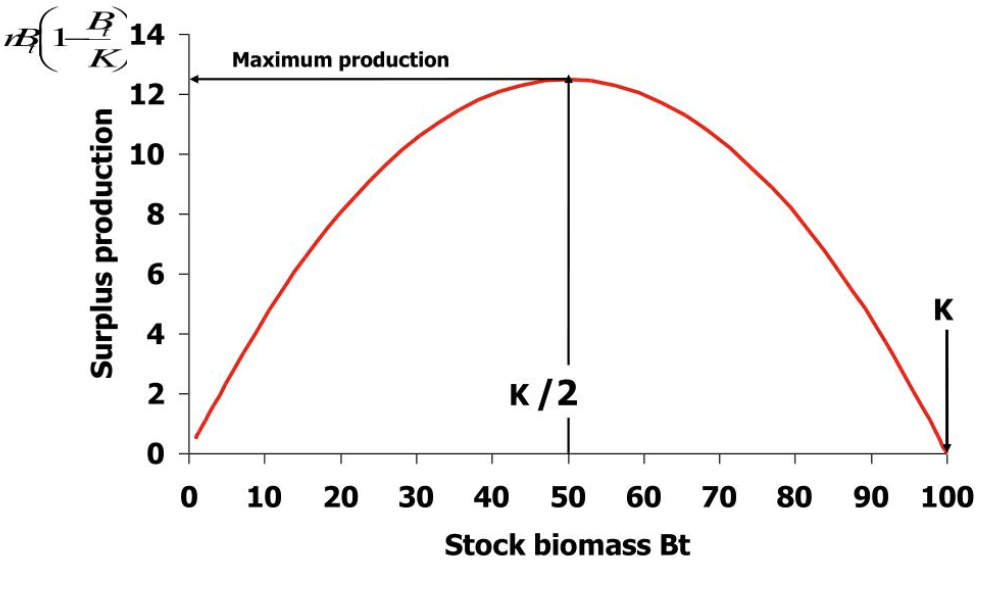
Surplus production model
Model estimating population growth and sustainable yield

Maximum sustainable yield (MSY)
Largest catch that can be taken without depleting the stock. MSY = (rK)/4 where r = growth rate and K = carrying capacity
Schaefer model
used to describe yield vs fishing pressure. Y = aE - bE², shows yield increases than decreases with effort. peak = MSY point
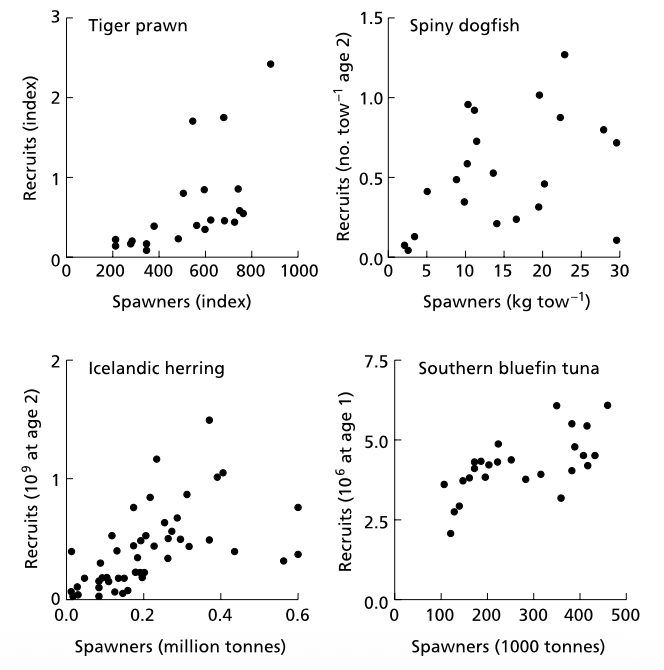
Stock-recruitment relationship
Relationship between spawning stock and new recruits
Virtual population analysis (VPA)
Method to estimate past population sizes using catch data
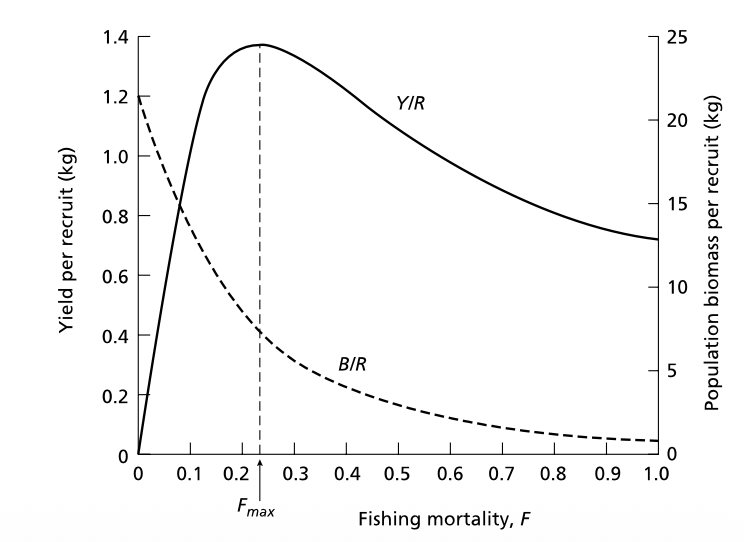
Yield-per-recruit model
Model assessing yield relative to fishing pressure per recruit
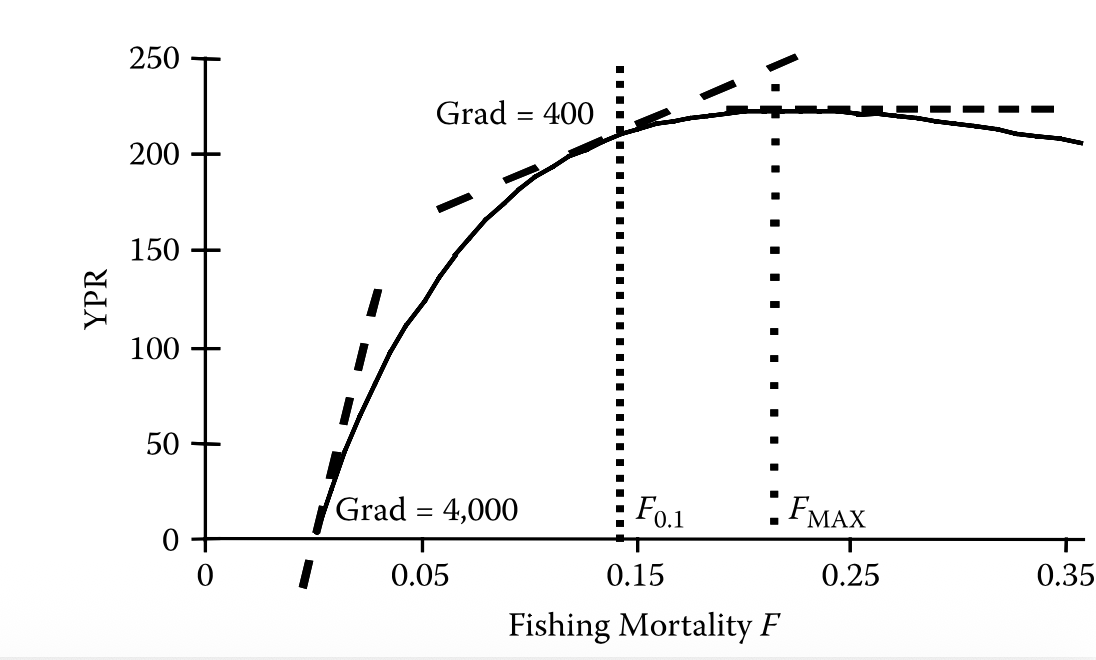
F0.1
Fishing mortality rate where the slope of the yield-per-recruit curve is reduced to 10% of its value at the origin; used as a conservative harvest target because yield increases begin to slow significantly.
Ecosystem-based fisheries management
Approach considering entire ecosystem rather than single species
Bottom trawling
Fishing method that drags nets along the seafloor
Swept area ratio (SAR)
Proportion of seafloor disturbed by trawling
Bycatch
Non-target species caught during fishing
Overfishing
When fishing mortality exceeds sustainable levels
Overfished stock
Stock size below sustainable threshold
Reference points
Benchmarks (e.g., BMSY, FMSY) used for management decisions
Total allowable catch (TAC)
Maximum catch allowed in a fishery
Individual transferable quotas (ITQ)
Catch shares that can be traded among fishers
Effort quota
Limits on fishing effort rather than catch
Co-management
Shared management between authorities and stakeholders
Management strategy evaluation (MSE)
Simulation approach to test management strategies under uncertainty
Observation error
Inaccuracy in collected data
Process error
Variability in natural population processes
Implementation uncertainty
Differences between planned and actual management outcomes
Magnuson-Stevens Act
U.S. law governing marine fisheries management
Annual catch limit (ACL)
Science-based limit preventing overfishing
Accountability measures (AM)
Mechanisms to enforce catch limits
Fishery management plan (FMP)
Document outlining regulations and strategies for a fishery
Essential fish habitat
Critical areas necessary for fish survival and reproduction
Bycatch minimization
Requirement to reduce unintended catch and mortality
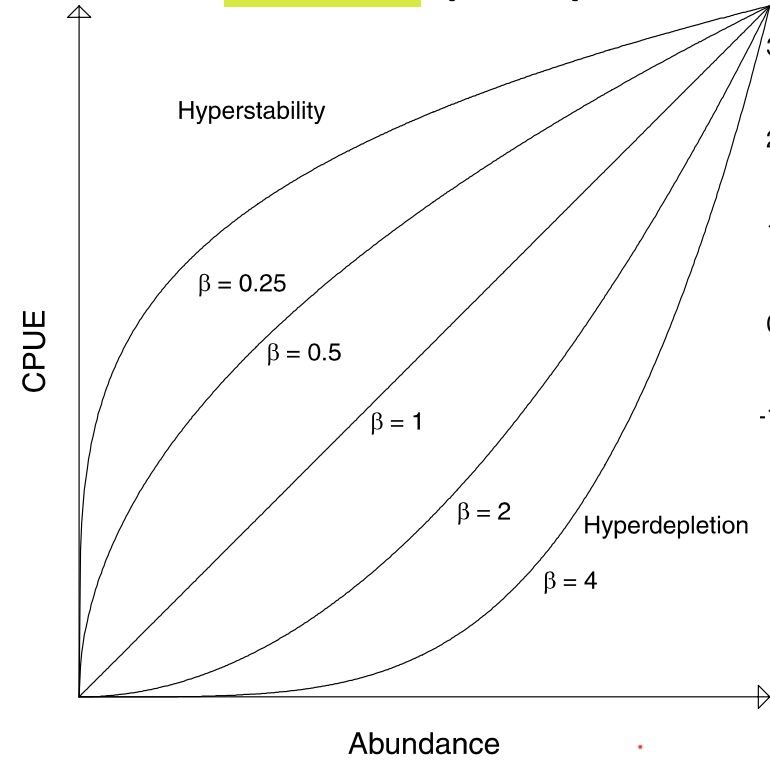
CPUE hyperstability
When CPUE remains high despite declining abundance due to fish aggregation or behavior

CPUE hyperdepletion
When CPUE declines faster than actual abundance due to fish dispersion or behavior

Beverton-Holt model
Stock–recruitment model where recruitment increases with spawning stock and then levels off at high stock sizes (density dependence but no crash). R = (aS)/(1+bS). r = recruitment, S = spawning stock, a = productivity at low stock, b = density dependence strength
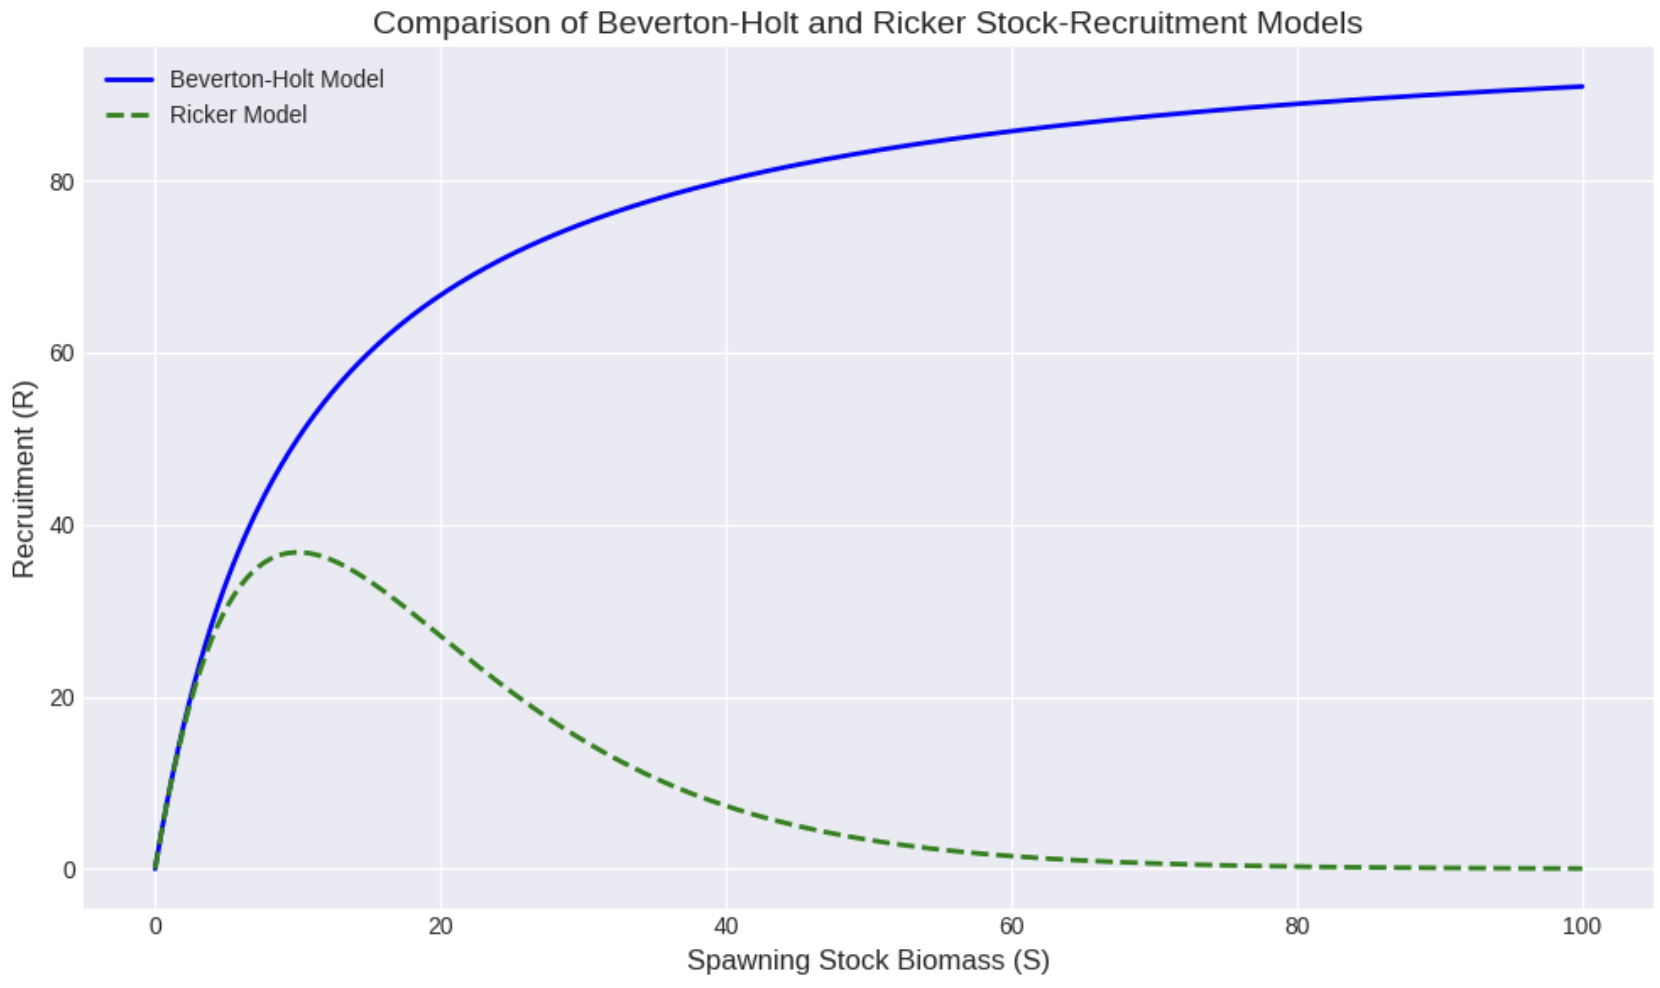
Ricker model
Stock–recruitment model where recruitment increases at low stock but decreases at high stock due to overcrowding or competition. R = aSe^-bS. Low S = more spawners = more recruits, High S = too many fish → competition → fewer recruits
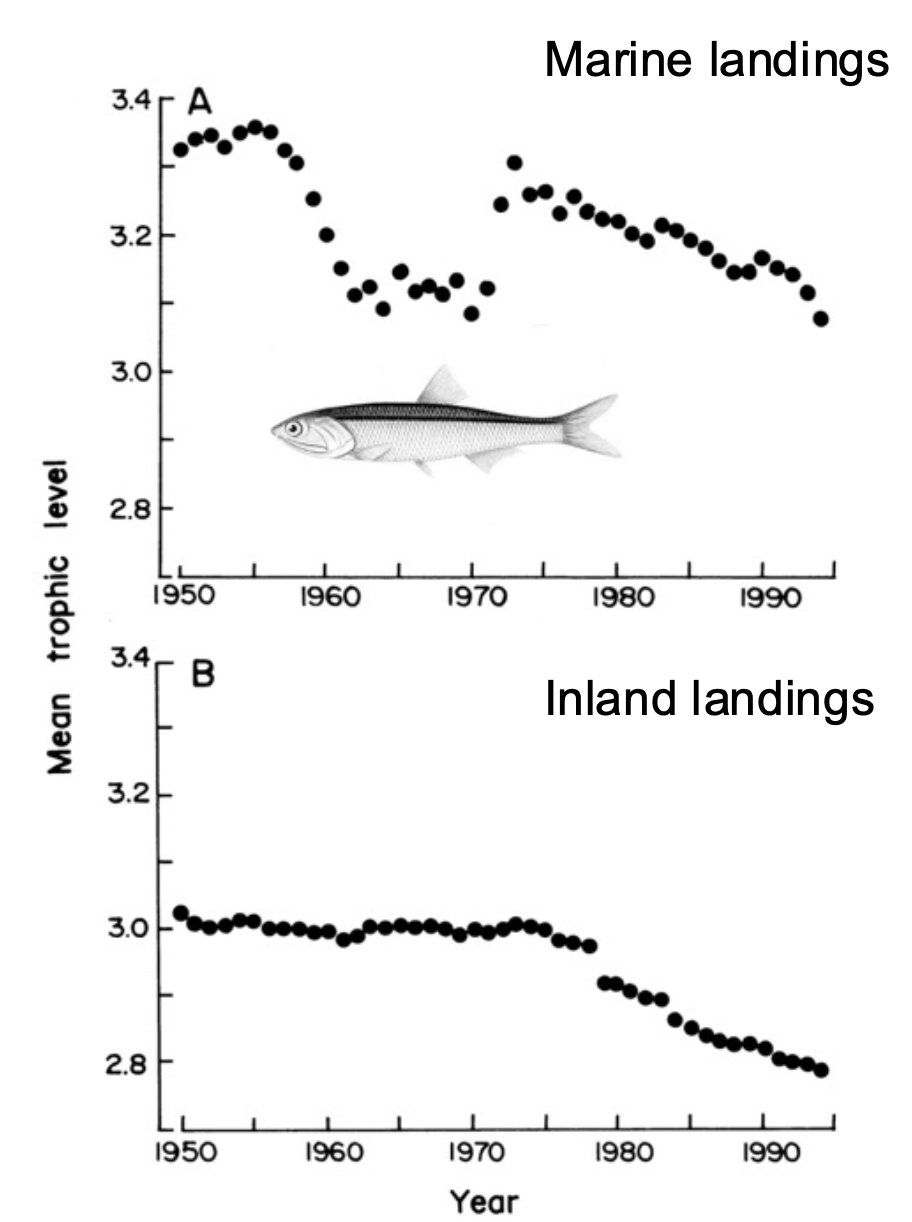
Fishing down food web trend
Graph showing decline in mean trophic level of catches over time
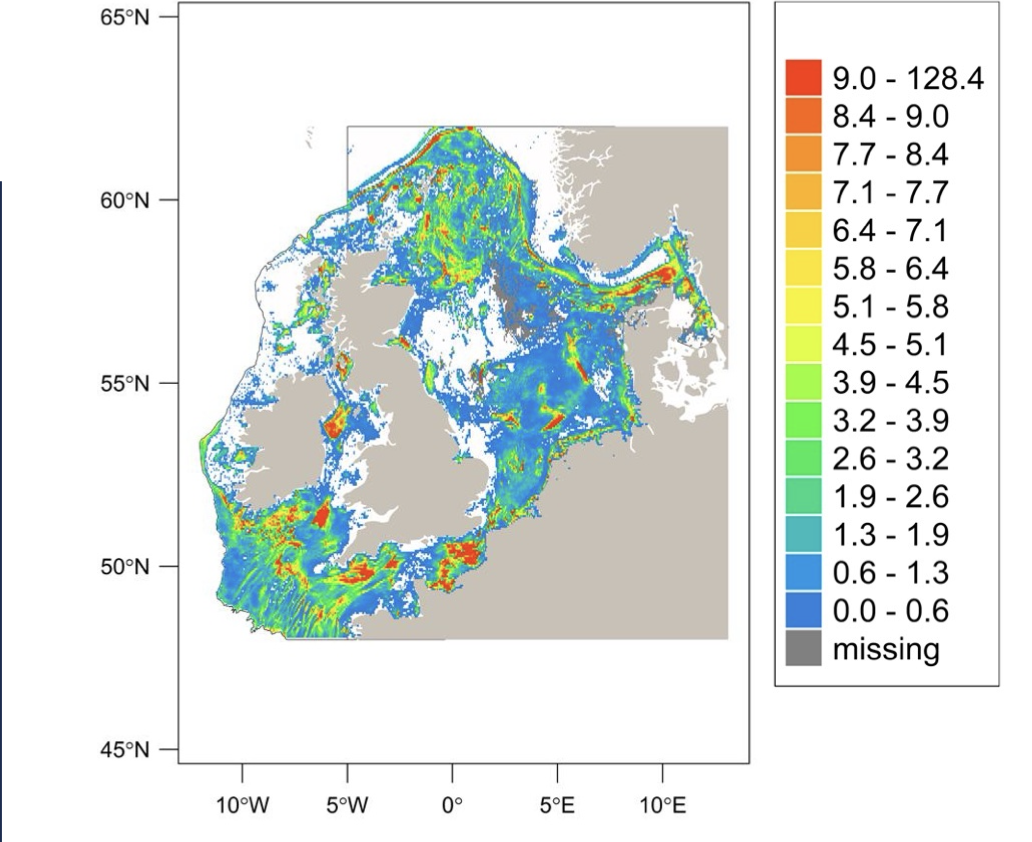
Swept area ratio map
Spatial representation of fishing intensity and seabed disturbance
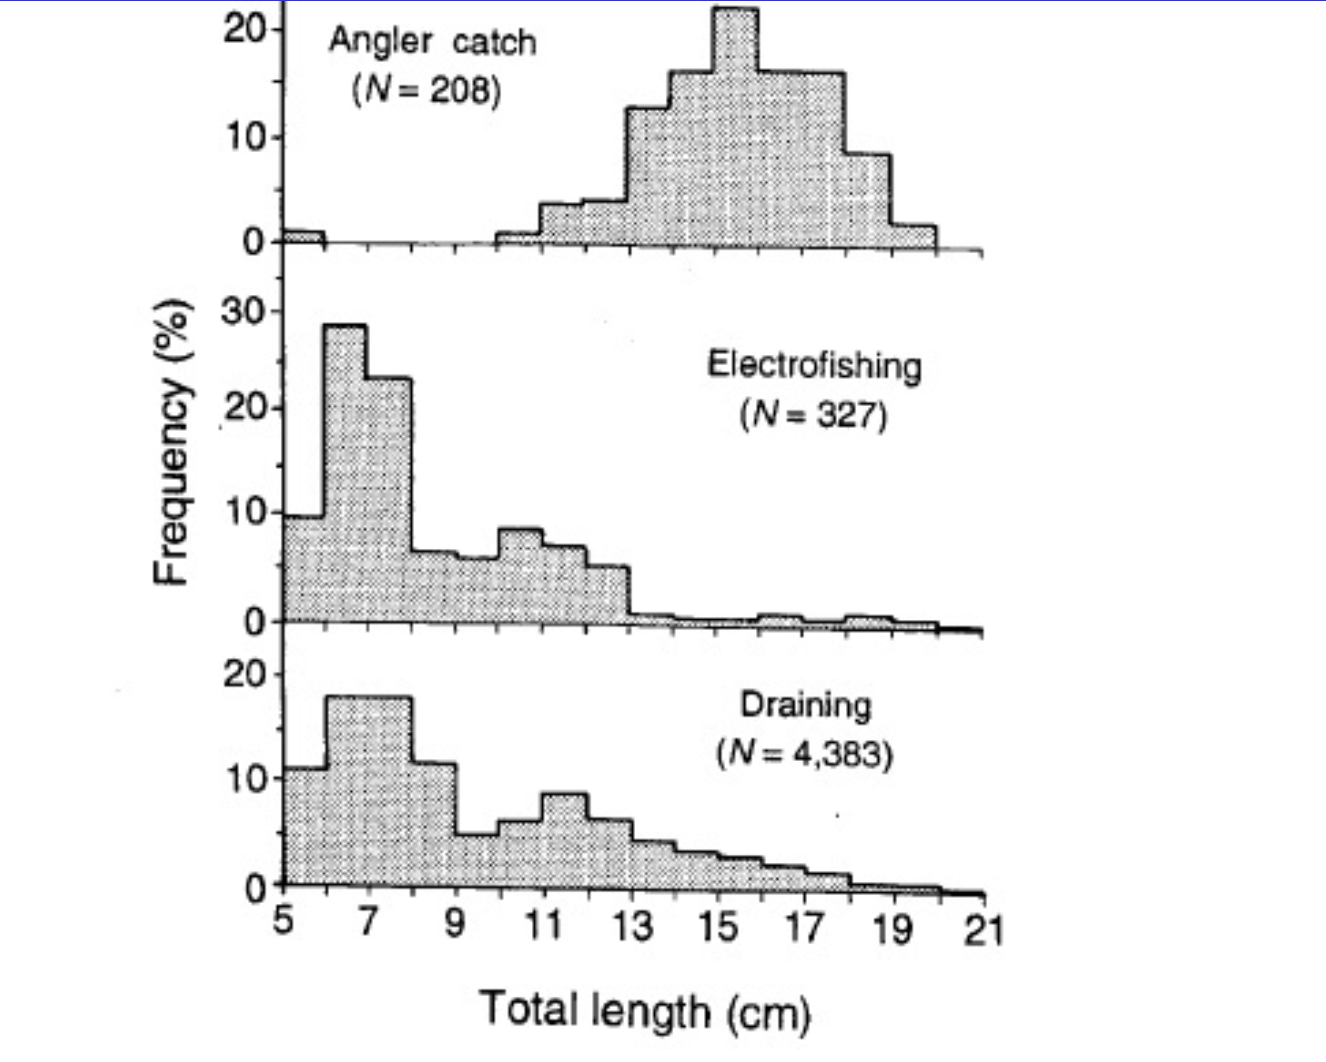
Length-frequency distribution
Graph showing size structure of a fish population used for stock assessment; used to infer age classes, recruitment, and fishing pressure