Lecture 12 PDO: From fish to climate and beyond
1/14
There's no tags or description
Looks like no tags are added yet.
Name | Mastery | Learn | Test | Matching | Spaced | Call with Kai |
|---|
No analytics yet
Send a link to your students to track their progress
15 Terms
How was Pacific Decadal Oscillation discovered?
By fisheries scientist Steven Hare and colleagues in 1996
Noticed connections between Alaskan salmon production cycle/fisheries and the Pacific climate, with a cyclical link
What is Pacific Decadal Oscillation (PDO)?
Recurring climate event centred in the Pacific, over period of 20 to 30 years
Horse shape around the Pacific and the equatorial region
Positive = warm phase
Negative = cold phase
Phase identified by longer-term average of PDO Index
Teleconection
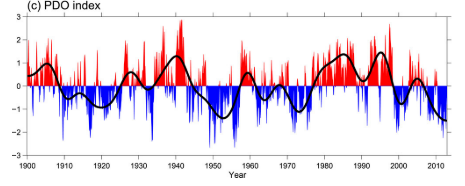
PDO Index
Calculated based on SST in the Pacific Ocean, shows PDO condition
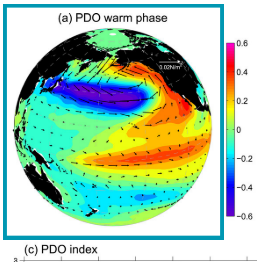
What happens when PDO is in a “positive” or “warm” phase?
Higher than normal SST extends from North America towards, and across, equator
More rapid global warming
Horseshoe warm front, warmer off Western USA
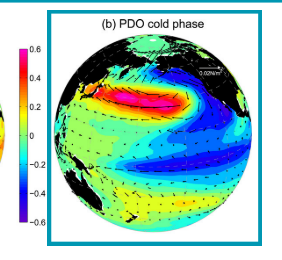
What happens when PDO is in a “negative” or “cold” phase?
Lower than normal SST extends from North America towards, and across, equator
Slow down in Global Warming
Due to more upwelling/mixing of water in the Pacific region
Cooler, so absorbs more heat from the atmosphere
Horseshoe becomes a colder area, colder off the Western USA
How does PDO change with climate change?
PDO seems to be switching phase at a higher frequency in recent years
Climate change models predict a reduced PDO amplitude, due to weakened temperature gradients and wind-stress related gyre movements (Zhang and Delworth, 2016)
The predictability of the PDO also likely to be reduced e.g harder to predict weather events (already hard to predict)
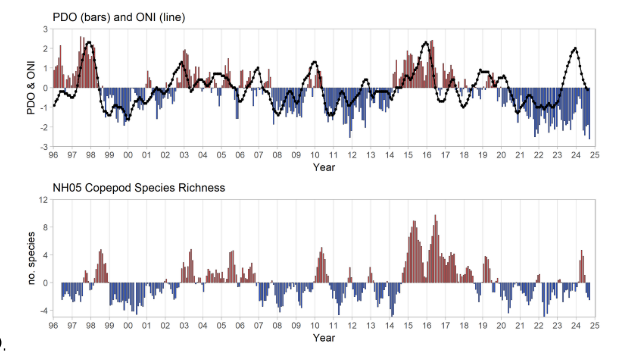
PDO effects on biology
Copepods have a short lifespan, and their species composition responds quickly to changes in PDO
Copepod richness off of Washington and Oregon mirrors the changing of PDO
2016 = warm phase, followed by an increase in copepod species richness
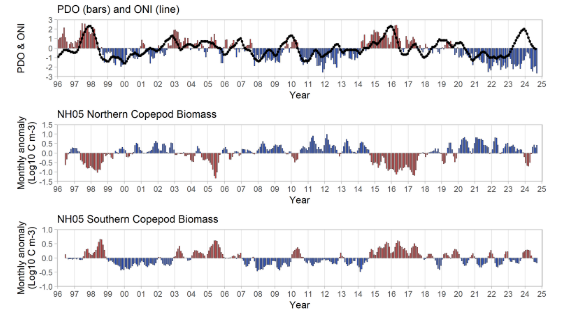
How does PDO interact with the seasons?
Change the type of species that thrive in an area e.g. If cold phase PDO during the summer, cold-water copepod species dominate off the coast of Washington/Oregon, and vice versa
The southern copepod species that dominate in warmer water are smaller and have less lipid reserves
Lower fat content passed to higher trophic levels - Knock on impacts for the food web e.g. small pelagic fish have a lower fat content after feeding
Copopods = short-lived species, so react quickly with PDO, harder to predict effects on longer-lived species
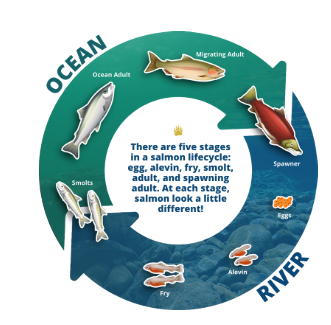
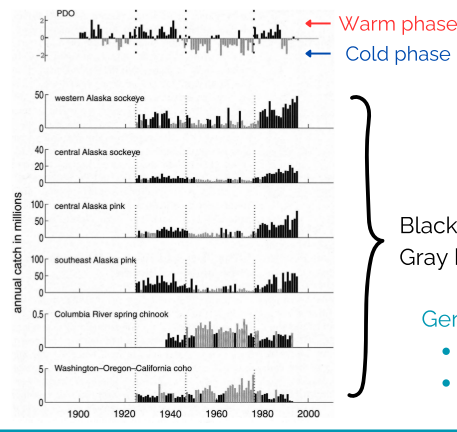
PDO effects on Salmon
Salmon abundance and composition changes
Higher than average catch of Alaska salmon during warm phases, lower during colder/negative phases
Not as common in Salmon species in the specific North West, further south = difference in how PDO affects the area - hard to predict for fisheries management
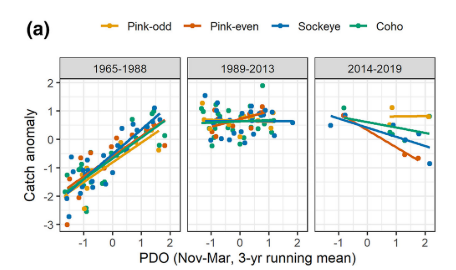
What is Climate change causing more of?
‘Novel’ climates, making predictions harder
E.g. the relationship between Salmon catch and PDO phase is hard to identify (pic) - Makes fisheries management more challenging
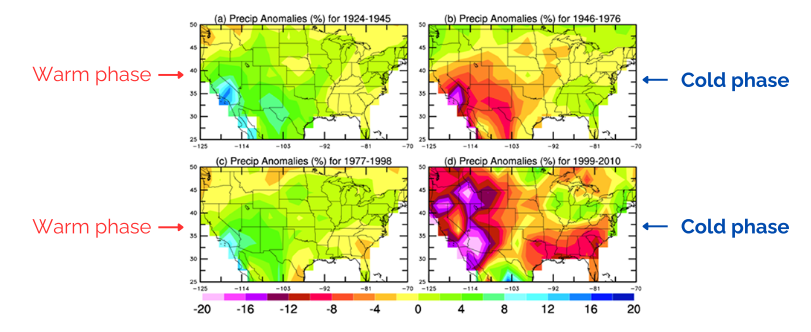
PDO Effects on precipitation in N. America
Caused by changes in pressure
Warm phase: higher/more precipitation
Cold phase: drier than normal = less
Causes changes in vegetation
What happends to ENSO during PDO?
Both have similar profiles, ENSO helps to drive PDO, overlapping effects
Switches many times within each PDO phase
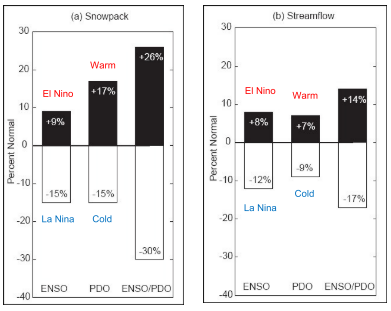
When the two are “in-phase”...
El Niño + PDO warm phase, overlap = effects amplified
La Niña + PDO cold phase, overlap = effects amplified
Total effects on temperature and precipitation will be stronger
What do climate indices tell us?
Many e.g. ENSO, NAO, PDO (positive/negative)
Don’t tell us causes or effects of climate patterns or weather phenomena
Describe large-scale (in time and space) phenomena
Should not be used to make local or short-term predictions
Don’t give an idea on the effect of longer-living species
Common problems of using climate indices to understand weather
Spatial variation: indices “average out” finer scale spatial variations
Seasonality: indices “average out” finer scale temporal variations
Non-stationarity: Climate and weather are not a fixed relationship
Nonlinearity: Weather response is not always proportional to changes in climate indices
Lack of correlation: Local climate/weather can be influenced by multiple indices
Common advantages of using climate indices to understand ecology
Spatial variation: Help understand large geographic patterns
Modelling: Reduce local climate/ weather variables to a more manageable scale
Predictability: Recurring phenomena over a long stretch of time
Biological effects: Many biological processes respond to changes in climate indices
Availability: Long-term data sets are easily accessible
Can be pulled apart to identify anthropogenic causes of climate change