RP 9 - physical
 Call Kai
 Learn
Learn Practice Test
 Spaced Repetition
 Match
Match Flashcards
 Knowt Play
1/12

There's no tags or description
Looks like no tags are added yet.
Name | Mastery | Learn | Test | Matching | Spaced | Call with Kai |
|---|
No analytics yet
Send a link to your students to track their progress
13 Terms
what is RP 9
investigate how pH changes when a weak acid reacts with a strong base and when a strong acid reacts with weak base
pH probe calibration
rinse pH probe with distilled water and shake to remove XS water
place probe in standard pH 7.00 buffer solution and record reading
rinse with distilled water
repeat using standard pH 4.00 and 9.20 buffer solutions and record readings
plot graph of pH buffer solution (y) against recorded pH reading (x)
why do you need to calibrate the pH probe
over time (in storage) the pH meter readings become innaccurate
what does the bulb of probe need to be
fully immersed
what does the calibration curve allow
can be used to convert pH readings into more accurate pH values
measuring pH method
rinse and fill burette with acid and transfer some to a beaker
rinse and fill another burette with alkali
rinse pH probe with distilled water and clamp so bulb is fully immersed
use rod to stir and record pH reading
add 2cm3 portions, stir and record pH each time
when end point being reached add 0.20cm3 portions, stir and record pH each time
after continue adding 2cm3 portions until alkali in XS, stir and record pH each time
burette accuracy
ensure jet space filled without air bubbles
why does the portion value decrease
its near the endpoint where the pH changes rapidly - means you can accurately measure pH change
what is the change of most indicators
over a range of 2 pH units
definitions of = equivalence, half equivalence and end point
equivalence = point when volume of one solution has reacted exactly with the volume of another (according to stoichiometric ratios)
half equivalence = point where exactly half of a weak acid has been neutralised so that its conc is same as its conjugate base, [HA] = [A-]
end point = point where the indicator changes colour
analysing data
use pH probe calibration graph to adjust pH readings obtained - correct values should be added into new table column
plot graph corrected pH values (y) against vol alkali added (x)
join points in most appropriate way which should be a curve
diagram
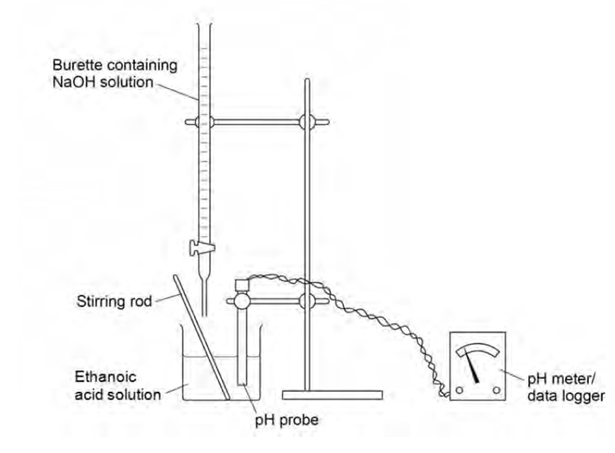
what does the periodic measurement of the pH of the reaction solution allow
the plotting of a graph of pH against volume of solution added - a pH titration curve