Movement and Position (1b)
1/18
Earn XP
Name | Mastery | Learn | Test | Matching | Spaced | Call with Kai | Chat |
|---|
No analytics yet
Send a link to your students to track their progress
19 Terms
Average Speed
v equals s/t

Distance-time Graphs
shows how the distance of an object moving in a straight line from a starting position varies with time
also shows:
constant speed or not
how large or small the speed is
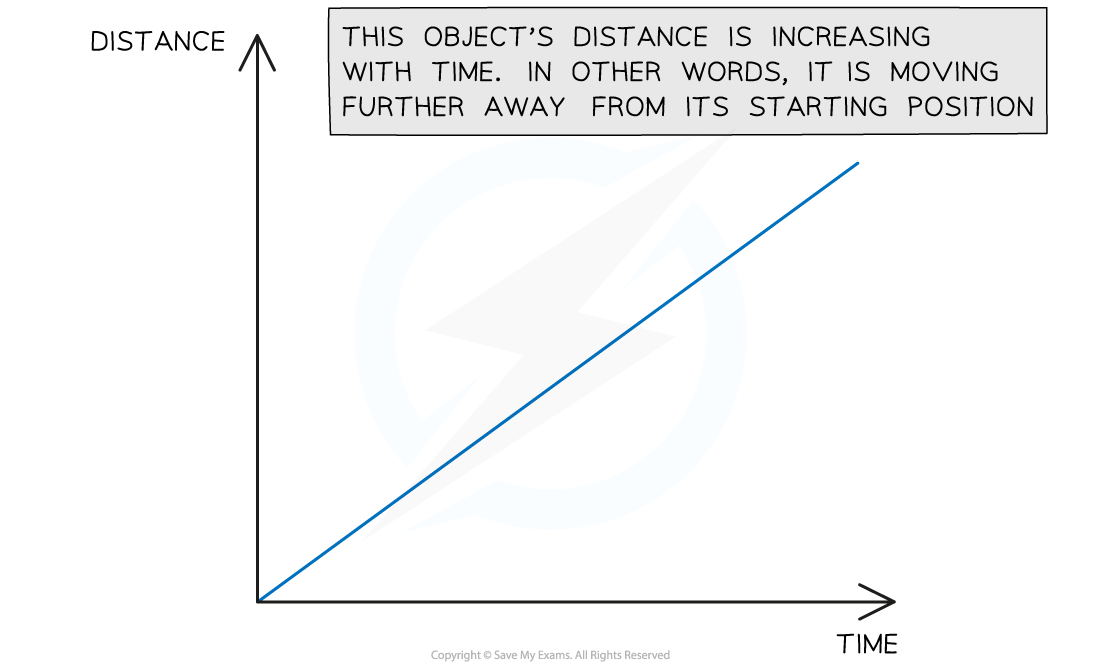
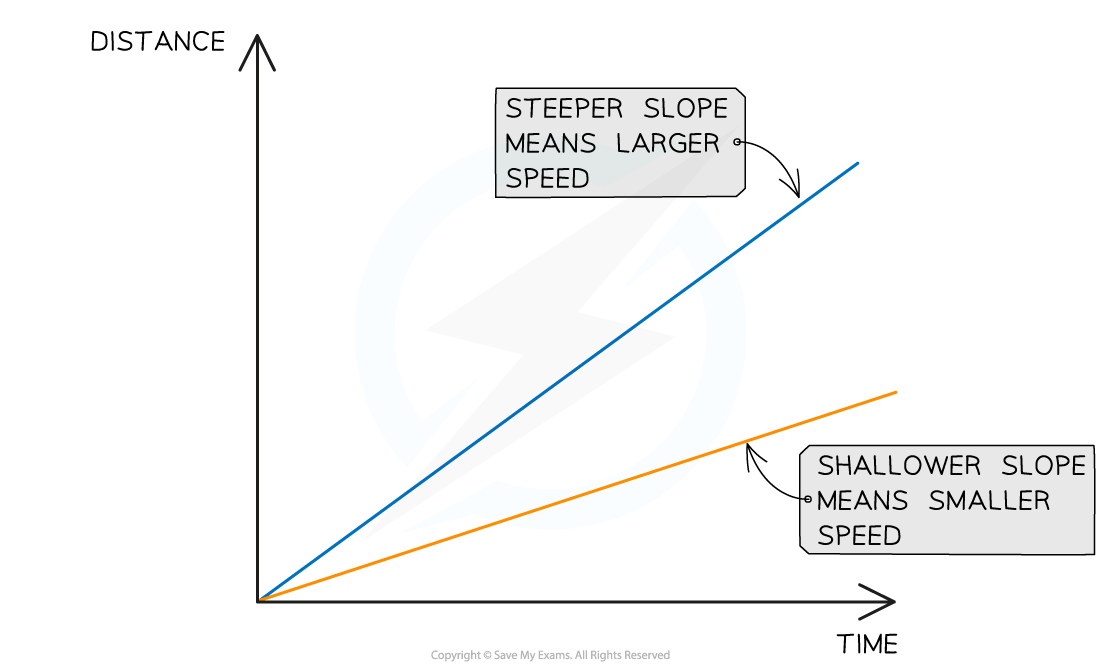
Constant speed on a DT Graph
straight line
slope represents magnitude of speed
steep slope = very large speed
shallow slope = small speed
flat, horizontal line = stationary
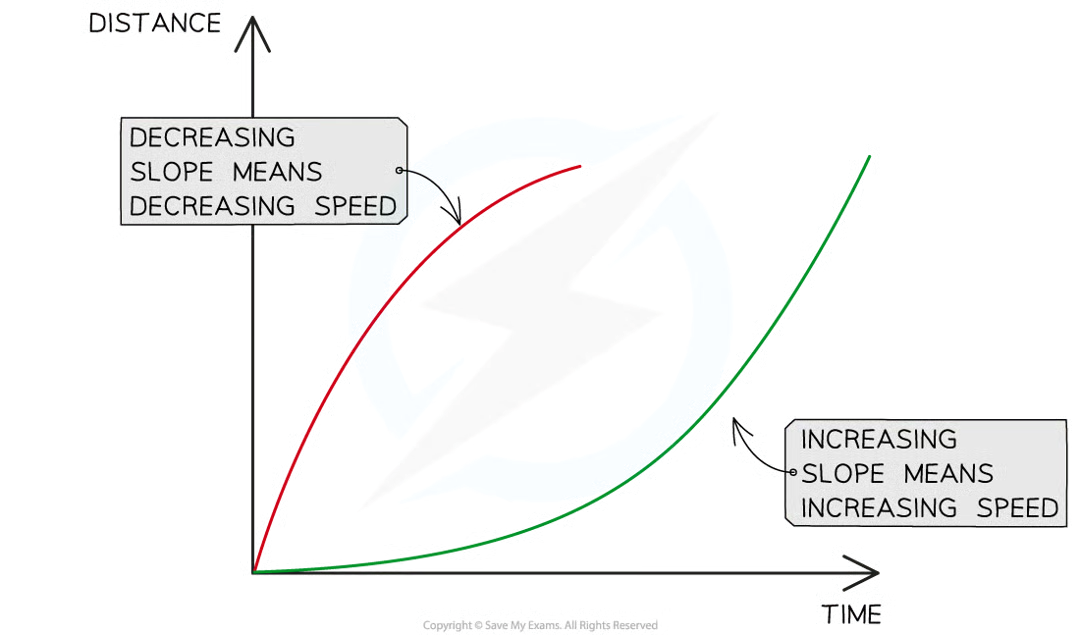
Changing Speed on a DT Graph
changing speed represented by curve
slope increasing = speed increasing
slope decreasing = speed decreasing
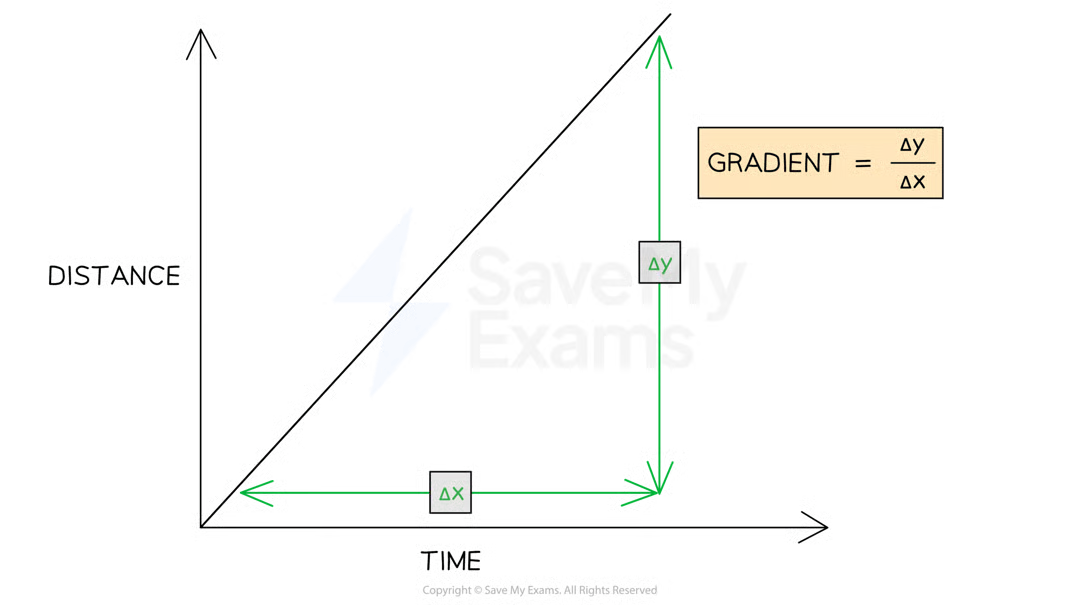
Calculating Speed from a DT Graph
speed = gradient = Δy (change in d) /Δx (change in t)
Practical (Investigating Motion): Aim
investigate motion of everyday objects by measuring speed
ex: paper cone, tennis ball
measuring speed directly is difficult
average speed can be calculated by measuring distance moved and time taken
other methods: light gates to measure speed and acceleration
Practical (Investigating Motion): Variables
independent: d
dependent: t
control: same object for each measurement
Practical (Investigating Motion): Equipment and Purpose
paper cone/ tennis ball: to measure speed of
stopwatch: to measure time taken → resolution 1mm
tape measure/ metre ruler: to measure distance moved → resolution 0.01s
Practical (Investigating Motion): Method
measure height of 1m with tape measure/ metre ruler
drop object from this height (distance travelled by object)
use stopwatch to measure time taken
record distance travelled and time taken
repeat 2-3 times and calculate average time taken to fall a certain distance
repeat for heights of 1.2, 1.4, 1.6 and 1.8m
Practical (Investigating Motion): Result Analysis
use v=d/t to calculate average speed
speed in m/s
d in m
t in s
Practical (Investigating Motion): Evaluating Experiment
Systematic Errors
measure at eye level → avoid parallax error
average reaction time: 0.25s
significant when small intervals of time are measured
to reduce: use larger distances to have larger time intervals
use a ball bearing and an electronic data logger to remove human reaction time error
use electronic sensors like light gates to obtain very accurate measurements
timer starts and stops automatically as it passes sensors positioned at start and stop points
Random Errors
ensure no draft or breeze because it could affect the falling object’s motion
Practical (Investigating Motion): Safety Considerations
place mat or soft material below falling object to cushion its fall
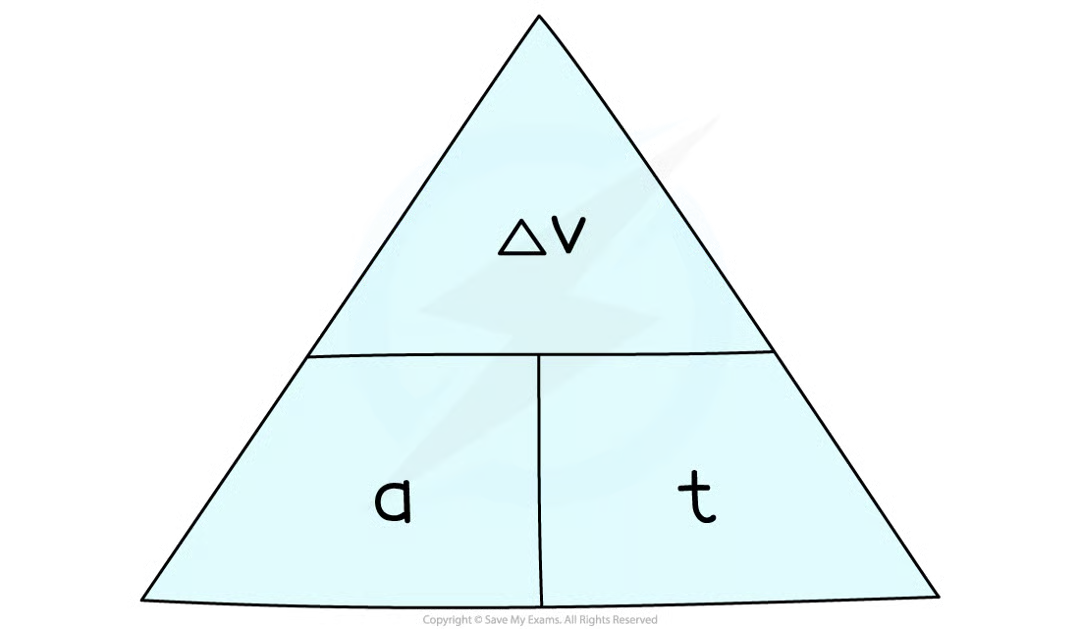
Acceleration
rate of change in velocity
a = Δv/ t
a in m/s2
v in m/s
t in s
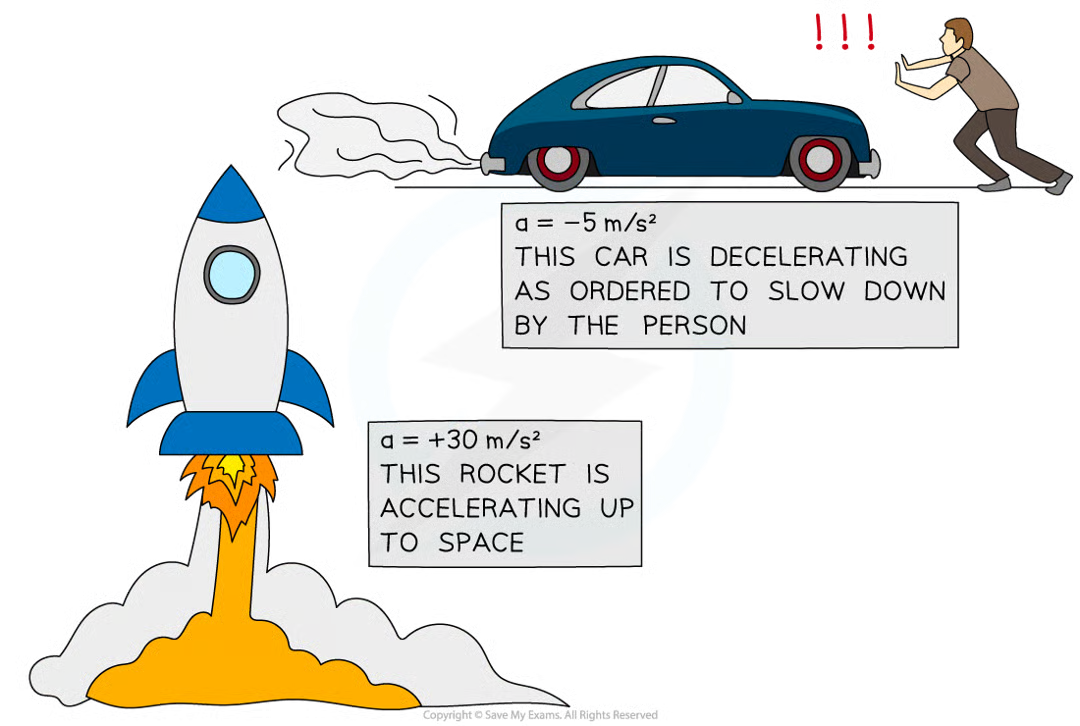
Acceleration vs Deceleration
acceleration can be positive or negative
speeding up: accelerating positively
slowing down: decelerating (accelerating negatively)
Velocity-Time Graph
shows how velocity of a moving object varies with time
also shows:
constant acceleration or not
magnitude of acceleration
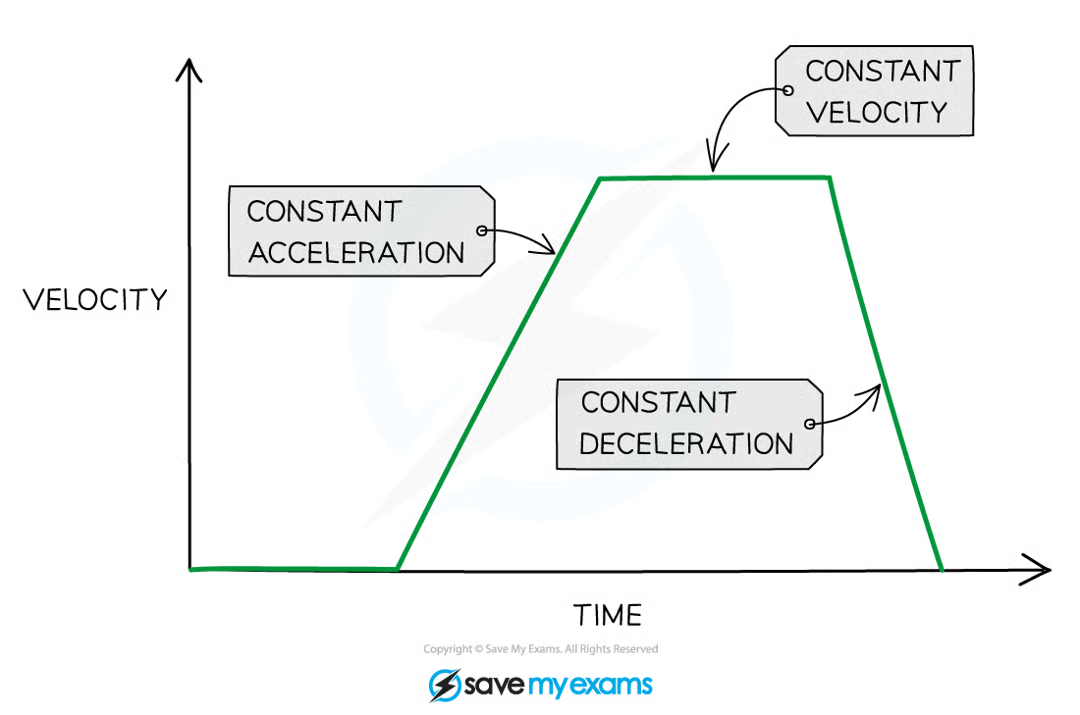
Acceleration on a VT Graph
straight line = constant
slope = magnitude
steep = large
gentle = small
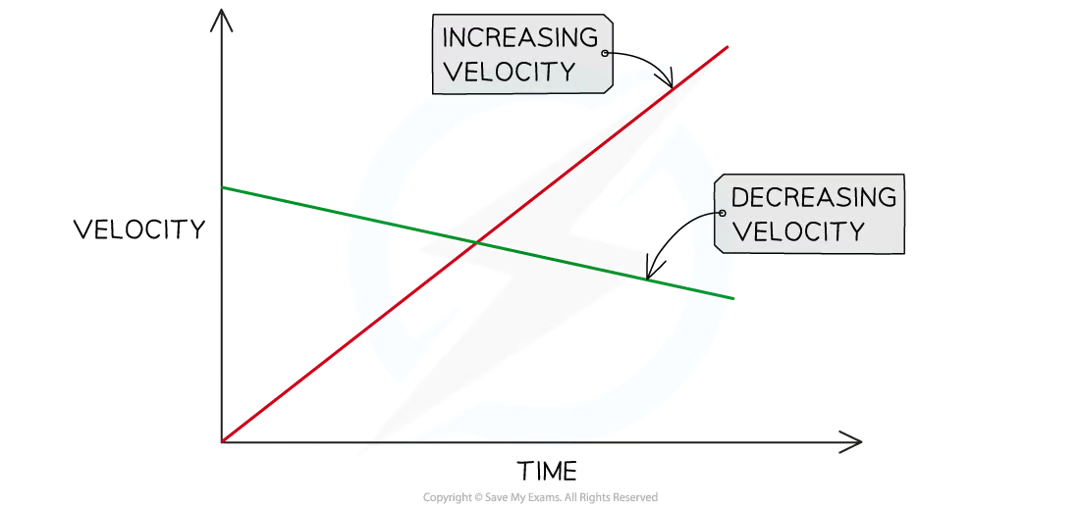
positive gradient = increasing velocity
negative gradient = decreasing velocity
flat line = 0 acceleration (constant velocity)
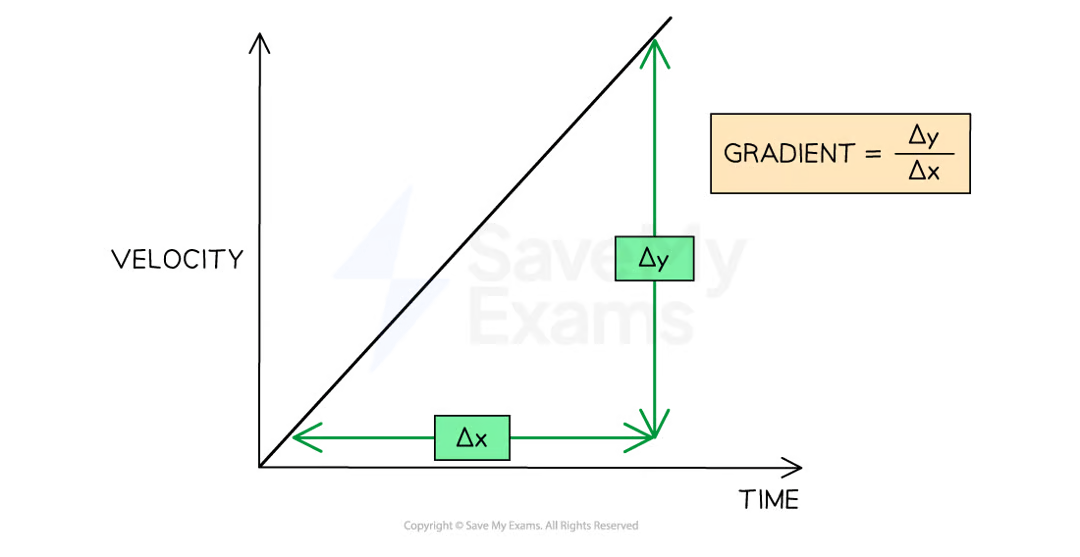
Calculating Acceleration on a VT Graph
a = gradient = Δy (change in v) / Δx (change in t)
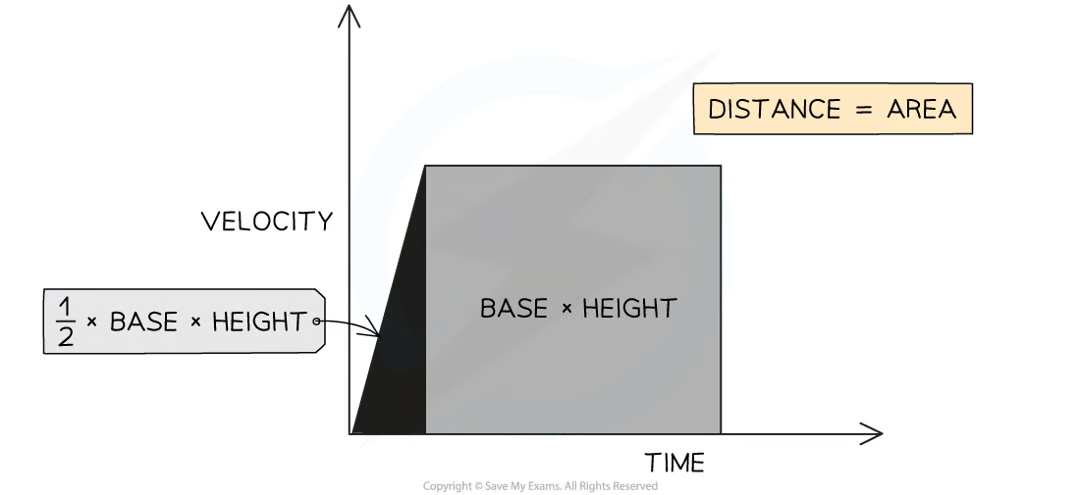
Area under VT Graph
area = distance travelled
Calculating Uniform Acceleration
uniform acceleration = constant acceleration
v2 = u2 + 2as
s = d in m
u = initial v in m/s
v = final v in m/s
a = acceleration in m/s2