IAL U3 full REV
1/68
There's no tags or description
Looks like no tags are added yet.
Name | Mastery | Learn | Test | Matching | Spaced | Call with Kai |
|---|
No analytics yet
Send a link to your students to track their progress
69 Terms
Describe the difference between semi-quantative and quantitative test
(2marks)
- semi-quantitative test:
A semi-quantitative test gives an estimate (of the concentration of a substance)
- quantitative test: gives the exact value (of concentration)
( gives an exact quantity, done by using colorimeter and plotting calibration curve)
How to make a reliable semi-quantitive estimate? (1mark)
- a valid comparison is needed (to make a reliable semi-quantitative estimate)
State what is meant by the term reducing sugar
Give 5 examples
- reducing sugar is a sugar that can donate electrons to another molecule/chemical
- glucose, fructose, galactose, lactose & maltose
( sucrose is the disaccharide that is non-reducing sugar)
Explain what the value for standard deviation means (/definition of S.D)
(1mark)
- a measure of the spread of data around the mean
Describe a method to allow a quantitative comparison of the vitamin C content of two/three fruits.
(5 marks)
[CP2]
- Use equal masses of the fruits & same known volume of DCPIP solution
- Use the same extraction method (e.g. same volume of distilled water, same time, same filtering)
- Add fruit extract until DCPIP changes from blue to colourless
[titration]
- record volume of extract needed to decolorise DCPIP and
- repeat titration again with other fruits
(vitamin C content is found using formula : V1C1 = V2C2)
- repeat experiment and calculate an average and compare V-C content
State the reagent and color change when testing for protein content in food sample
(2 marks)
- biuret reagent
- blue to purple
![<p>[CP7 microscopy/observe and draw plant structures]</p>](https://assets.knowt.com/user-attachments/68fd8a5e-d00a-41a8-bd0b-1657f20f865c.png)
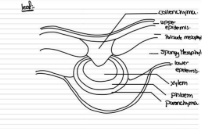
[CP7 microscopy/observe and draw plant structures]
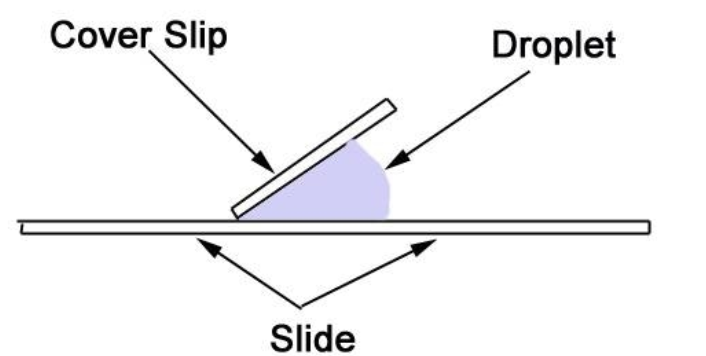
- cut thin section of a stem using sharp knife/scalpel
- add stain/ dye to it
- place the thin section on slide and under a coverslip
- draw the structure under low power plan

Describe a procedure for the accurate determination of the diameter of a cell
(5marks)
[CP5]
- use light microscope under low power & then view under high power
- calibrate eyepiece graticule
- count number of E.P.G units over the cell
- convert E.P.G to microns (μm)
- measure diameter of cell from different positions
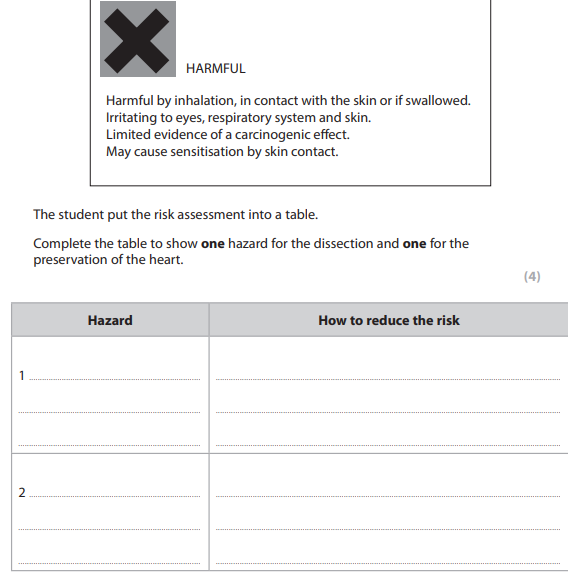
Describe a SAFE method to prepare and examine the structure of human cheek cells
(5marks)
[CP5]
- wear gloves for safety
- use sterile cotton bud to collect the cheek cells (from inside your cheek/mouth)
- rub the cotton bud on glass slide and place cells under coverslip
- add stain such as methylene blue to the cheek cell
- observe the slide under microscope using low power first and then high power
![<p><span>Describe how you would prepare cells in order to observe mitosis</span><br><br><span>(4 marks)</span><br><br><span>[CP 6 ]</span></p>](https://assets.knowt.com/user-attachments/3c19cc3a-af7b-40d9-92fa-4128d278d46a.png)
Describe how you would prepare cells in order to observe mitosis
(4 marks)
[CP 6 ]
-take sample of root tip and add HCL acid (to breakdown middle lamella/celloluse)
- add stain such as toluidine blue/methy blue and warm to make stain more visible
- Use a mounted needle to break open the root tip
- squash root tip
(squash so that cells are seperated, thus chromosomes are visible and mitosis can be seen)
- place cells under coverslip and view under low and then high power microscope
- count no. of cells dividing(or in mitosis) and divide it with total no. of cells to determine mitotic index

- color of DCPIP solution changes from blue to colorless
- because DCPIP is reduced
(reduction = gains electrons, as Vitamin C is antioxidant containing free radicals)
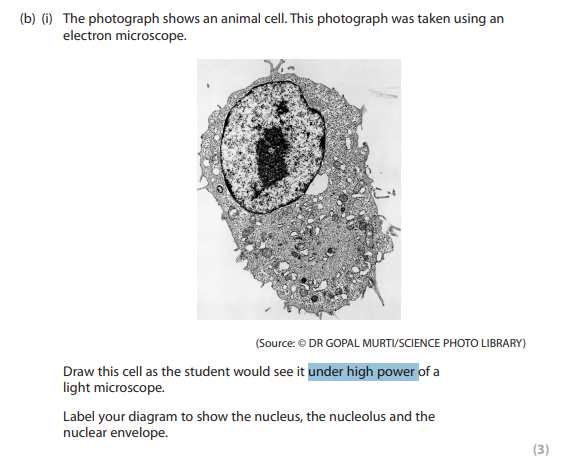
Low power vs high power image
Low power image:
- do not draw individual cells
- only a few cells
High power image:
- include magnification
- cell wall
Devise a procedure to investigate the effect of different concentrations of sucrose on
the rate of growth of pollen tubes, using a sucrose solution.
(5 marks)
[Additional practical: Investigate factors affecting pollen tube growth ]
- use a range of concentrations of sucrose solution
- prepare range by diluting stock solution( i.e the 500 g dm⁻³) with distilled water
- use 100ppm boric acid solution
(Boric acid provides boron, needed for pollen tube growth)
- measure pollen tube length using microscope & eyepiece graticule
- record P.T length at regular time intervals to calculate rate
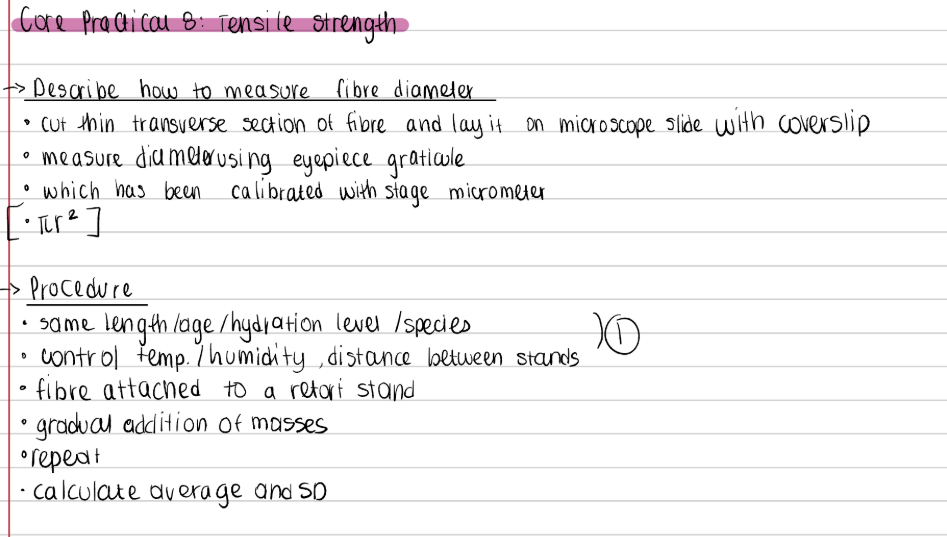
Design a valid investigation to determine the tensile strength of plant fibres
(6marks)
- take fibres of same mass, length and age
- make sure to control environmental factors such as temperature
- make sure procedure is controlled by using same sized masses
- hang mass to the fibre and keep adding mass until fibre breaks
- repeat the procedure to find average mass that breaks fibre, remove any anamolies
- (for safety:) wear goggles to protect eyes
[ Improve accuracy = use smaller mass intervals ]
Name two types of fibre cells found in a plant.
- xylem
- schelerenchyma
(parenchyma, collenchyma, phloem these are not fibre cells
Fiber cells are defined by having thick, lignified secondary walls)
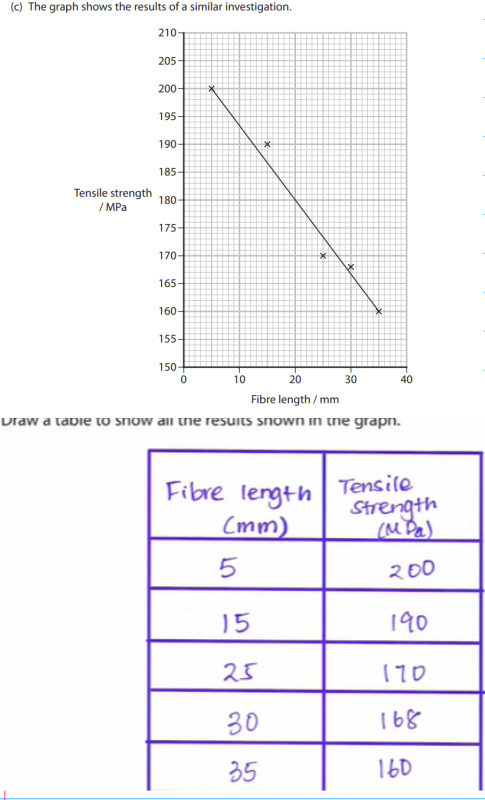
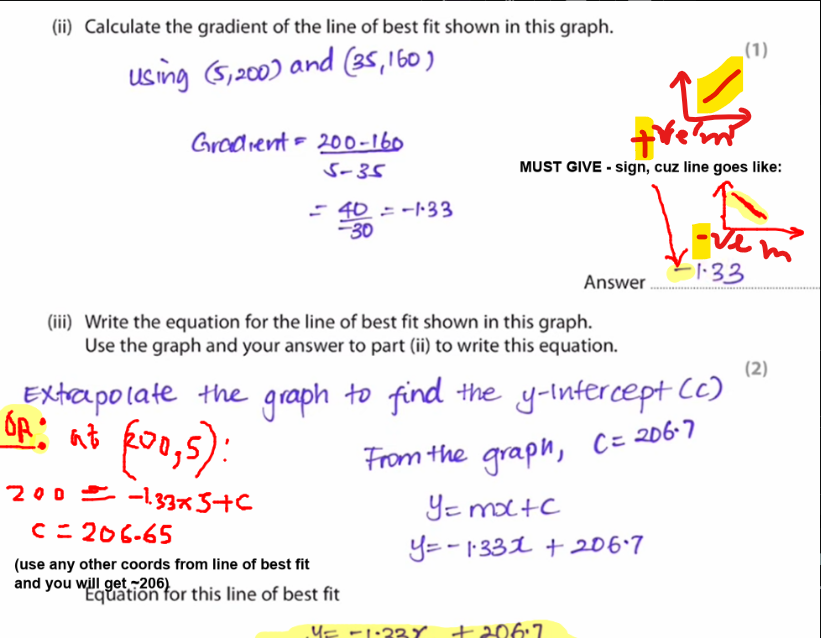
(i) calculate the gradient of the line of best fit shown in this graph
(1mark)
(ii) Write the equation for the line of best fit shown in this graph
Use the graph & your answer from previous part
(2mark)
Describe the role of the pollen tube in plant reproduction.
(2marks)
- releases digestive enzyme to create pathway through stype
- pollen tub contains generative nuclues which divides to form two haploid male nuclei that undergo double fertilastion (to form diploid zygote and triploid endosperm)
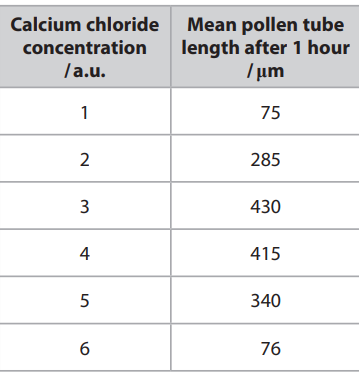
Describe an investigation on the effect of calcium chloride concentration on pollen tube growth, that would give the results shown in the table.
(6 marks)
- use a range of 6 solutions of calcium chloride, from 1 to 6 a.u
- sucrose/ boric acid is used for growth of pollen tube
- control temperature, pH, and make sure same plant species is used
- place pollen grains on agar plate
- leave for 1 hour (time period depends on q. context)
- use microscope and calibrate eyepiece graticule to find pollen tube length
(callibration → convert EPG units to micrometer)
- repeat at each concentration (of CaCl2) to calculate mean
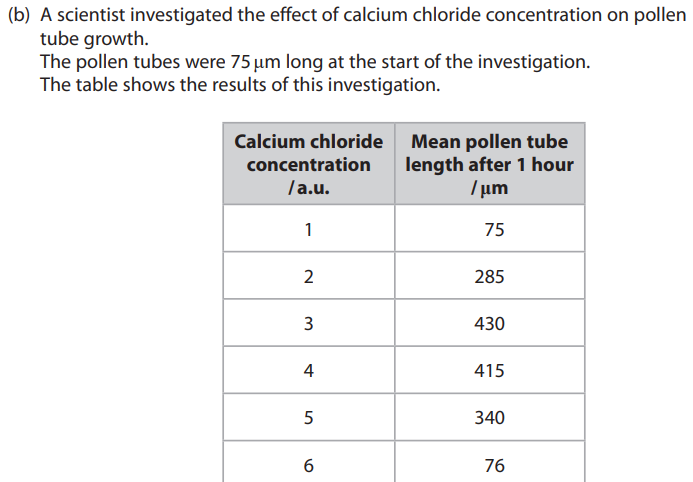
Comment on the results of this investigation. (3 marks)
pollen tubes do not grow at 1 au and very little growth at 6 au, only 1cm (from table)
pollen tube had highest growth at 3 a.u (from table)
graph shows non linear relationship
(since no proportionality or linear property)
[- lack of control of other variables and no mention on 0 a.u ]
NOTE: for commenting on results:
Don’t just mention validity and reliability, ✅ describe trends from table/graph first
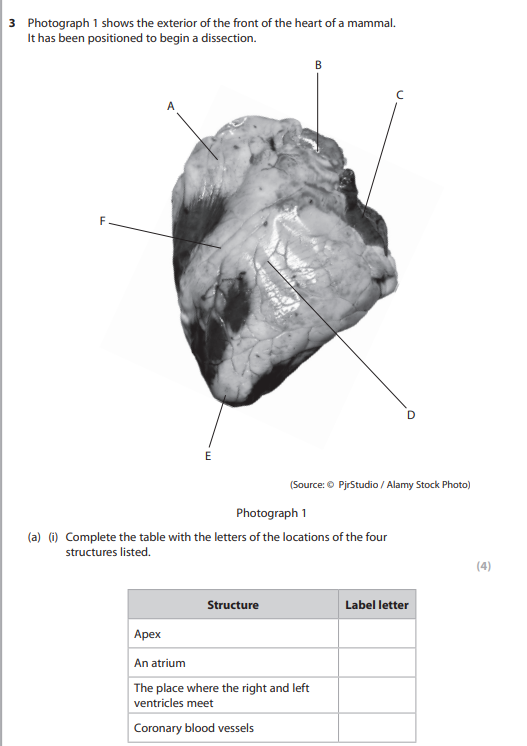
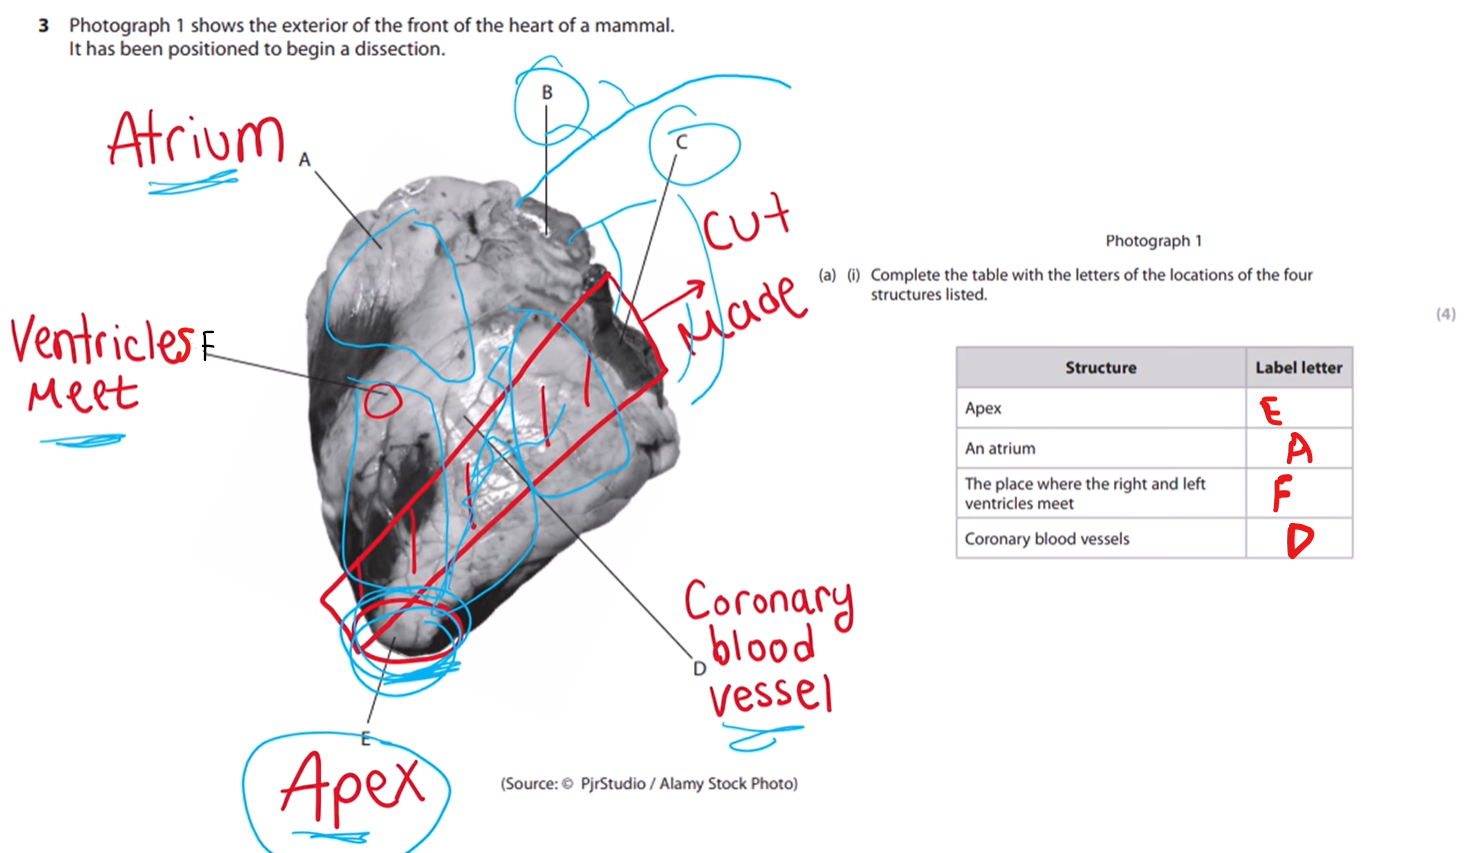
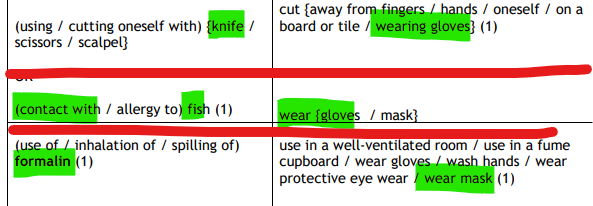
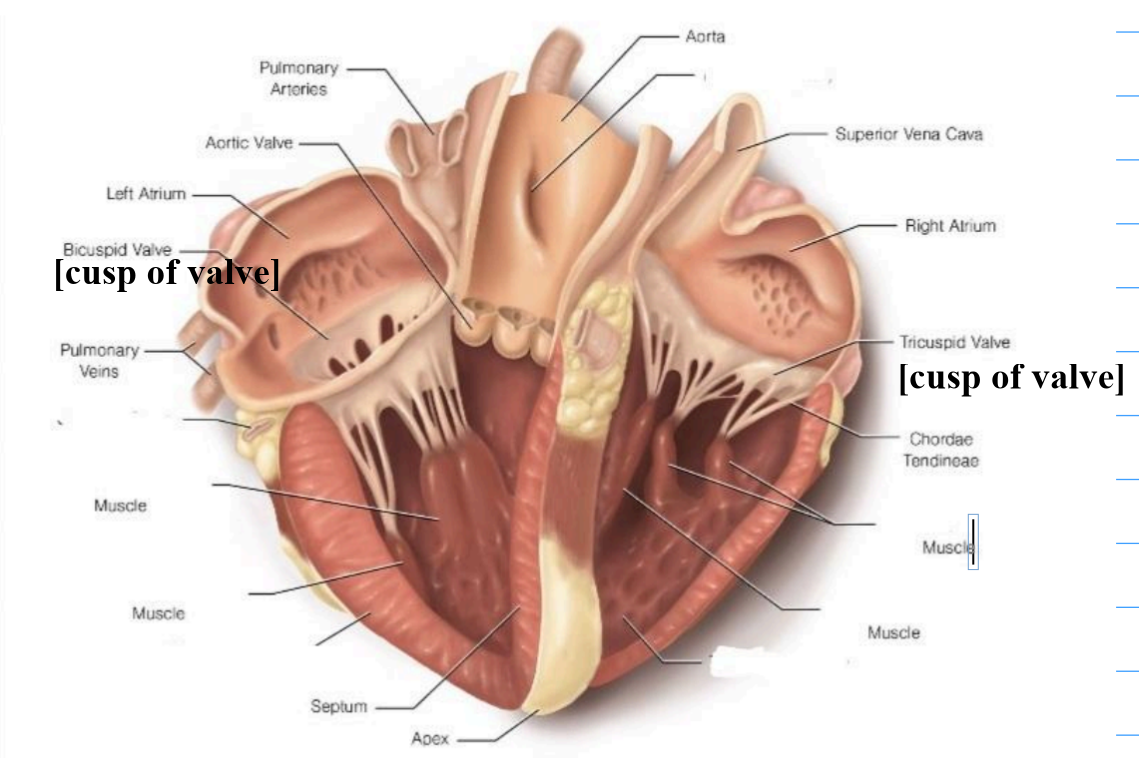
NOTE: the apex of the heart is at the bottom
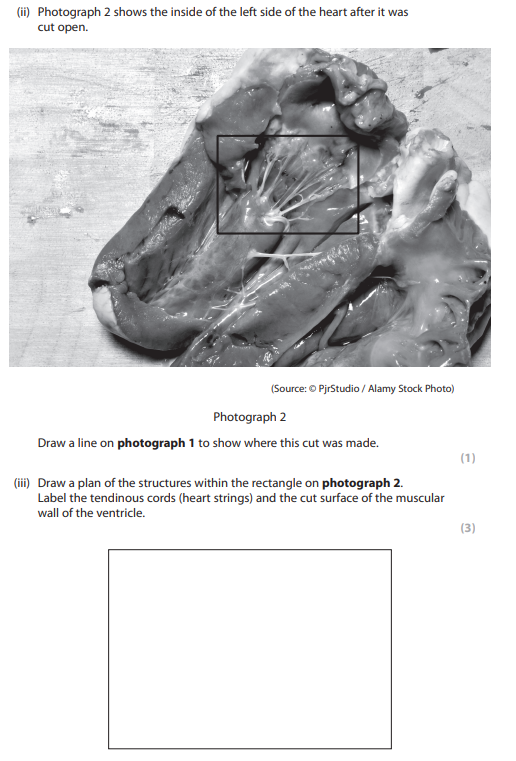
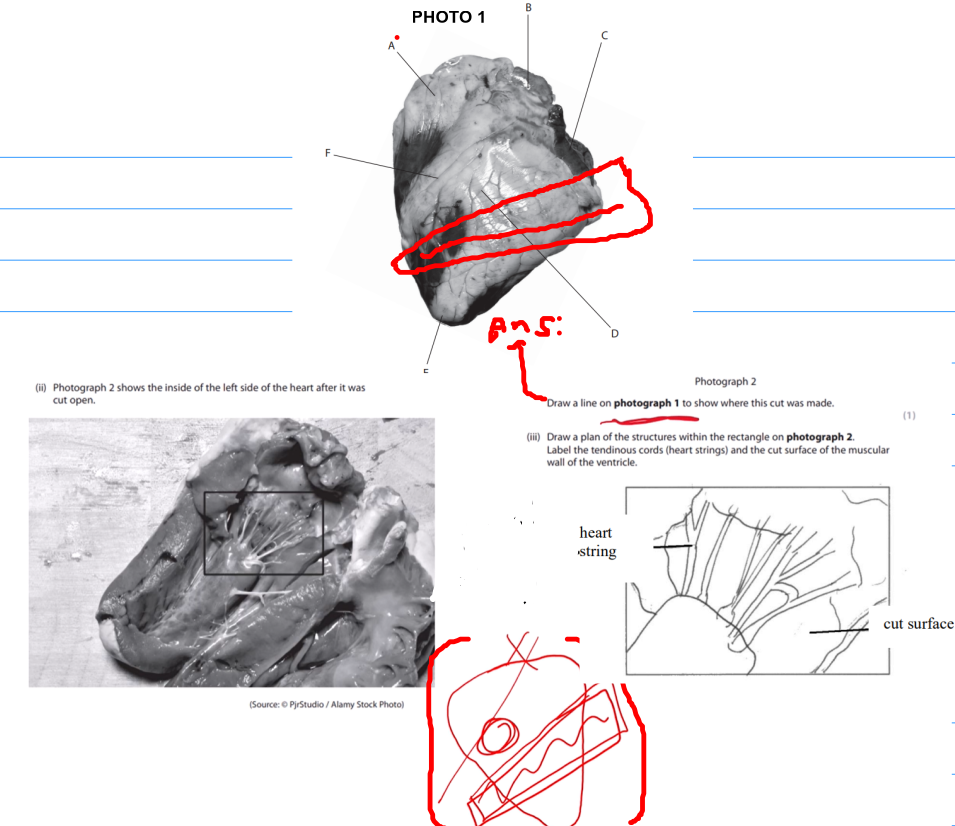
NOTE: “plan of the structures” literally means to draw the same thing from boxed part of photo but like zoomed in
(also for labelling don’t draw arrows, just line is fine)
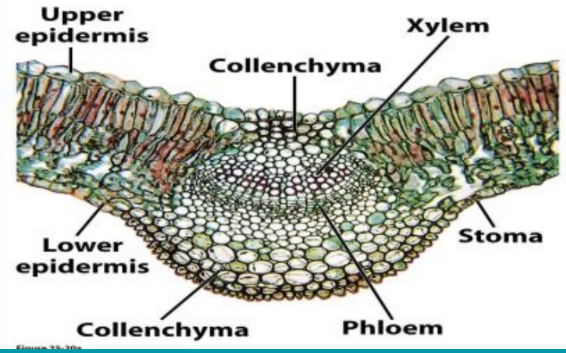
Describe how a thin section of a stem could be prepared and viewed using a light microscope,
in order to draw this plan
(4marks)
- cut thin section of stem using knife/scalpel
- add stain
- place stained section under coverslip
- draw under low power (and then details under high power)
NOTE:
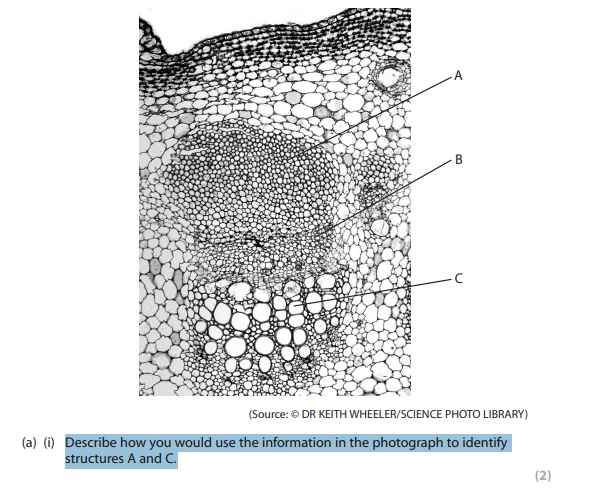
To identify cell structures within the vascular bundles from a photo, identify:
→ position within vascular bundle
→ cell wall thickness
[ cell size and lumen size just for reference, you can include but prolly no marks]
![<p><br>NOTE:<br>To identify cell structures within the vascular bundles <strong><u>from a photo, </u>identify:</strong><br><strong>→ <u><mark data-color="yellow" style="background-color: yellow; color: inherit;">position within vascular bundle</mark></u></strong><br><strong><u>→ <mark data-color="yellow" style="background-color: yellow; color: inherit;">cell wall thickness</mark></u></strong><br><br><strong><u>[</u></strong> cell size and lumen size just for reference, you can include but prolly no marks<strong><u>]</u></strong></p>](https://assets.knowt.com/user-attachments/d2e2c83c-316c-4a72-942d-08c058be8778.png)
DO NOT shade (or color) your high-power microscope drawings
2 similarities and 2 differences between nuclear envelope and cell membrane
(compare and contrast)
similarities:
- both control movement of substances
- both contain phospholipid bilayer
differences:
-nuclear envelope has pores but c. m does not
- nucluear envelope is double membrane while c.m is single
Cell division takes place after mitosis.
Compare and contrast cell division in animal and plant cells
(4marks)
Similarities:
- in both, cytokinesis occurs
- both produces genetically identical cells
Differences:
- animal cells form cleavage furrow, plant cells form cell plate
- plant cells remain connected by plasmodesmata after division, animal cells do not
for comment on, evaluate, discuss ETC questions with graphs, ALWAYS mention what?
S.D bars and validity
→ if its present then explain:
(-The error bars overlap, so there is no significant difference
- The error bars do not overlap, indicating a significant difference )
→ if S.D/error bars not present then we cannot comment on validity
Explain why beetroot tissue was rinsed/washed in distilled water after being cut. (2 marks)
removes leaked betalain pigment
ensures valid results
Explain how a colorimeter allows valid measurements of light transmitted. (3 marks)
- it uses same light source
- the colorimeter (machine) is callibrated
- it gives objective &quantitative measurements
(Removes human error / bias — colorimeter machine gives numerical absorbance values)
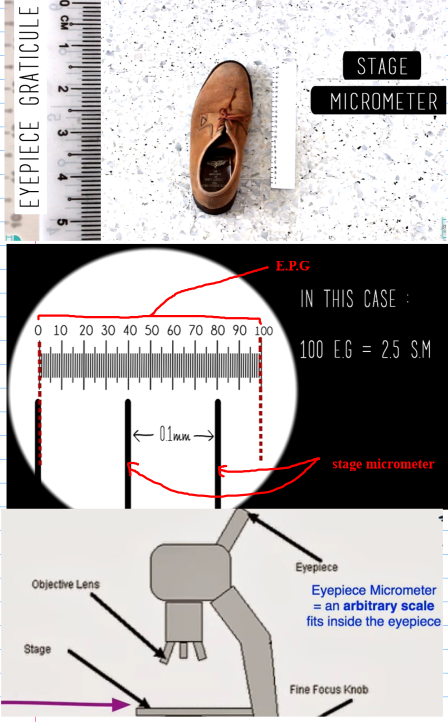
Describe how to calibrate an eyepiece graticule. (4 marks)
- Place stage micrometer on stage
- Align eyepiece graticule with stage micrometer
(Align = physically line up the scales, calibrate = calculating)
- Count matching divisions
- Calculate value of one E.PG/eye piece division (using stage micrometer’s known unit)
[look at the shoe diagram, the EPG scale shows shoe is only 5cm which is obv not true,
so we use stage micrometer, callibrate it and find actual length of shoe
(think of shoe as cell, floor is stage and E.P.G is the camera lens)
Explain why the following is done when preparing root tips for mitosis:
hydrochloric acid is used
root tip tissue is squashed under a coverslip
(4 marks)
-HCl breaks down middle lamella
- and separates cells (so that mitosis can be observed)
- squashing will flattens tissue into one layer
- thus spreading cells to be easily view (for observing mitosis)
(also first seen in low then high power → first to locate and then magnify to see details)
Explain one safety procedure when doing experiment of mitosis with root tip (2marks)
- wear gloves since HCL is used (to break middle lamella, thus seperating cells)
[or wear goggles]
- HCL is corrosive
![<p><strong>Devise a method that could be used to obtain the data for the pigment shown in the graph</strong><br>(<em>investigating effect on membrane permeability</em>)<br><br>[5marks]</p>](https://assets.knowt.com/user-attachments/236d9907-7ccb-417c-b697-3f8ac55f6b18.png)
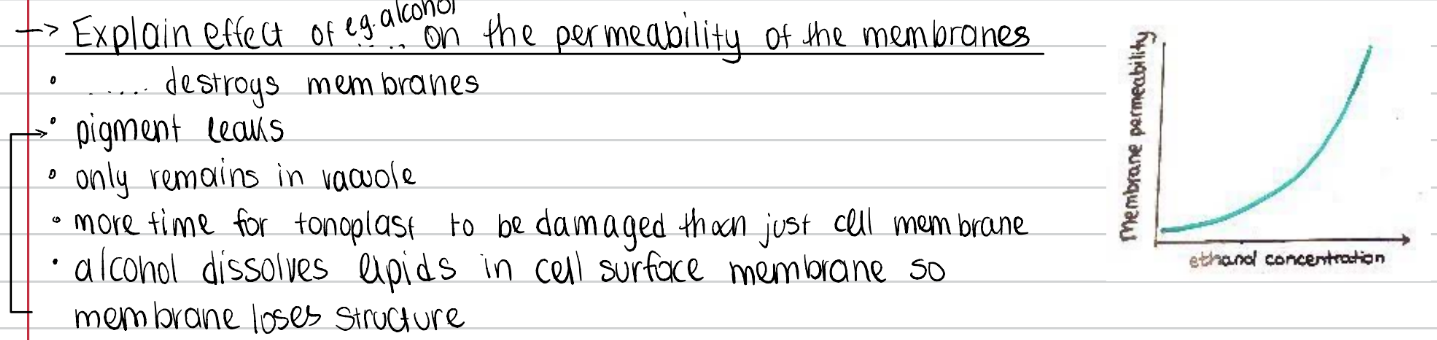
Devise a method that could be used to obtain the data for the pigment shown in the graph
(investigating effect on membrane permeability)
[5marks]
- cut EQUAL sized plant beetroot tissue
- rinse/wash beetroot in distilled water (to remove pigment for validity)
- place tissues in a range of 7 concentrations of the chemical
[range of n concentrations, depends on context Q.]
- use colorimeter to measure color intensity
- control other variables/factors such as temperature and pH
[temperature kept constant because it can affect pigment leakage]
Explain the effect on this investigation if the yam cylinders had been kept in
solutions at 20°C and the potato cylinders in solutions at 25°C
- potato solutions have more temperature, so the water molecules have more kinetic energy
[more temp → water molecules more k.e)
- hence more water would enter/ leave cell and thus rate of change in mass would be different
- hence there will be no valid comparison
Explain how you would carry out an experiment to observe mitosis in onion cells (5marks)
-take/obtain sample of root tip from onion
- add HCL acid (to breakdown lamella)
- add stain such methylene blue
(- Use a mounted needle to break open the root tip)
- squash root tip under coverslip
- use microscope to count number of cells under mitosis and cells under interphase
(squash so that cells are separated and mitosis is visible)
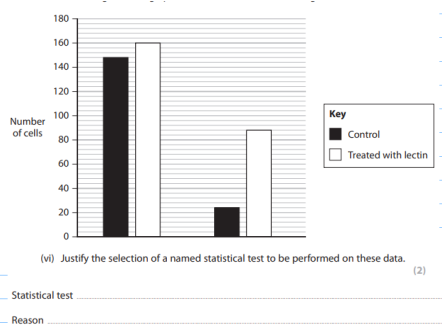
use of Chi squared test
because we need to test the significance of the difference between observed and expected results
NOTE:
-here frequencies(no. of cells) between two groups (Control vs Treated), thus chi squared used
-If the data were mean number of cells with standard deviation (and replicates), you could use a t‑test.
freqency between two groups → chi squared
means between two groups → t-test
Describe two ways in which secondary thickening affects the properties of the cell
(2marks)
- increases rigidity and strength
- makes cell waterproof
Give two reasons why fibre diameter was measured when strength of fibres was investigated
(2marks)
- fibre diameter is needed, which is convereted to radius for measuring area
- (cross sectional) area is needed to calculate tensile strength
- fibre diameter will affect tensile strength
(more related to phy lol, but you can see as area increases tensile strength decreases so area is needed)

Describe how the investigation could be modified to allow the significance of
the difference between the percentage germination for bee collected pollen
and hand collected pollen to be determined at 30°C.
- repeat the experiment while keeping all other conditions same,
i.e repeat the experiments at 30°C [be specefic to context]
- calculate the mean and S.D
- look for overlap in S.D/error bars (if overlap present there is no significant difference)
- use t-test or chi squared
give 2 needs for aseptic methods
- Prevents contamination of the agar with other (environmental) bacteria,
to ensure valid results
(stop unwanted environmental bacteria from entering and contaminating the study sample)
- prevent bacteria from escaping/ spreading
(this protects the environment and researchers)
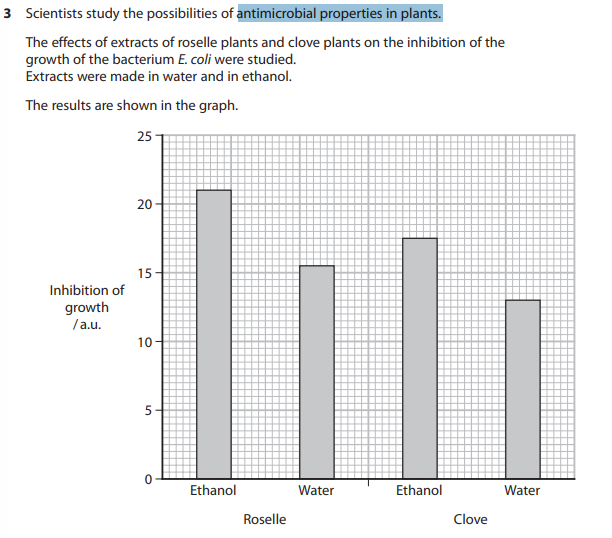
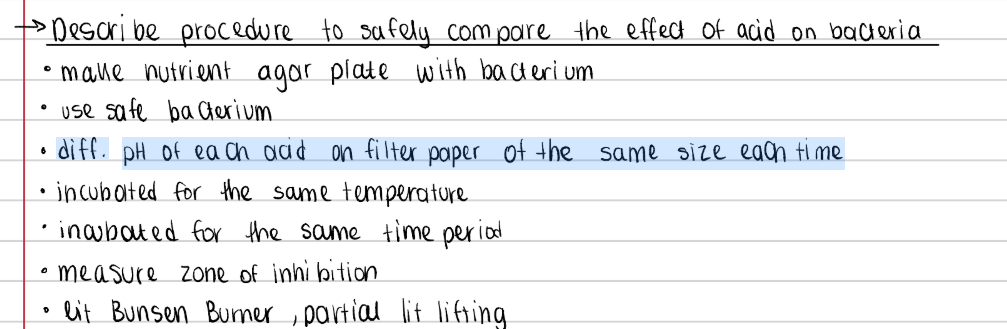
Devise a method to investigate the antimicrobial properties in these plants (6marks)
- bacterias grown in agar (jelly)
- (filter) paper discs soaked in plant extract (clover and roselle plants)
(i.e we make two extracts, one with plant + water and one with plant + ethanol)
- control variables such as using same sized discs
- use sterile equipment (to prevent contamination)
[gloves and goggles for safety]
- put soaked paper discs in agar and incubate for a fixed period of time (around a week)
- measure area of zone of inhibition and compare the areas
(bigger inhibition area means better antimicrobial properties, cuz it inhibits bacterial growth better)
In a study, the internal pH of E. coli was reduced by some extracts.
Suggest why these extracts have an antimicrobial effect on the bacteria.
(3 marks)
- since pH reduced, the pH is no longer optimum for enzymes
- enzymes are needed for growth so growth is reduced
- enzymes may also denature, hence showing antimicrobial property
[antimicrobial literally means → substances that destroys microorganisms/bacteria or inhibits their growth]
Describe how vitamin C content in an extract of a fruit can be measured
(5marks)
- add extract to known volume of DCPIP solution
- until DCPIP solution goes from blue to colorless
- record volume of extract used to decolorise DCPIP and
- repeat titration again with (known) volume of stock solution
- finally vitamin C content is found using formula : V1C1 = V2C2
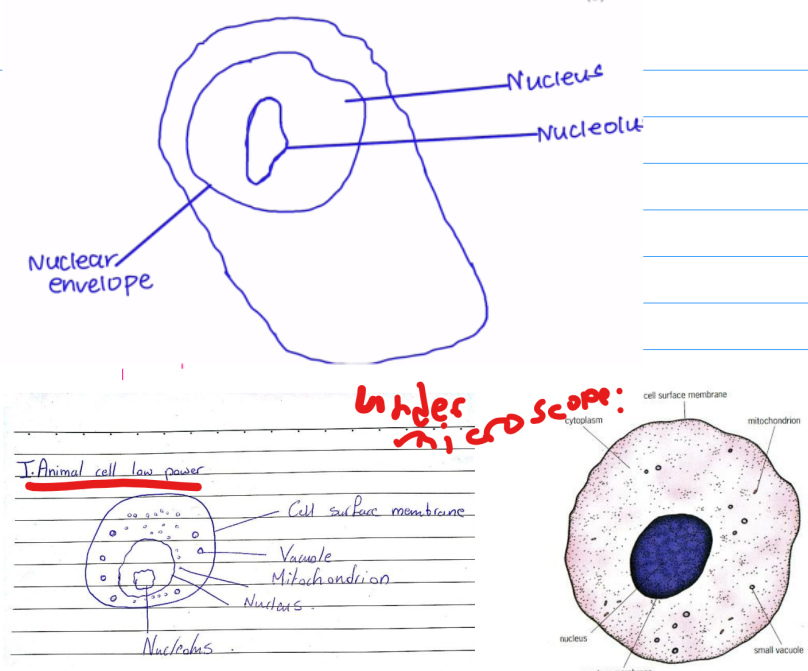
Give one reason for each of these steps in showing WBC on a microscope:
1) The blood sample is placed onto a slide
2) A stain is added
3) A coverslip is placed onto the slide
1) to allow us to place the WBC sample onto the stage of microscope
2) so that WBC becomes visible
3) coverslip is placed to flatten the blood sample (so they are seperated and visible under microscope)
draw only major outlines / large visible structures
just general lay out
(like the other example, Transverse section of leaves)
NOTE → individual CELLS ARE NEVER DRAWN IN LOW POWER PLAN
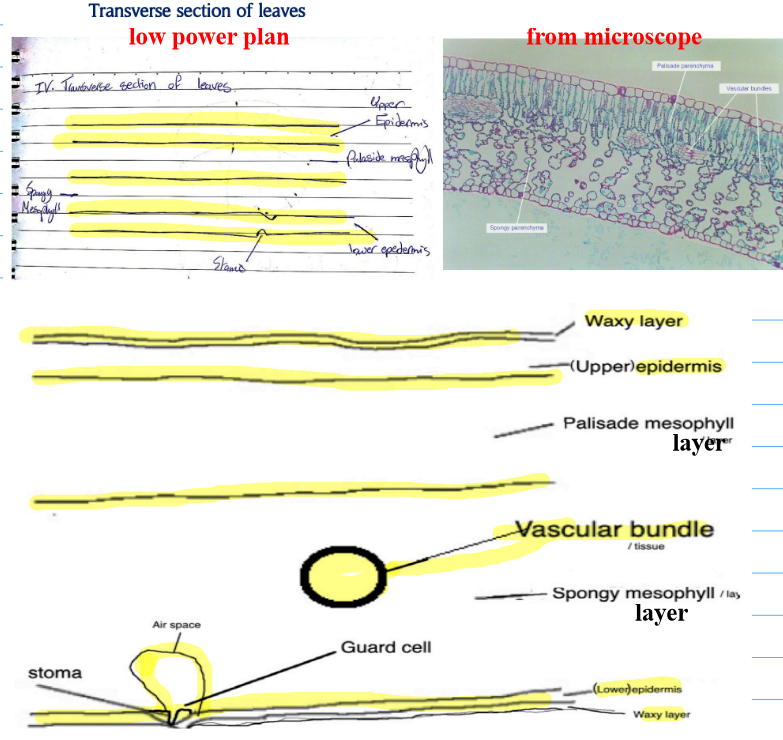
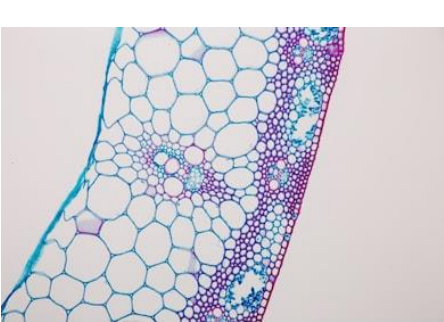
photo shows schlerenchyma section under micrsocope
Draw a low power plan diagram
(3marks)
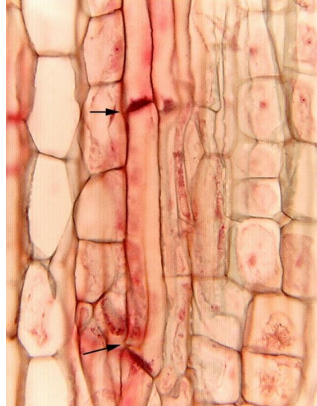
photo shows a section of phloem under microscope
Draw a low power plan diagram.
you should not draw individual sieve plates (or any individual cells) in a low power plan diagram
low power plan = only rough boundaries
Explain how the optimum temperature of cellulase was determined when f (3-4marks)
Set up the cellulase and cellulose reaction at a range of temperatures using waterbath
- control factos such as pH and substrate concentration
- measure the rate of glucose production in fixed time using benedicts test ( use stop watch and benedict reagent)
- optimum temperature is the temperature that gives fastest rate
(for optimum pH, same thing but range of pH using waterbath)
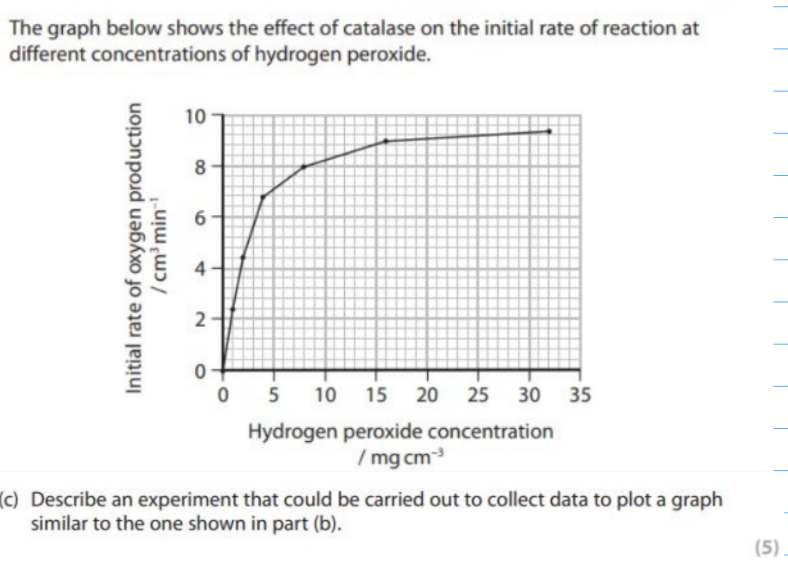
- use different concentrations of substrate
- measure volume of oxygen over period of time using gas syringe
- calculate initial rate of reaction (by drawing tangent and finding grad)
- repeat and calculate average
- control temperrature using water bath and pH using buffer
suggest how initial rate of this reaction could be determined(3 marks)
- measure mass of substrate of a range of time
- and plot a graph of mass (y) against time (x) (1)
- find the gradient of the graph at its start
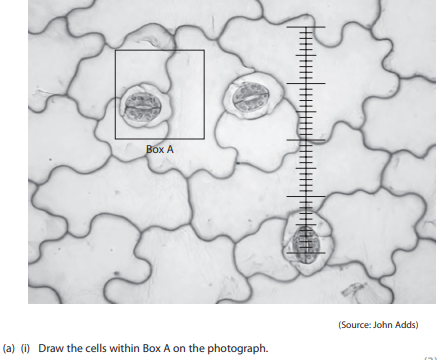
Draw the cells within box A
If question says:
“draw the cells”
“draw what is seen”
“biological drawing”
✅ detailed cells
low power plan”
✅ simplified outlines only
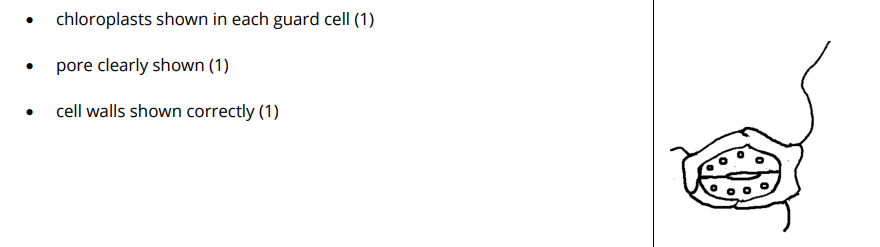
draw under low power plan
Low power image
do not draw individual cells
include magnification
High power image
only a few cells
cell wall

use minimum of five fish of different sizes
measure the {length / mass / volume} of each fish
measure the {length / mass/ volume} of each fish’s heart
plot a graph of fish size vs heart size
carry out correlation test so see if statement is true
concept, low power plan
Explain how color standard can be used as a semi quantitative method of estimating conc of starch in sample
(3marks)
• make known concentrations of starch
• add iodine (solution)
• color of sample compared to color chart
• the darker the colour the more starch or reverse (1)
effect of alcohol on membrane
The antibacterial properties of an extract of the seeds were investigated. The extract was made using ethanol.
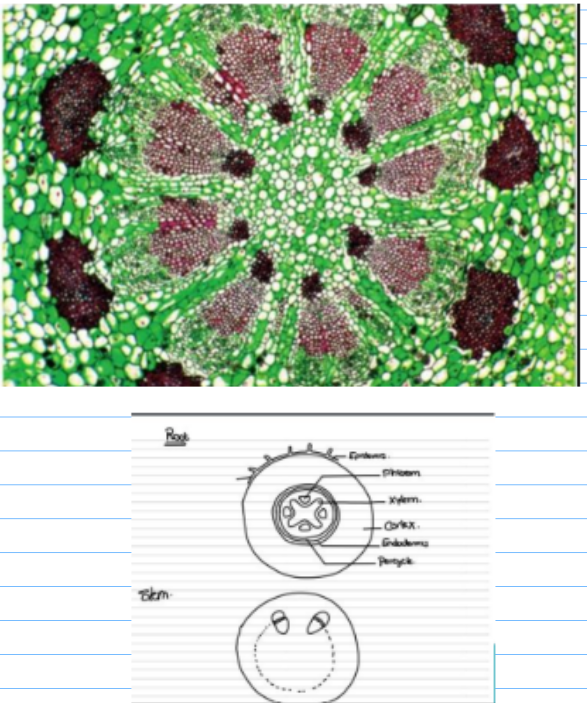
Describe how to make a clear solution, of known concentration, using powdered seeds.(3marks)
make powder seeds by crushing with mortar and pestle
use known volume of ethanol and know volume of seeds
[ conc = mass / volume]
the product is then filtered and clear solution is obtained
![<p><br>make powder seeds by crushing with mortar and pestle<br><br><strong><u>use known volume of ethanol and know volume of seeds</u></strong><br>[ conc = mass / volume]<br><br>the product is then filtered and clear solution is obtained</p><p></p>](https://assets.knowt.com/user-attachments/1a94a1a6-3eeb-4888-a6de-298bc3b4ab1e.png)
Describe how bacteria could have been added to the nutrient agar to produce a lawn.
[3marks]
- use cotton bud to remove bacteria from culture
- make sure cotton bud is sterilised
- use of (glass) spreader to make lawn
[in diagram]
![<p>- use cotton bud to remove bacteria from culture</p><p>- make sure cotton bud is sterilised<br>- use of (glass) spreader to make lawn<br><br>[in diagram]</p><p></p>](https://assets.knowt.com/user-attachments/783f5ade-63cf-45fa-9ff3-701ef29412d8.png)
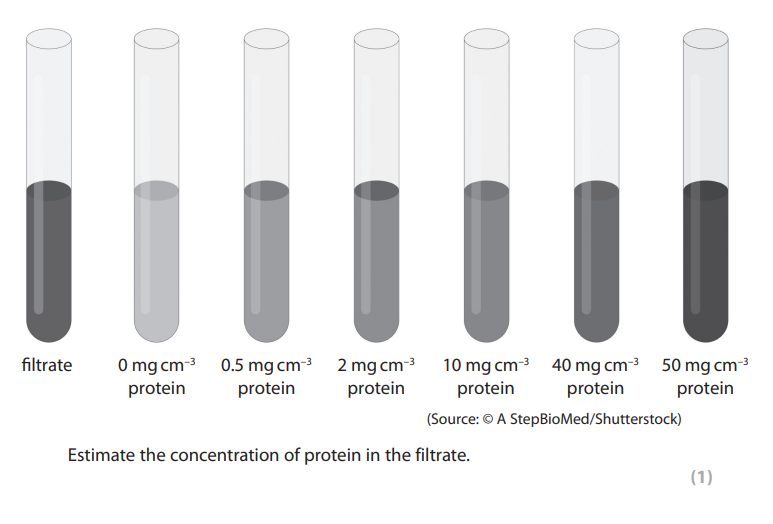
filtrate color is like darker than 40 but lighter than 50
Ans: 45
(any number between 40-49 is correct)
Devise an experiment to investigate plant mineral deficiencies (5marks)
- grow plants of same age and species in water culture/without soil of mineral ions solutions
such as calcium, nitrate and magnesium ion
- in each solution one of the ions will be lacking and one solution keep water only for control
- keep other variables such as pH and temperature same
- measure how growth is affected via change in plant height and mass
- solution without magnesium ion will have yellow leaves, without nitrate the mass will be lower and without calcium height is low as not enough support (no middle lamella)
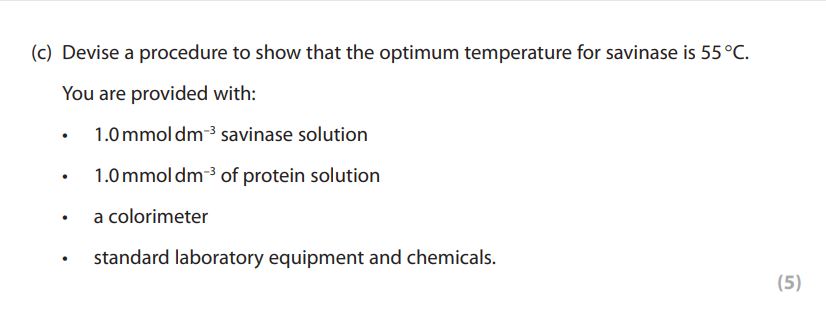
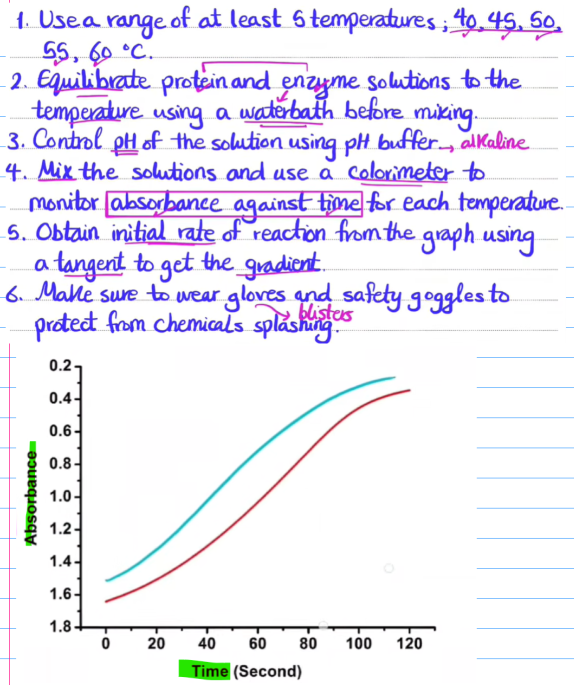
Explain why the initial rate of reaction was measured in this investigation (2marks)
- because initially substrate is in excess
- so substrate is not limiting factor, hence allows valid results
in insoluble protein, cloudy solution was present
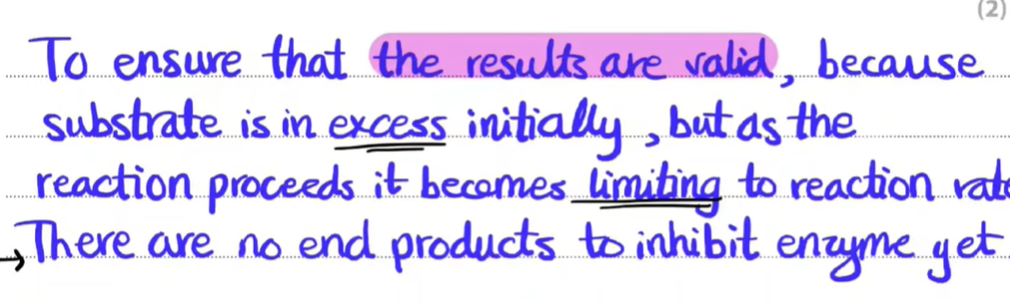
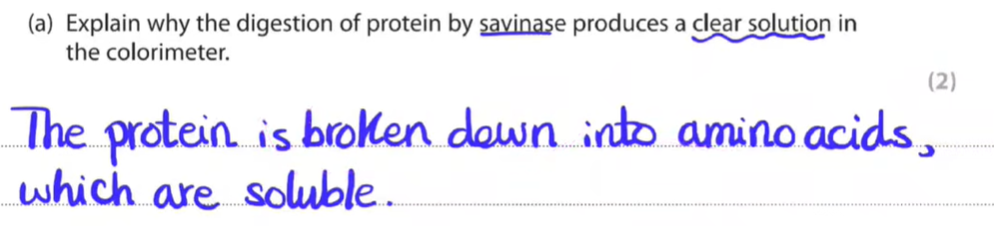
Explain why the digestion of protein by savinase produces a clear solution in the colorimeter.
as its soluble, solution is clear
Insoluble gives cloudy solution
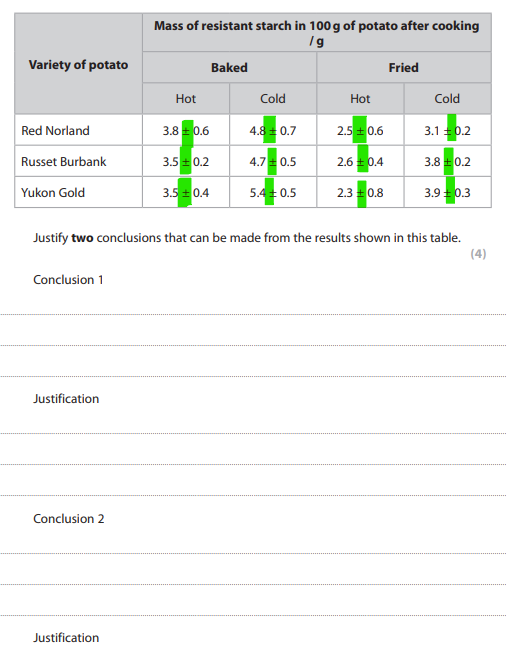
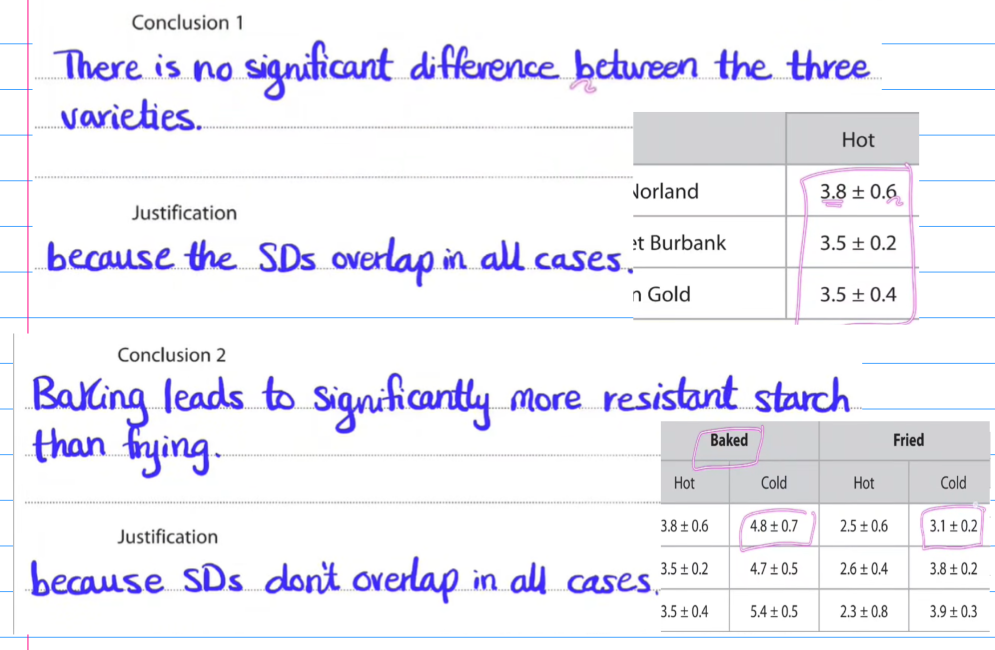
SO MANY S.D values, its a hint to use them to give conclusion
Water potential experiment
cut pieces of same sized (potato)
find mass of each piece before and after soaking
soak pieces in solutions for same time period
blot dry before weighing
repeat for each solution and find mean