Unit 11 - Inferences for Distributions of Categorical Data
1/13
There's no tags or description
Looks like no tags are added yet.
Name | Mastery | Learn | Test | Matching | Spaced | Call with Kai |
|---|
No analytics yet
Send a link to your students to track their progress
14 Terms
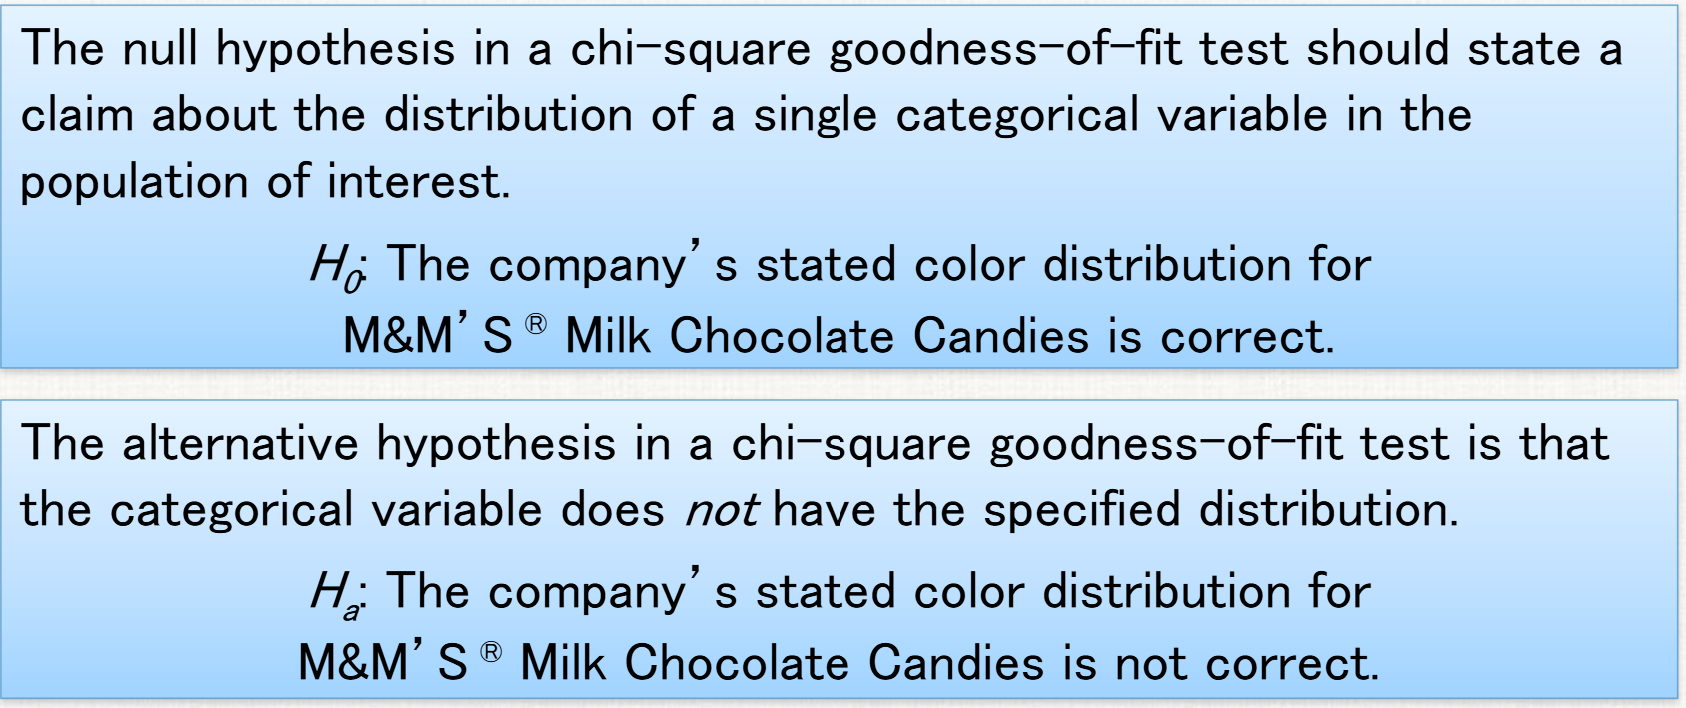
chi-square goodness-of-fit test (+hypotheses)
allows us to determine whether a hypothesized distribution seems valid
H0: the stated distribution of (the categorical variable in the population of interest) is correct
Ha: the stated distribution of (the categorical variable in the population of interest) is not correct (always two-sided!) example in pic
-compare observed counts from our sample to the expected counts (this is for all x² tests)
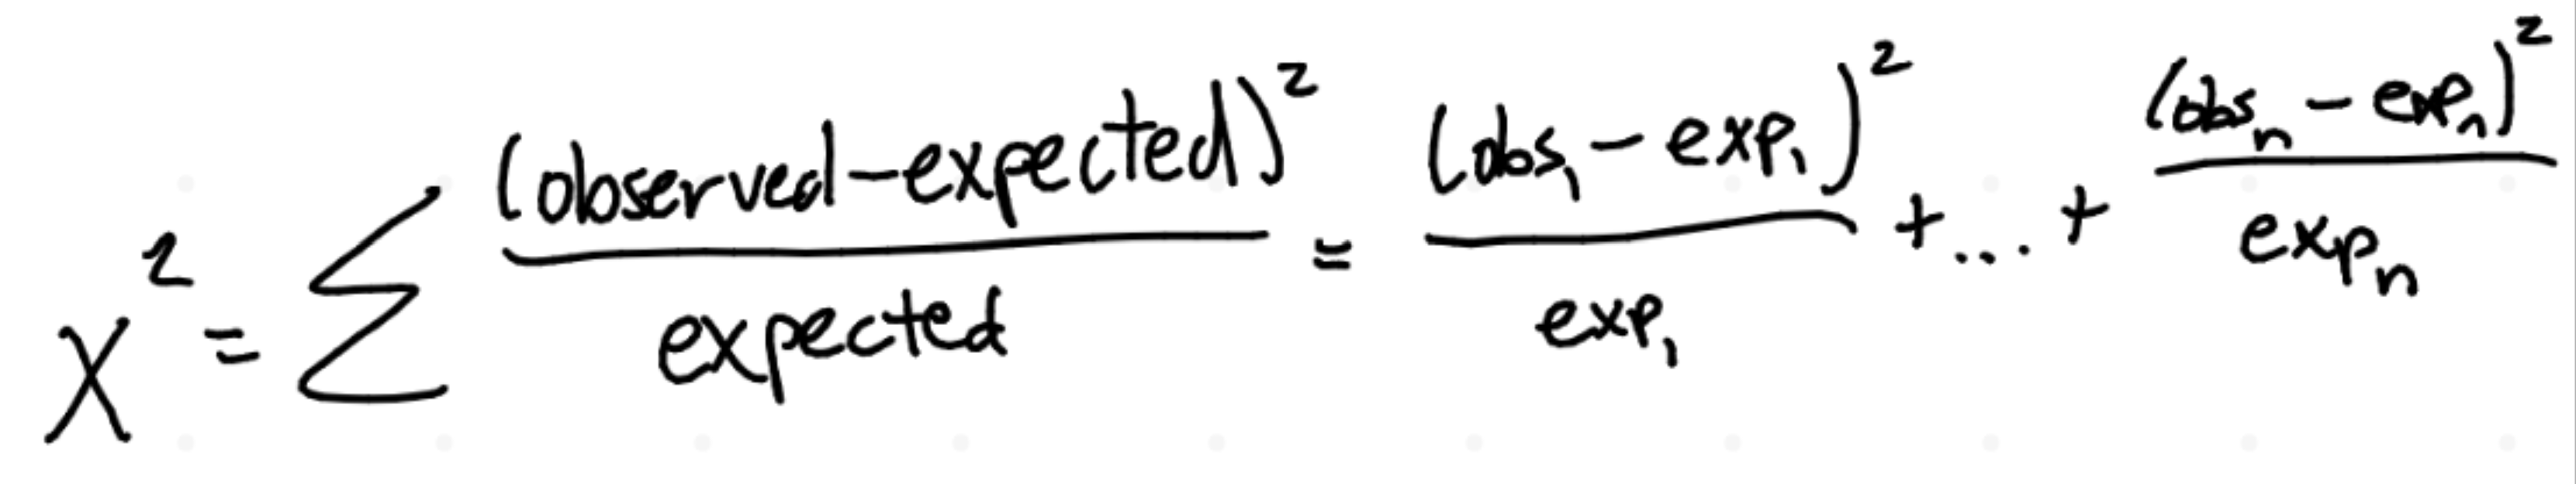
chi-square statistic
measures how far apart the observed and expected counts are
★when showing calculations, write out the work for (at least) 2 categories
^get contribution of cell by doing the individual (obs-exp)²/exp for that cell
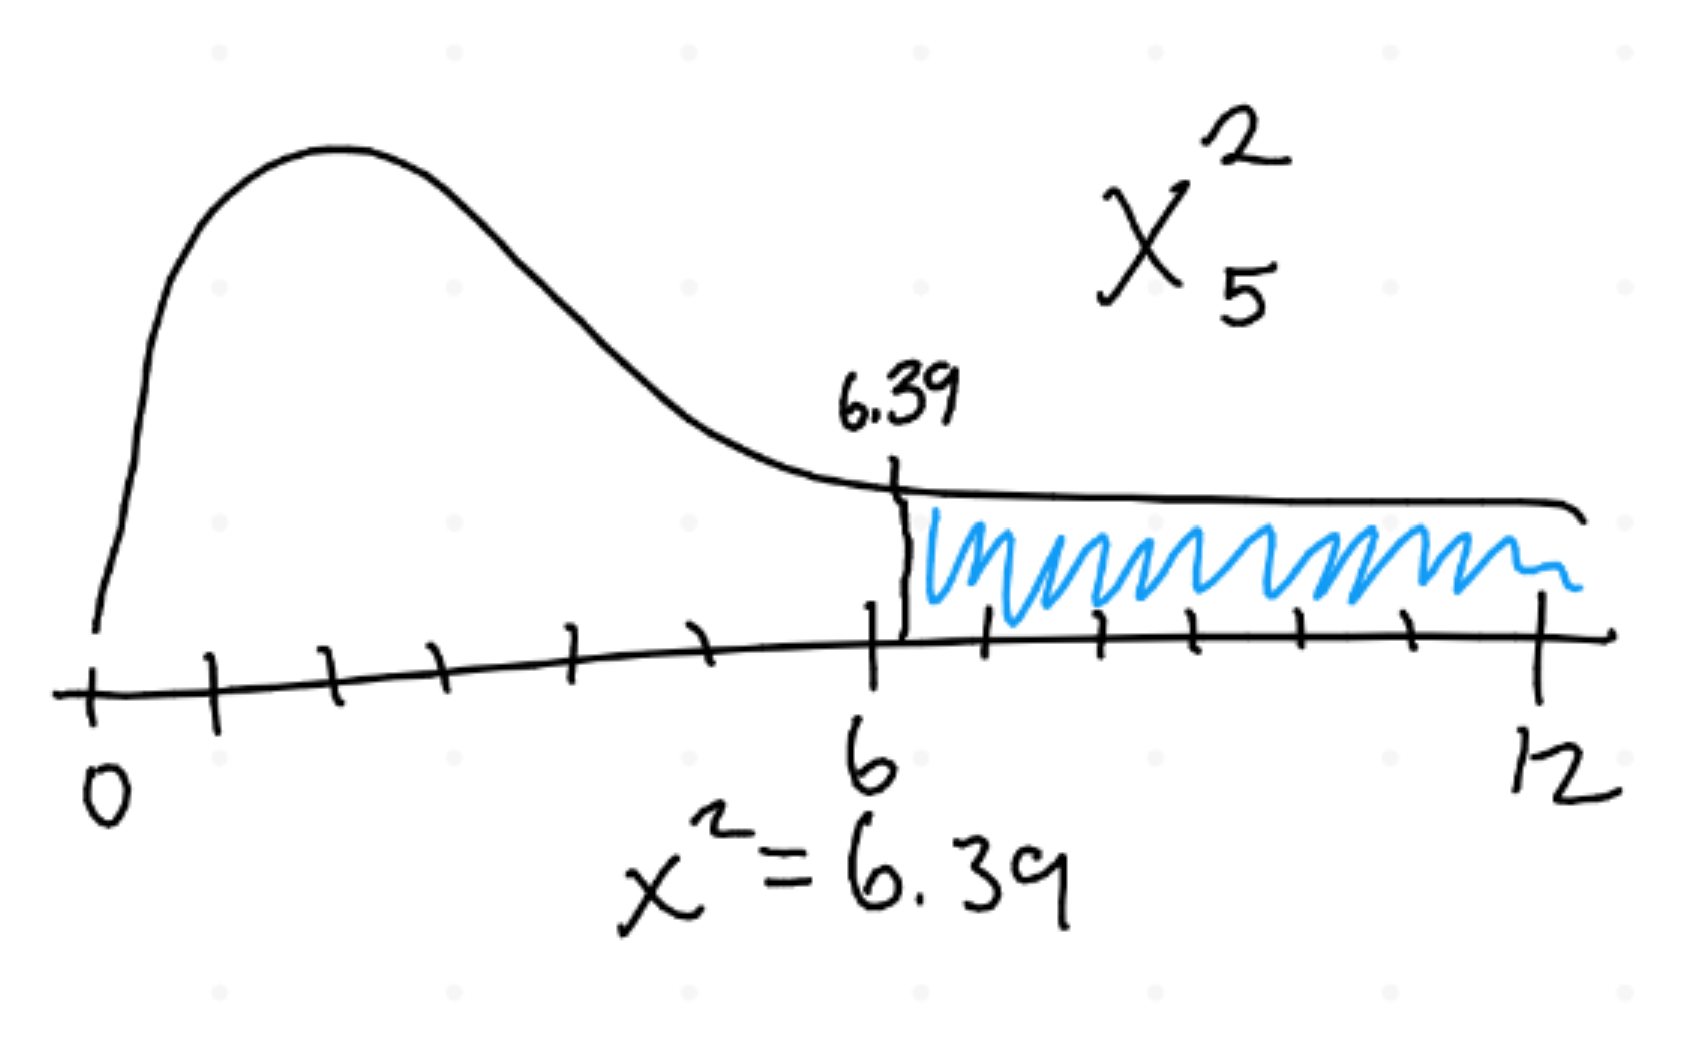
Drawing chi-square curve
right skewed (only + values, x² can never be -)
label 0 to wtv (I recommend twice the x² value)
label tick at x², shade right
write x²=# below the curve
label curve with x²df (df for GOF is # of categories - 1) (# of categories of the categorical variable)
incr df, shape less skewed (still skewed tho)
How to get p-value for chi-square test (GOF, homogeneity, or independence)
do x²cdf (from [2nd] [vars] on calc)
put in lower x² value, upper 1000, and df
p-value always area under the curve to the right of x²
write probability statement → ex) P(x²>#)
Conditions for chi-squared goodness-of-fit test or chi-square test for homogeneity or chi-square test for independence
random sampling/assignment (homogeneity - do for each population!!)
10% (n≤0.1N) (independent observations) (homogeneity - do for each population!!) (skip if experiment)
Large counts (all expected counts ≥5)
+categorical data!! / GOF expected count from proportion * sample size. LEAVE THE DECIMAL!
!!! (flip for chi-square info cheat sheet/summary)
chi square tests need independent observations (not CLT)
do homo/indep tests on same data -> same conditions, x², and p-value! (diff hypotheses & conclusion tho)
x² distribution cannot be negative (always +, curve drawn w ticks above 0)
x² is unitless
don’t need to define anything in chi-square tests b/c hypotheses are in words
calculator: [stat] [Tests] x²GOF-Test (put data into Lists, say which is Observed/Expected, put df)
^do x²-Test for homogeneity and inference (put data into matrix ([2nd] [x-1] then edit. don’t include totals. to change which matrix you put in for the test, press [2nd] [x-1] then enter on the matrix you want to fill observed/expected)
multiple comparisons - hard to do many comparisons at once
^inference for 2-way tables (need counts!)→do overall test to see if there is good evidence of any differences among the parameters we want to compare, then detailed follow-up analysis to decide which of the parameters differ and to estimate how large the differences are (good evidence of difference(s)? what are the differences (details)?)
^compare observed counts from 2-way table with expected counts
Hypotheses for chi-square test for homogeneity
H0: there is no difference in the distribution of [categorical variable] for [the several populations or treatments]
Ha: there is a difference ^
^ex: sports goals for categorical var; females and males at the university for several populations
How to do conditional distribution for two-way table (homogeneity/independence)
do each cell out of the row total OR column total. total must be from a population (think of it as finding proportions by breaking down the populations into different parts of a categorical variable) ← use segmented bar chart or side-by-side bar chart
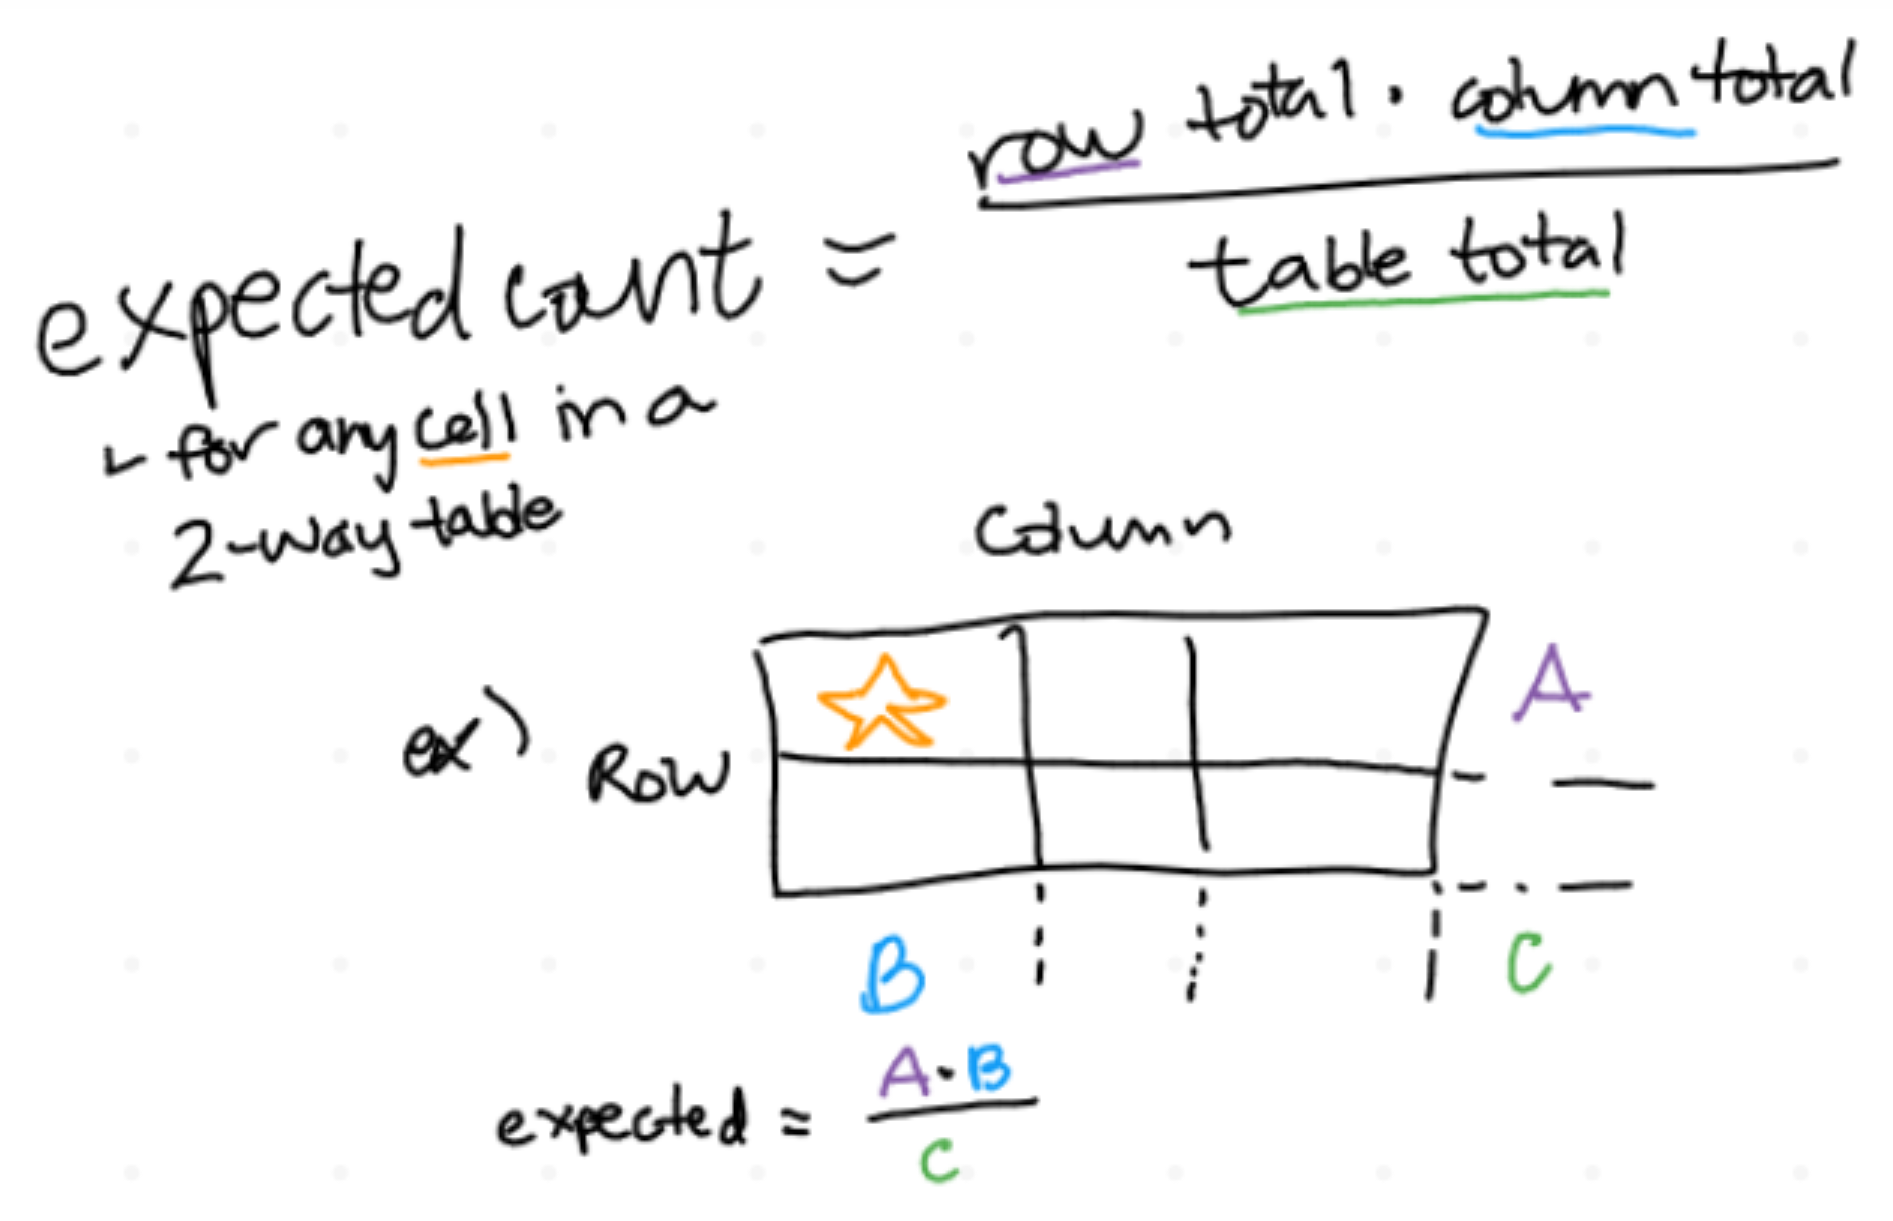
How to find expected counts when H0 is true
(homogeneity/independence tests)
How to get df for chi-squared test for homogeneity/independence
df = (# of rows - 1)(# of columns - 1)
Hypotheses for chi-square test for independence
H0: there is no association btwn (2 categorical variables) in (the population of interest)
Ha: there is an association ^
*what is the relationship of the variables?
Interpret p-value for homogeneity and independence
Assuming (null is true), there is (p-value) probability of…
homogeneity: …observing a difference in (categorical variable) as large or larger than the difference observed in the study by chance alone
independence: …getting a random sample of (n population) with an association as strong or stronger than the one found in the study
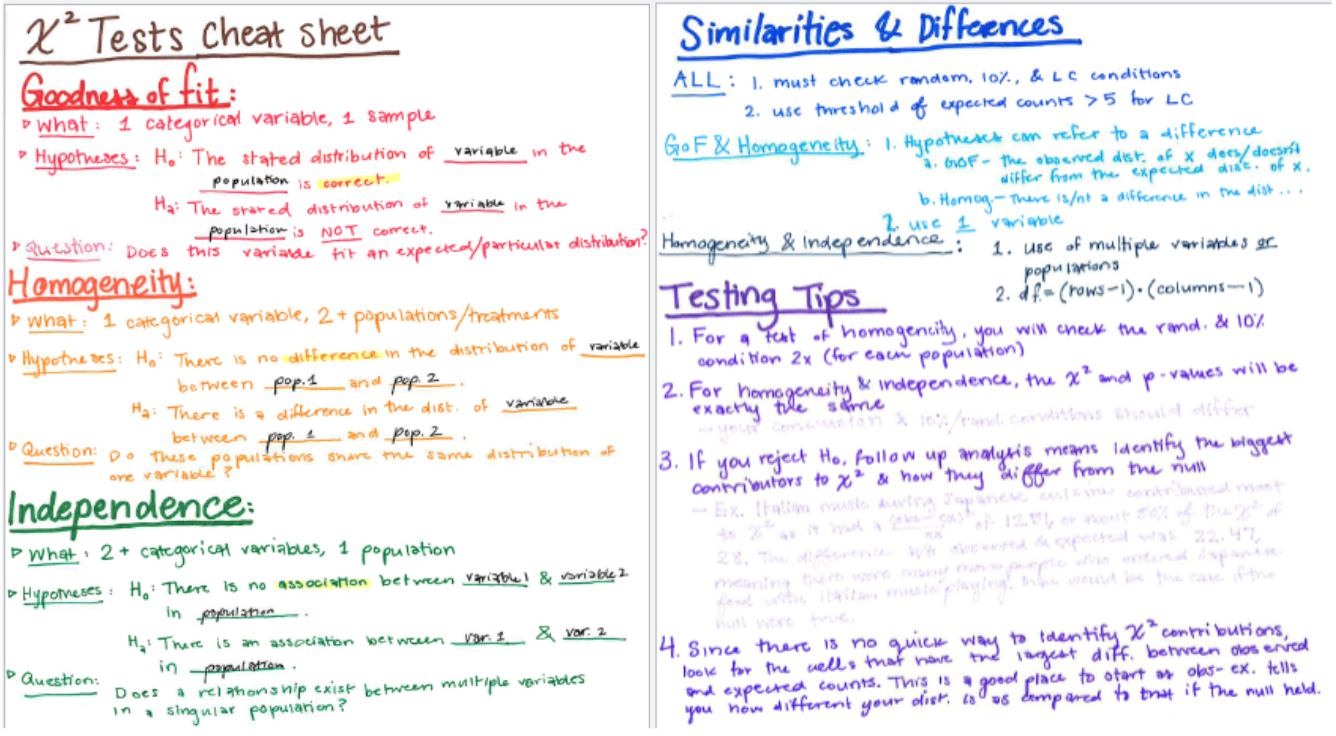
Difference between the chi-square tests
GOF: 1 variable, 1 pop
homogeneity: 1 var, multiple populations/samples/treatments
independence: multiple vars, 1 population/sample
!!! draw bar chart → can do percentage for y-axis, do out of POPULATION(S)
say categorical variable(s) and population(s) in hypotheses!
follow-up analysis → what is contributing the most to the chi-square statistic? (get from doing the individual calculation for that cell from chi-square. (observed-expected)²/expected for just that cell) (cell highest contribution -> deviates most from null) (when interpret, say the # for the contribution & compare the observed and expected value for the cell that contributes most. this cell suggests (Ha) is true)
experiment can be homo/indep. homo if only 1 variable but several treatments. indep if finding association btwn two variables.
random assignment → don’t need to do 10% condition (purpose of random assignment: create roughly equivalent groups at the start of the study + reduce confounding variables)
^different assignments into groups bc experiment -> multiple treatments-> homogeneity
show work to get expected counts (esp for GOF - percentage times the sample size)