Chapter 10: Concepts and the AMPS Model
1/97
There's no tags or description
Looks like no tags are added yet.
Name | Mastery | Learn | Test | Matching | Spaced | Call with Kai |
|---|
No analytics yet
Send a link to your students to track their progress
98 Terms
Learning Objectives
LO 10-1 Define Big Data and Data Analytics.
LO 10-2 Describe the benefits and costs of using Data Analytics.
LO 10-3 Understand the impact of Data Analytics on business.
LO 10-4 Understand the impact of Data Analytics on accounting.
LO 10-5 Describe how the AMPS model explains the data analytics process.
LO 10-6 Describe the first stage of the AMPS model—asking appropriate questions.
LO 10-7 Describe the second stage of the AMPS model—mastering the data.
LO 10-8 Describe how audit data standards are useful in sharing data between a company and its auditors in preparation for data analysis.
LO 10-9 Define and demonstrate the third stage of the AMPS model— performing the analysis—using different types of analysis.
Big Data is defined as
•as datasets that are too large and complex for businesses’ existing systems to handle using their traditional capabilities to capture, store, manage and analyze these data sets.
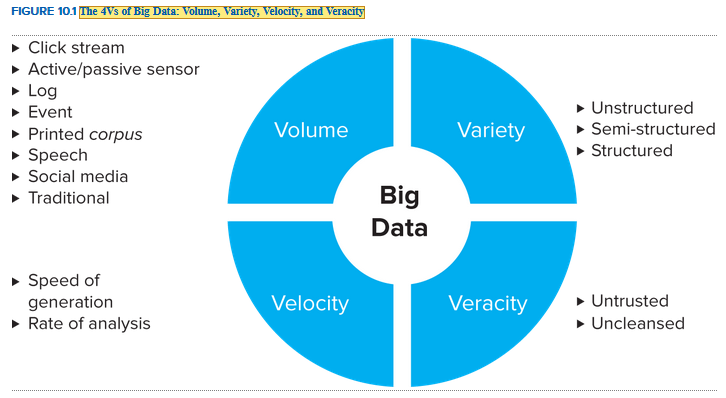
•The four Vs—are often used to represent the defining features of Big Data.
Volume, Velocity, Variety, Veracity
Volume
–refers to the massive amount of data involved, the sheer amount of data, regardless of its source.
Velocity
refers to the fact that the data comes in at quick speeds or in real time, such as streaming videos and news feeds; the speed that the data is being generated or the rate that data is being analyzed
Variety
–refers to unstructured and unprocessed data, such as comments in social media, emails, global positioning system (GPS) measurements, etc.; the form of data
Structured data
Highly organized data that fits nicely in a table or in a database. A balance sheet or income statement is a good example.
Unstructured data
Data without internal organization (or structure). Blogs and social media and pictures posted in Instagram would both be examples of unstructured data.
semi-structured data
Data that has elements of both structured (highly organized) and unstructured (not highly organized) data.
Veracity
refers to the quality of the data including extent of cleanliness (without errors or data integrity issues), reliability and representationally faithful
T/F: Some data is cleaner (without errors or data integrity issues), more reliable (closer to fact than fiction), or more representationally faithful than other data.
True
Data with greater veracity is oftentimes
more impactful, carrying more weight in data analysis
than data with lesser veracity.
T/F: Even in accounting, some data is generally considered to be factual (how much cash does a company have in the bank) and other data is considered to be simply an estimate
True
The 4Vs of Big Data: Volume, Variety, Velocity, and Veracity (table)
Data Analytics
•defined as the science of examining raw data, removing excess noise and organizing the data with the purpose of drawing conclusions for decision making.
Data analytics often involves
the technologies, systems, practices, methodologies, databases, and applications used to analyze diverse business data to help organizations make sound and timely business decisions.
Data Analytics is useful for a business to
examine patterns and trends in large datasets.
the process of Data Analytics aims at transforming
transforming raw data into valuable information
Data Analytics plays a vital role in
examining the data to generate models for predictions of patterns and trends. If the data couldn't be analyzed to provide meaningful insight, the Big Data would not be nearly as valuable.
Effective Data Analytics provides a way to search
through large and unstructured data to identify unknown patterns or relationships. Then, this data is organized in a meaningful structure to be extracted in order to provide useful information.
1. How would considering weather patterns to predict corn production qualify as Data Analytics?
Analyzing weather patterns and correlating them with corn production is an example of Data Analytics. We generally know that rain and exposure to sun are key components of corn production, so knowing and measuring rain, sun, temperature, and humidity might all be useful data. Data Analytics would figure out how to remove excess noise from the dataset and organize the data in such a way as to draw conclusions and highlight the relationship between weather patterns and characteristics with corn production. Understanding weather patterns might help a farmer choose a variety of corn seed engineered to be resistant to drought or flood, or decide how much to plant, etc.
Using their definitions and the textbook discussion, compare and contrast Big Data and Data Analytics.
Big Data is defined as datasets that are too large and complex for businesses' existing systems to handle utilizing their traditional capabilities to capture, store, manage, and analyze these datasets, while Data Analytics is the science of examining raw data, removing excess noise from the dataset, and organizing the data with the purpose of drawing conclusions for decision making. Big Data seems to highlight the size of the data-that it is simply so big and unmanageable but Data Analytics uses context to figure out what is needed to draw conclusions to be useful in decision making. Specifically, Data Analytics provides a way to search through large and unstructured data to identify unknown patterns or relationships.
L.O 10-2
Determine the benefits and costs of using data analytics
What differentiates Big Data from other types of data is determined by
whether these data push the limit of capabilities of information systems that work with these data.
two important limiting factors in their business systems when dealing with Big Data:
storage and processing.
the amount of data the company can feasibly store
varies greatly
Many companies choose to use ___ to lower cost of data storage
a cloud platform
The data itself might have a cost to acquire it (such as the cost to acquire weather pattern data, Twitter data, economic data, etc). Another cost is that
raw data must be scrubbed from extraneous data and noise to become useful
extract, transform, and load (ETL)
The process of cleaning and scrubbing the data before data analysis can take place.
Data Analytics professionals estimate that they spend ___ percent of their time cleaning data so it can be analyzed.
between 50 percent and 90 percent
There is an explicit cost that
includes the salaries of the Data Analytics scientists and the cost of the technology to prepare and analyze the data that needs to be included in the cost of performing Data Analytics.
the organization will want to ensure that the cost to acquire,
extract, process, analyze, and store such information is
exceeded by the benefits of receiving such information
1. What are some examples of the many costs involved in performing Data Analytics?
The costs of Data Analytics include the costs to acquire, process, store, acquire, reformat, cleanse, and scrub the data to get it ready for its intended use. Data Analytics scientists salaries and the cost of the technological equipment to prepare and analyze the data are also costs.
L.O 10-3
Understand the Impact of Data Analytics on Business
A study from McKinsey Global Institute estimates that Big Data could generate up to
$3 trillion in value per year in just a subset of industries impacted
It is clear that Big Data is a disruptive force and must be addressed.7 That is, the real value of data comes from
Data Analytics.
With a wealth of data on their hands, companies are empowered by using Data Analytics to
discover various patterns, investigate anomalies, forecast future behavior, etc.
with insight provided through Data Analytics, companies could
do more directed marketing campaigns based on patterns observed in their data, giving them a competitive advantage over companies that do not use this information
Patterns discovered from historical data enable businesses to identify
future opportunities and risks.
In addition to producing more value externally, studies show that Data Analytics affects
internal processes, improving productivity, utilization, and growth.
Data Analytics often also involves
data management and business intelligence with domain knowledge of business functional areas
Data Analytics skill sets often are composed of
acquiring/cleansing data, creating data structures/models, and mining/analyzing data.
The skills associated with Data Analytics are relevant across
industries, including scientific, medical,manufacturing, technical services, information technologies, retail trade, government agencies, and more.
According to the results of the 18th Annual Global CEO Survey conducted by PricewaterhouseCoopers (PwC), many CEOs indicate that they put a high value on Data Analytics, and ___ percent of them place data mining and analysis as the second-most important strategic technology for CEOs.
80
per PwC's 6th Annual Digital IQ survey of more than __ leaders from digital businesses, the area of investment that tops CEOs' list of priorities is business analytics
1,400
____ includes a number of estimates and valuations that
might be better evaluated through use of Data Analytics.
Financial reporting
L.O 10-4 Understand the impact of Data Analytics on Accounting
Many financial statement numbers are just estimates, so accountants often ask themselves questions like these to evaluate those estimates:
1. How much of the accounts receivable balance will be collected?
2. Is any of our inventory obsolete? Are customers still interested in it? Should our inventory be valued at market or cost (applying the
lower-of-cost-or-market rule)?
3. Is our goodwill correctly valued, or has it been impaired? Due to conservatism, do we need to write it down or write it off?
4. Is our property, plant, and equipment overvalued in the current real estate market?
One way to answer these questions may include the possibility of using Data Analytics to scan the environment-that is, scanning
social media to identify potential risks and opportunities to the firm.— sense, it may allow a firm to monitor its competitors and its customers to better understand opportunities and threats around them.
Data Analytics may also allow an accountant or auditor to assess the
the probability of a goodwill write-down, warranty claims, or the collectability of bad debts based on what customers, investors, and other stakeholders are saying about the company in blogs and in social media.
Auditing:
__ percent of CEOs say they find it important to champion digital technologies and emphasize a clear vision of using technology for a competitive advantage, while_ percent say they put a high value on Data Analytics.
86, 85
Given the fact that operational data abounds and is easier to collect and manage, combined with CEOs' desires to utilize this data,accounting firms will be approaching their engagements with a different mindset.No longer will they be simply checking for material misstatements, fraud, and risk in financial statements or merely reporting their findings at the end of the engagement. Now, audit professionals will be
collecting and analyzing the company's data similar to how an internal cost accountant or business analyst would in order to help management make better business decisions.
This means that external auditors will stay engaged with clients beyond the audit.
The audit process will be changed from a traditional process toward a more automated one, which will allow audit professionals to focus more on the logic and rationale behind data queries, and less on the gathering of the actual data
Data Analytics also expands auditors' capabilities in services like
testing for fraudulent transactions and automating compliance-
monitoring activities
This increase in automation will also result in both a higher quality and consistency of the audit and will help auditors
identify issues earlier, thereby reducing surprises.
With Data Analytics, Greater insight into the client's operations would result in a more thorough audit and a better client experience. The ability to accurately identify risks would
become more transparent whether it consists of security breaches or just simply flawed processes.
IT advisory/consulting and tax services would also benefit from the greater insight provided by Data Analytics from the audit team because
the analyses could provide a seamless big picture between functional areas.
With Data Analytics, Financial and operational projection models could be developed to allow for
quick and accurate "what if clear" business forecasting.
By using Data Analytics, auditors are able to
1) to spend less time looking for evidence, which will allow more time for presenting their findings and making judgments.
2) to vastly expand sampling beyond current traditional sample sizes and, in many cases, be able to test the full population of transactions.
3) to be able to work from anywhere at any time, given the data will be at the ready, and there will no longer be a need to pull data at the client site.
With Data Analytics Clients will begin to
expect deeper and broader insights, faster and more efficient delivery, as well as innovative thinking from their auditors.10
How will Data Analytics change the external audit?
Data Analytics will allow external auditors to spend less time looking for evidence and allow more time for presenting their findings and making judgments.
2. How can Data Analytics allow an accountant or auditor to assess the probability of a goodwill write-down, warranty claims, or the collectability of bad debts?
Data Analytics may also allow an accountant or auditor to assess the probability of a goodwill write-down, warranty claims, or the collectability of bad debts based on what customers, investors, and other stakeholders are saying about the company in blogs and in social media. Such information might help the firm determine both its optimal response to the situation and an appropriate adjustment to its financial reporting.
L.O 10-5
Describe how the AMPS Model explains the data analytics process
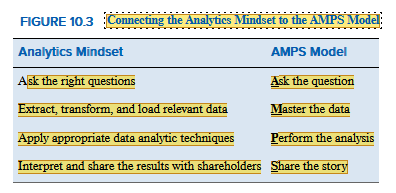
Explain the components of the analytics mindset
- Ask the right questions.
- Extract, transform, and load relevant data.
- Apply appropriate data analytic techniques.
- Interpret and share the results with stakeholders.
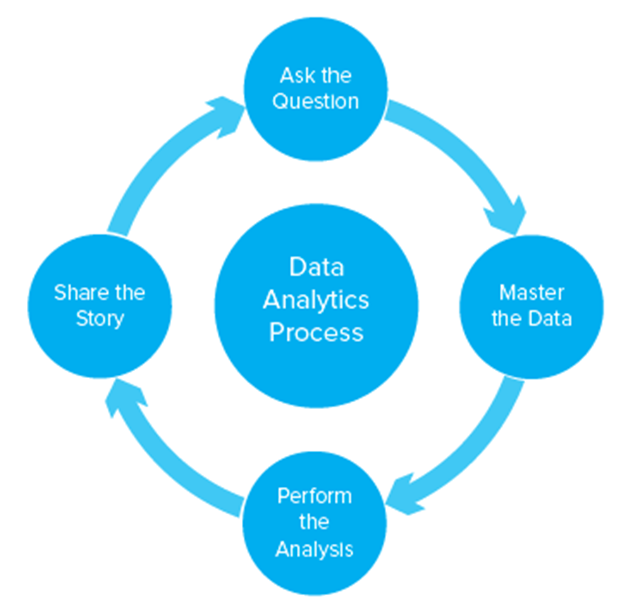
the AMPS model be used as a
framework for the data analytics process. AMPS stands for:
Ask the question
2. Master the data
3. Perform the analysis
4. Share the story
Connecting the Analytics Mindset to the AMPS Model:
AMPS is __ in nature
recursive
Oftentimes, the AMPS model must be performed
multiple times, refining the question (ask the question), possibly considering different types of data (master the data), performing additional analysis (perform the analysis), and retelling the story in each iteration (sharing the story) before the issue/problem/challenge can be finally addressed with some confidence

L.O 10-6 Describe the first stage of the AMPS Model- Asking appropriate Questions
Ask questions that might address a problem the company is facing, such as:
1. Which product is most profitable at stores in Missouri?
2. Is it more profitable to produce an item in the United States or in Mexico (or Indonesia)?
3. How much overhead should we apply to each one of our products?
4. Why are our costs increasing in the West but decreasing in the East?
5. What is the probability that our audit client will go bankrupt or need to restate its financial statements?
6. How will the company respond to the various possible scenarios considered in tax legislation?
7. How will increasing petroleum prices and shipping expenses affect our level in sales to break even?
the more ___ the question, the better.
succinct, Narrowing the scope of the question helps enhance the focus on a specific question.
Given accountants' knowledge of business processes, how information flows through the organization (from customer to order desk to shipping dock to customer), and how and when transactions hit the income statement, accountants can help
management create specific questions to address the heart of the problem, opportunity, or challenge at hand.
T/F: accountants should have a thorough knowledge of an organization's data
True
L.O 10-7 Describe the second stage of the AMPS model-mastering the data.
Data questions include:
•Data Accessibility – can we get the needed data to answer the question posed?
•Data Reliability – is the data clean?
•Data Integrity – is the data accurate, valid and consistent over time?
•Data Type – is the data structured? is the data internal? are there privacy concerns with the data?
Data accessibility
What data will be needed to answer the question? Do we have access to it?
. What is the potential cost of acquiring and processing the data as compared to the potential value provided by use of the data?
Data reliability
Is it clean, reliable data? Does it have lots of missing values? Does it need to be cleaned or transformed in some way before it can be used?
How old is the data? Will it address the question we have now if it is really old data?
Data integrity
Does the data exhibit high levels of data integrity, where data is accurate, valid, and consistent over time? Accountants need to understand the trade-offs between relevant data and reliable data (such as data that might exhibit more representational faithfulness)
Data type
Are there privacy concerns associated with our data? Are we allowed to use it? What would happen if there is a data breach and the data is exposed?
Is the data unstructured, semi-structured, or structured? Does this help determine how we will use it in our analysis?
Is the data internal or externai to the company?
Is the data machine readable? If the data item is stuck in a PDF file, will it be hard to extract and use in our analysis?
Does the data come categorical or numerical? Whereas numerical data has logical order, categorical data has no logical order and can't be easily translated into a numerical value
L.O 10-8 Describe how audit data standards are useful in sharing data between a company and its auditors in preparation for data analysis
If both the audit client and its external auditor agreed on the same data standards to share their data, this cost of ___ could be alleviated
cleaning and formatting the data
The ___ worked to develop Audit Data Standards (ADS).
American Institute of Certified Public Accountants (AICPA)
ADS is
A standard format for data files and fields typically needed to support an external audit in a given financial business process area that was developed by the AICPA; set of standards for data files and fields typically needed to support an external audit in a given financial business process area. These standards also include questionnaires that may need to be considered to ensure that the data to be accessed is a complete and valid population.
the objective of the ADS is to produce data in a standard structure that can then be used consistently across financial audits of most organizations. The potential benefits include the following:
Reduces the time and effort involved in accessing data by:
Providing a precise request of what data is required and the format in which it should be provided.
Reducing the risk that incorrect or incomplete data will be provided by IT.
Reducing the need for an IT specialist to clean or scrub the data.
Potentially having financial reporting systems (such as SAP or Oracle) to output this information directly.
Works well with standard audit and risk analytic tests often run against data sets in specific accounts or groups of accounts (such as inventory or accounts receivable or sales revenue transactions).
Allows software vendors, such as ACL Inc., to produce data extraction programs for given enterprise systems to help facilitate fraud detection and prevention and risk management.
Facilitates testing of the full population of transactions, rather than just a small sample.
Connects/interacts well with XBRL GL Standards
Example of Field Attributes from the ADS General Ledger Table
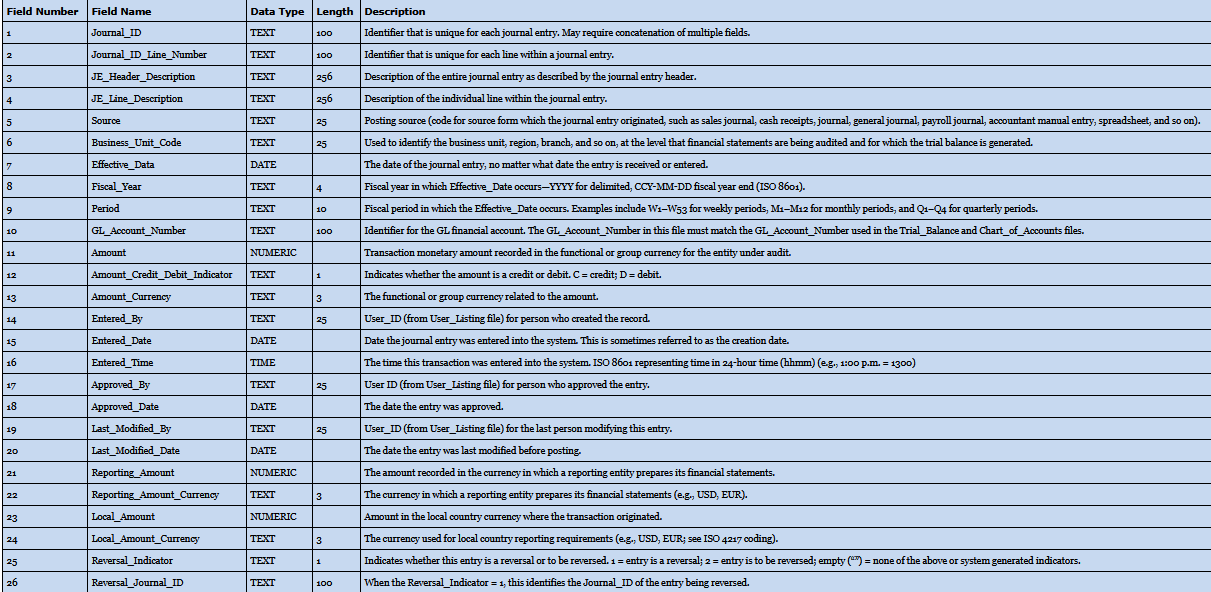
While the actual financial reporting system may vary (e.g., Oracle, Peoplesoft, SAP, etc.), the idea is that they all have the ability to
output a file with these characteristics, which would then be easily imported into an external auditor's software.
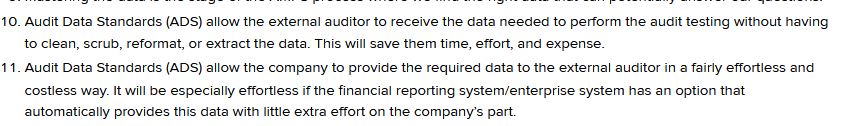
6. Why are the use of audit data standards (ADS) helpful for the external auditor?
7. Why are the use of audit data standards (ADS) helpful for the company being audited?
L.O 10-9 Define and Demonstrate the Third Stage of the AMPS Model- performing analysis
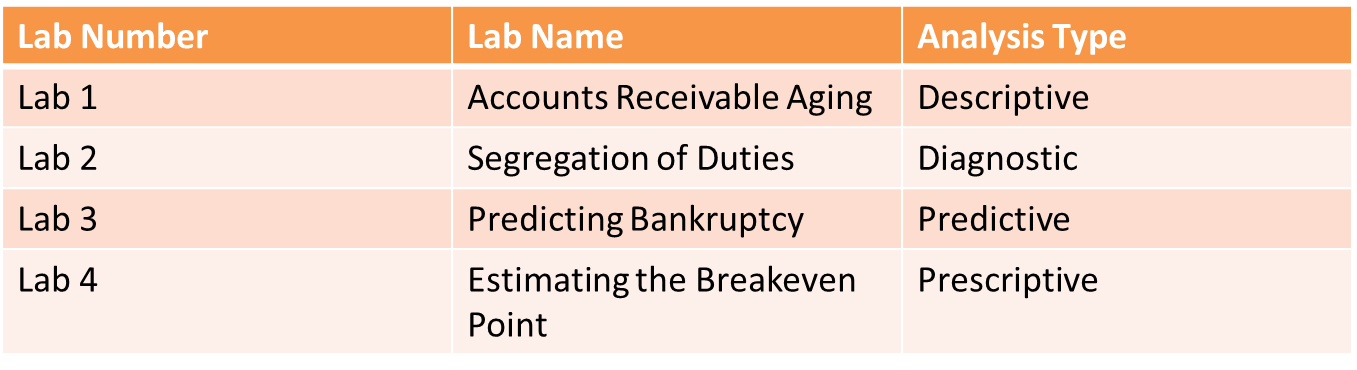
Four Types of Analysis
1) Descriptive
2) Diagnostic
3) Predictive
4) Prescriptive
Descriptive analytics: Addresses questions like
"What happened? What is happening?" We define descriptive analytics as analysis performed that characterizes, summarizes, and organizes features and properties of the data to facilitate understanding
to address questions like:
a. Did we make a profit last year?
b. Did return on assets improve or decline over the past year?
c. Did the airline company's on-time departures improve this past month?
d. How much did we pay in federal taxes last year?
e. How long have the existing accounts receivable been past due?
f. Which product is the most profitable one for the company?
Diagnostic analytics: Addresses questions like
"Why did it happen? What are the root causes of past results?" We define diagnostic analytics as analysis performed to investigate the underlying cause that cannot be answered by simply looking at the descriptive data to address questions like:
a. Why did advertising expense increase, but sales fall?
b. Why did sales, general, and administrative expenses increase relative to the industry?
c. Why did overall tax increase even though net income did not?
d. How did entry and approval of various transactions violate the segregation of duties?
e. Can our variance analysis help explain why the labor expenses increased over the past year?
Predictive analytics: Addresses questions like
"Will it happen in the future? What is the probability something will happen? Is it forecastable?"
We define predictive analytics as analysis performed to provide foresight by identifying patterns in historical data by judging likelthood or probability to address questions like:
a. What is the chance the company will go bankrupt?
b. Do we extend credit or not to customers based on customer background (credit score, employment record, existing debt)?
c. Can the IRS find those individuals or corporations evading taxes using predictive techniques?
d. Can we predict if or when the financial statements might be misstated?
Prescriptive analytics: Addresses questions like
"What shoutd we do based on what we expect will happen? How do we optimize our performance based on potential constraints?" We define prescriptive analytics as analysis performed that identifies best possible options given constraints or changing conditions to address questions like:
a. If we have all 12/31 year-end audit clients, how will we organize our audit work in the new year?
b. How can revenues be maximized (or costs be minimized) if there is a trade war with China?
c. What is the level of sales that will allow us to break even?
d. Should the company rent or lease their headquarters office building?
e. Should the company make its products or outsource to other producers?
Share the Story
communicating the findings to the decision maker
Data Analytics Labs
Questions: According to estimates considered in the chapter, up to what percentage of a data analyst's time is spent cleaning (or scrubbing) the data to be ready for analysis?
90%
Big Data is often described by the 4 Vs, or:
volume, velocity, veracity, and variety.
The acronym ETL, in the process of readying data for use in data analysis, refers to what three words?
Extract, transform, and load
Which term is used to desribe the science of examining raw data, removing excess noise from the dataset, and organizing the data with the purpose of drawing conclusions for decision making
data analytics.
ADS is a standard format for data files and fields typically needed to support an external audit in a given financial business process area that was developed by the AICPA. The acronym ADS stands for what three words?
Audit Data Standards
Which type of question does prescriptive analysis address?
What should we do based on what we expect will happen?
Which type of question does descriptive analysis address?
What happened?
What type of analysis addresses questions of "Why did it happen"
Diagnostic analysis
What type of analysis would address the question of whether a customer will ultimately pay if credit is granted?
Predictive analysis
If we wanted to know what grade we needed to get on the final in this class based on our expected performance before the final, we would call that _______ analysis.
Prescriptive analytics
Match these definition with either of the four Vs to describe Big Data:
1. Unstructured and unprocessed data, such as comments in social media, emails, global positioning system measurements, etc.
2. The massive amount of streaming data involved
3. Data coming in at fast speeds or in real time, such as streaming videos or news feeds
4. Opinions or facts
5. Data with a lot of missing observations
6. Stock market data that updates every 5 seconds
7. Financial statement data that appears in tables
8. All Twitter data from 2021
1. Unstructured and unprocessed data, such as comments in social media, emails, global positioning system measurements, etc. - Variety
2. The massive amount of streaming data involved - Volume
3. Data coming in at fast speeds or in real time, such as streaming videos or news feeds - Velocity
4. Opinions or facts - Veracity
5. Data with a lot of missing observations - Veracity
6. Stock market data that updates every 5 seconds - Velocity
7. Financial statement data that appears in tables - Variety
8. All Twitter data from 2021 - Volume
Data Analytics can be disaggregated into four steps as part of the AMPS. Which of these AMPS processes would be considered mastering the data [or ETL (extract, transform, and load)] or performing the analysis?
a. Removing extraneous data and noise.
b. Looking for trends in the data that might predict new sales opportunities.
c. Finding the necessary data from the financial reporting system to give to the external auditor for analysis.
d. Performing test of internal controls by the external auditor.
e. Considering Champaign, Illinois, weather patterns to predict corn production in the immediate area.
f. Consolidating large volumes of data from multiple sources and platforms.
a. Removing extraneous data and noise. - ETL
b. Looking for trends in the data that might predict new sales opportunities. - Analysis
c. Finding the necessary data from the financial reporting system to give to the external auditor for analysis. - ETL
d. Performing test of internal controls by the external auditor. - Analysis
e. Considering Champaign, Illinois, weather patterns to predict corn production in the immediate area. - Analysis
f. Consolidating large volumes of data from multiple sources and platforms. - ETL