Ib 432 exam 2
1/96
There's no tags or description
Looks like no tags are added yet.
Name | Mastery | Learn | Test | Matching | Spaced | Call with Kai |
|---|
No analytics yet
Send a link to your students to track their progress
97 Terms
intraspecies interactions
influences of others’ behavior on gene expression
ex:
microbiome
parasites
holobiont theory
An organism is a community of the host plus all its microbes (helpful & harmful) living together as one ecological unit
hologenome
combined genetic material of the host organism plus all of its associated microbes
extended phenotype
the effect of a gene extends beyond the phenotype of the organism whose genome it belongs in to affect the phenotypes of others as well as the environment surrounding it
ex: beavers and dams
host manipulation
when a parasite or pathogen changes the phenotype of its host in a way that benefits the parasite/pathogen, but not the host
ex: toxoplasmosis in mice
mice lose fear of predators (cats)
tox needs mouse to get eaten to move onto its next host in its life cycle
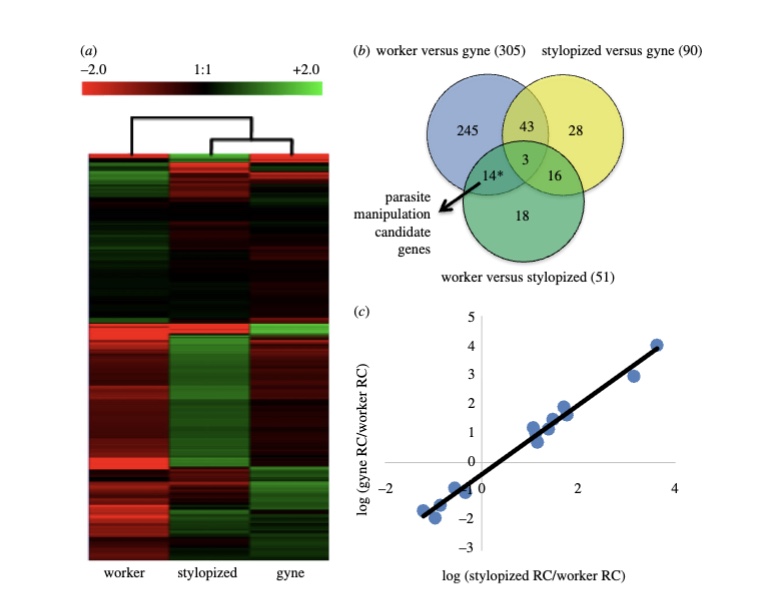
Geffre fig 2
Overall: shows that the brain activity of infected wasps is much more similar to queen wasps (gynes) than to the worker wasps they were supposed to be
Panel A: Heatmap showing the differential expression patterns for each group
red= downregulated
green= upregulated
Panel B: Venn diagram of the DETs in pairwise comparison groups
largest gene expression differences based on social caste (worker vs gyne)
14 candidate genes identified related to caste differences
panel C: comparison of the read count ratios for the 14 overlapping DETs between S/W and G/W
high correlation, R²= 0.9831
shows similarity between stylopized (parasitized) and gyne gene expression
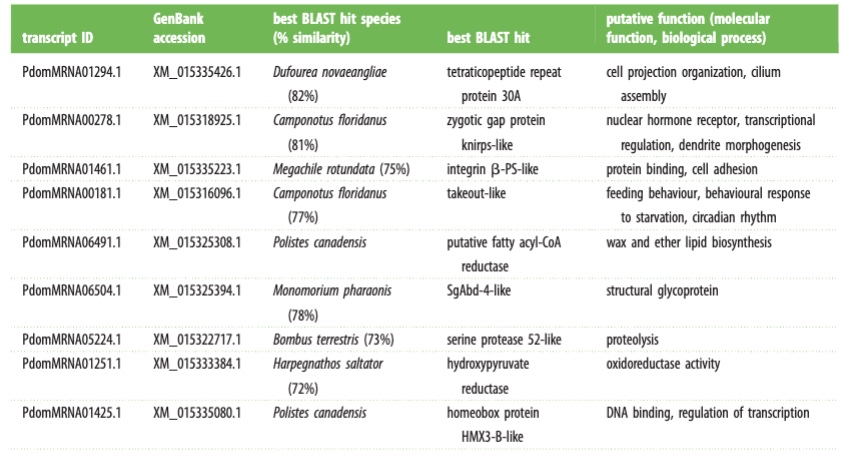
Geffre Table 1
The table identifies 9 key genes (and mentions 5 others with unknown roles) that the parasite likely targets to change the wasp's behavior. These genes are responsible for important functions like controlling feeding behavior (the "Takeout-like" gene), regulating biological clocks, and managing how the brain responds to starvation. By shifting these specific genes, the parasite makes a worker wasp's brain function more like a queen's brain.
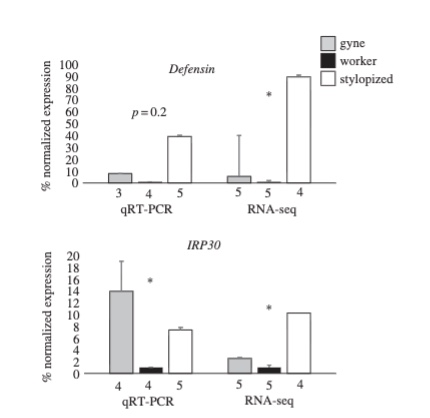
Geffre fig 3
compares the results of qRT-PCR and RNA-sequencing for Defensin and IRP30
% normalized expression is percent gene expression changed compared to worker
bottom number gives sample size
suggests the immune systems of wasps are stimulated during stylopization
molecular epigenetics
stable, potentially long-term changes in the activity of a gene that do not require a change in DNA sequence
can be inherited across cell divisions
reversible
some may persist through meiosis→ inherited across generations
epigenetic mark: DNA methylation
addition of methyl groups to DNA (usually at C bases)
make DNA less expressed
accomplished by DNA methyltransferase (DNMT)
epigenetic mark: histone modifications
addition of acetyl or methyl groups to histones
affect how tightly wound DNA is around histones (how accessible it is to transcription)
accomplished by histone acetyltransferase (HAT) and histone deactylases (HDAC)
how might “bad mothering” be adaptive?
beneficial and adaptive response to stress
if environment unpredictable and stressful, mother will be less present→ offspring will grow up to be more vigilant, ready to respond to stress
phenotypic responses of offspring with low LG-ABN (licking-grooming and arched back nursing) mothers
have a harder time calming down after stress
more anxious
reduced learning abilities
become low LG-ABN to own offspring once they become mothers
what is the hypothalamic-pituitary-adrenal axis (HPA)
controls fight or flight response, stress causes release of cortisol by adrenal glands
cortisol travels through blood and binds to the glucocorticoid receptors (GR) in hippocampus (more GRs= more rapid calming after stress)
molecular differences in offspring of low LG-ABN mothers
Offspring of low LG-ABN mothers have more DNA methylation and less histone acetylation on the glucocorticoid receptor (GR) gene, causing less GR expression. With fewer receptors to bind cortisol after stress, they have a harder time calming down after a stress response
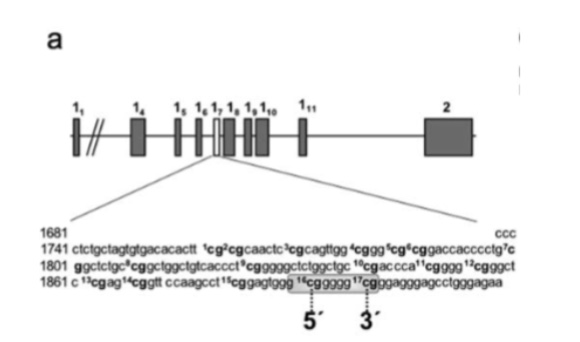
Weaver fig 1a
shows differences in methylation at the 17 different CPG sites… shows that the GR promotor has lots of methylation sites
Weaver fig 1c
low LG/ABN= high methylation
high LG/ABN= low methylation
after adding methionine:
low LG/ABN= remains high methylation
high LG/ABN= higher methylation than before
not picture 1b, but it shows same pattern but across the many CpGs
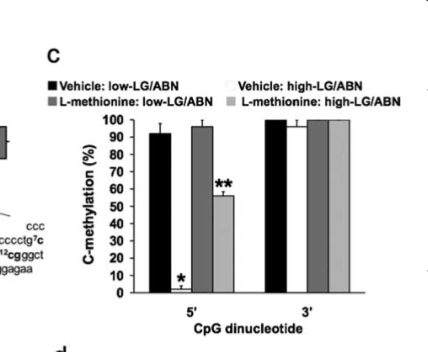
Weaver fig 1d
the data shows that the methionine injection physically blocked a "calmness" protein from sticking to the DNA. Because this protein can no longer attach, the gene that controls stress stays "off," making the rat more anxious
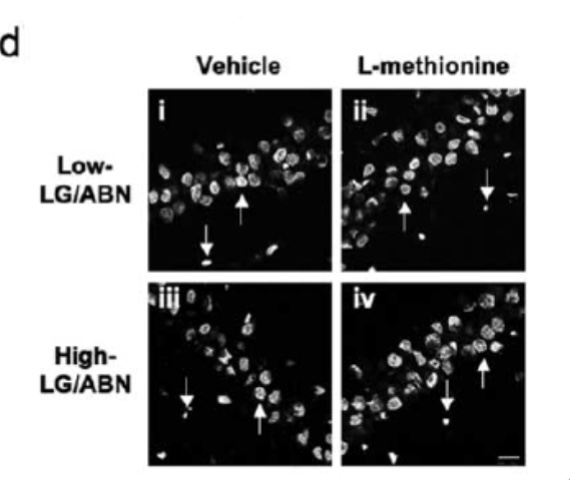
Weaver fig 2
There's a protein called NGFI-A that acts like an "on" switch — it physically attaches to the stress gene and helps turn it on. Offspring of attentive mothers had lots of NGFI-A attached. After methionine treatment, that protein could no longer bind — the newly added DNA "off" switches physically blocked it. Importantly, the histone acetylation (another layer of gene regulation, like how tightly DNA is wound) was not changed by methionine — so this was a very specific, targeted effect
molar epigenetics
focuses on the whole organism level
environmentally induced, stable long-term change in phenotype (sometimes be stable across generations)
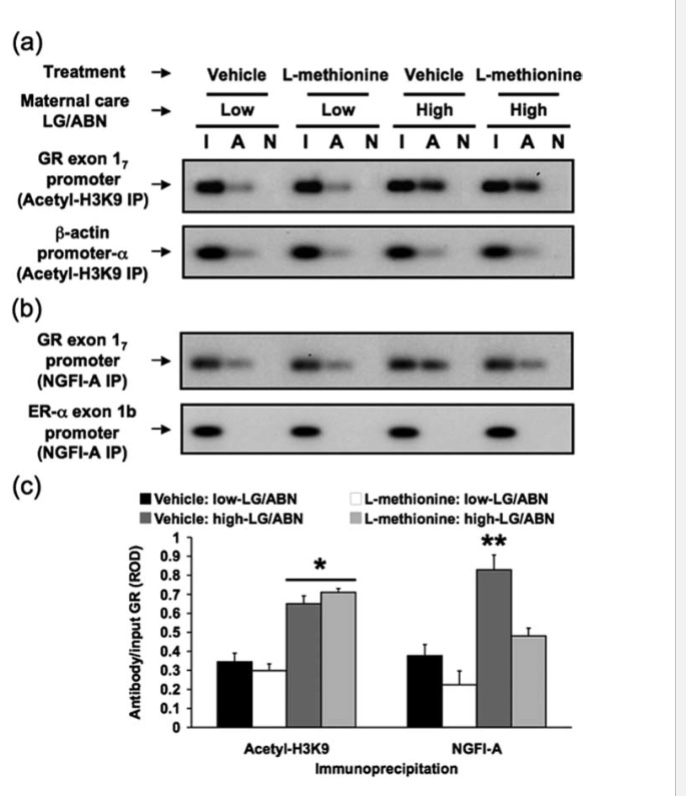
weaver fig 3
Panels a & b show that after methionine treatment, offspring of attentive mothers produced less mRNA from the glucocorticoid receptor (GR) gene — meaning the gene was being read less often.
Panels c & d confirm that actual GR protein levels also dropped — the attentive-mother offspring now looked biochemically like neglected-mother offspring.
Panel e shows the real-world consequence: when stressed, the methionine-treated attentive-mother rats now pumped out much more corticosterone (the rat stress hormone), just like neglected-mother rats normally do. Their biological "calm down" feedback system had been weakened.
epialleles
different versions of the same DNA sequence that differ in their epigenetic marks (ex: methylated, unmethylated)
induced by environment NOT mutation
can be reversible
epigenetic transgenerational inheritance
when epialleles are passed down from one generation to the next
opens up possibility for epigenetic driven phenotypic evolution
inducing environment
acute environmental change that led to the epigenetic change
selecting environment
long-term environment that persists across generations, allowing for natural selection and evolution to occur (epigenetic change most likely to persist if selecting environment is the same as the inducing environment)
what happens when a male cichlid ascends?
In 2-10 minutes:
more aggressive
more colorful
in 20 minutes:
release of GnRH
increase in IEG expression (egr-1)
more gradual:
growth rate increases initially, then decreases
what is zebularine?
cytidine-like molecule that blocks DNA methyltransferases (DNMTs) by binding tightly to them. This prevents DNA methylation, often causing the opposite effect of methylation (more gene expression)
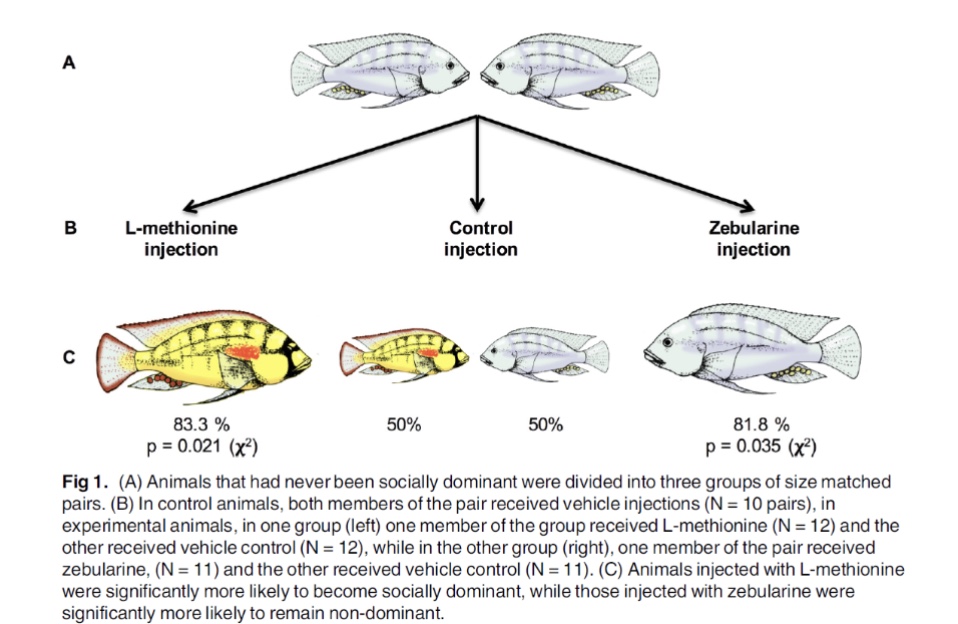
Lenkov figure 1
83.3% of fish injected with L-methionine became dominant
In pairs where both fish received vehicle injections, there was a 50/50 split in who became dominant
81.8% of fish injected with zebularine (methylation inhibitor) remained non-dominant
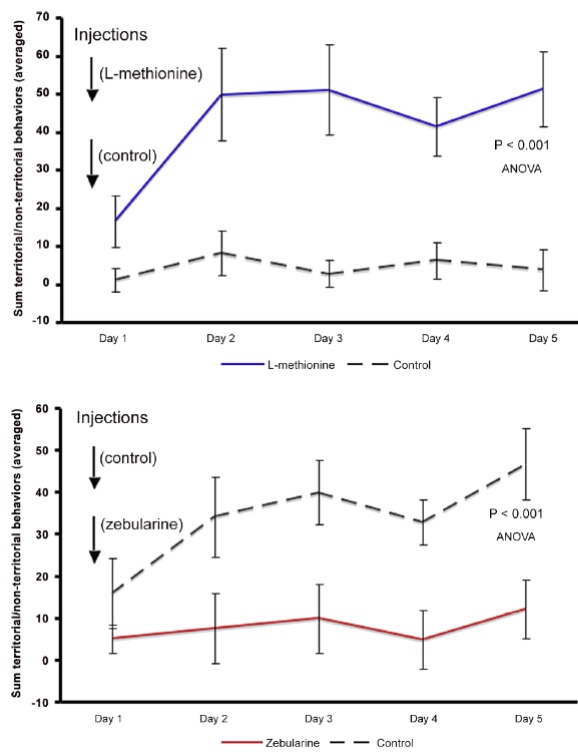
Lenkov fig 2
Fish injected with L-methionine displayed dominant behaviors starting on day 1 and maintained them through day 5
Fish injected with zebularine stayed consistently low in territorial acts (non-dominant)
There was a significant difference (P < 0.001) between the treated fish and the others
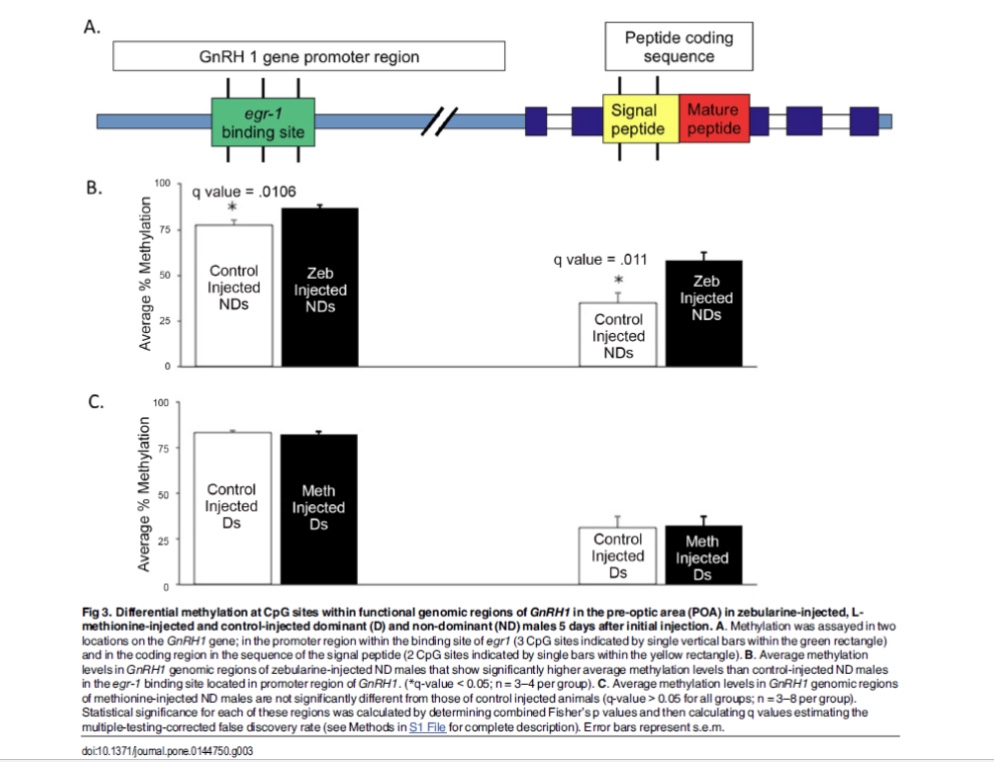
Lenkov fig 3
Panel A is a map of the GnRH1 gene showing the two spots they measured. -
Panel B shows that zebularine-treated (non-dominant) fish had more methylation at the GnRH1 "on switch" — locking the gene off, consistent with not becoming reproductively active.
Panel C shows methionine-treated fish had no change at GnRH1, suggesting methionine worked through other genes instead
What is the “Neo-Lamarckian” view of evolution? (Skinner)
the environment can directly alter an organism's traits, and those alterations can be passed down to future generations — even without any change to the underlying DNA sequence (epigenetic changes)
Neo-Darwinian evolution
genetic mutations promote phenotypic variation on which natural selection acts
unified evolution theory (Skinner)
environmental epigenetic alterations promote genetic mutations to alter genotype variation
environmental epigenetics and genetic mutations both promote phenotypic variation on which natural selection acts on
G X E interactions vs phenotypic plasticity
can overlap, phenotypic plasticity can be a part of a GxE interation
Plasticity = within one genotype, how much it can change
G × E = between genotypes, differences in how they respond to the environment
instinctive behavior
innate behavior that cannot be modified by environment
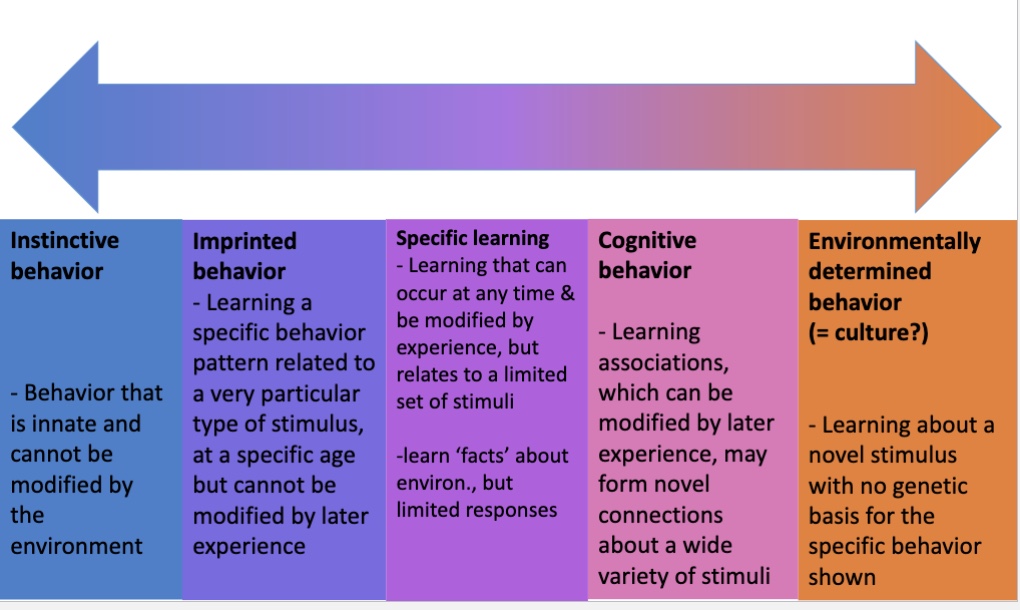
imprinted behavior
learning a specific behavior pattern related to a particular type of stimulus at a specific age, cannot be modified by later experience

specific learning
Learning that can occur at any time & be modified by experience, but relates to a limited set of stimuli

cognitive behavior
learning associations which can be modified by later experience, may form novel connections about a wide variety of stimuli

environmentally determined behavior
learning about a novel stimuls with no genetic basis for the specific behavior shown

G X E interaction
when the phenotypic effect of a gene varies in a non-additive way depending on the environment in which it is expressed
ex: gene that affects fat storage capacity
allele A: low fat storage, allele B: high fat storage
storing more fat (allele B) will not become apparent unless some environmental stimulus is present (lots of high calorie food)
endophenotypes
Smaller, measurable parts of a larger trait (like behavior) that are easier to study (impulsivity, aggression, etc)
DRD4
activated by binding of dopamine
linked to schizophrenia, EDs, addiction, ADHD, novelty seeking
some variants bind less tightly to dopamine, so they are less activated by dopamine (need more dopamine for the same “kick”)
7R variant: lower binding
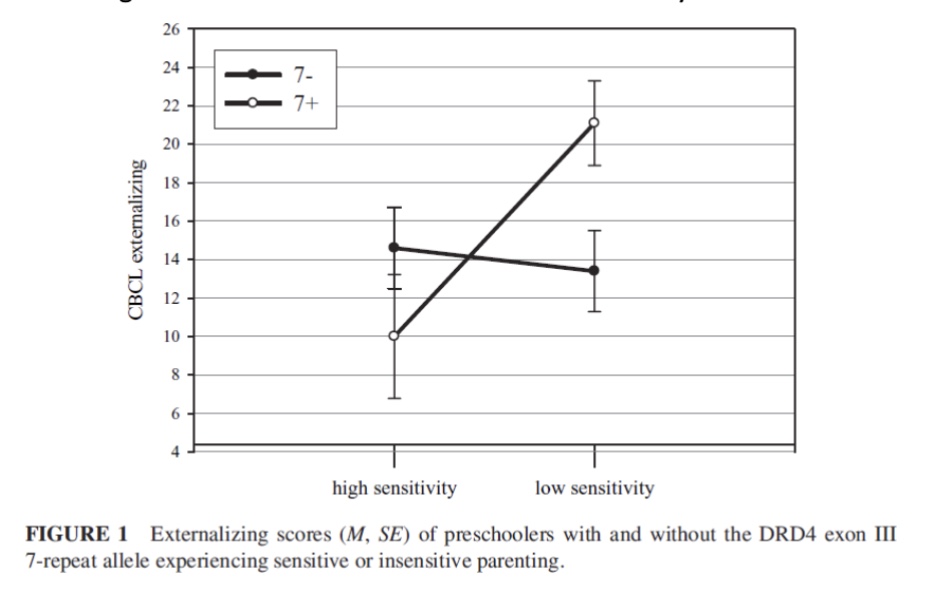
Bakermans fig 1
children with the 7-repeat allele show low externalizing behaviors with mothers who show high sensitivity, but show high externalizing behaviors with mothers who show low sensitivity
children without the 7-repeat allele show relatively the same externalizing behaviors with both high and low sensitivity mothers
Why is there variation in DRD4 alleles and associated behaviors? (evolutionary perspective)
novelty seeking, reduced sensitivity for novel stimuli
increased activity levels
associated with increased migration distances
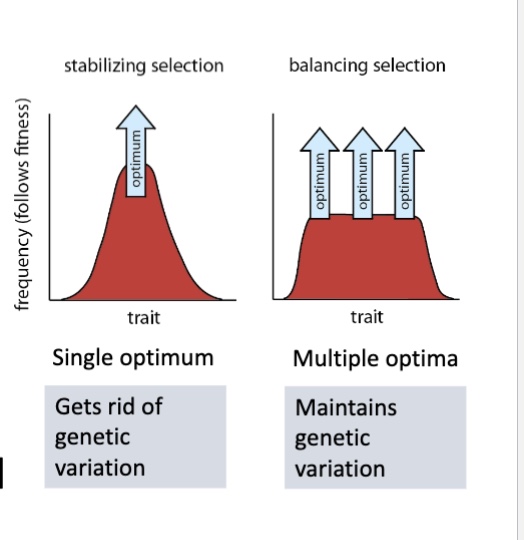
balancing selection
when multiple alleles are maintained in a population… may have equal fitness
what is the microbiome
collection of genomes of microorganisms in a system
bacteria
archea
fungi
viruses
etc
what is the microbiota?
collection of microorganisms in a system
Holobiont evidence
eucalyptus digestion in koalas (usually toxic, microbiota acts to detoxify)
The gut as a second brain
largest microbial organ in humans
100 million neurons (2nd to brain)
contains its own intrinsic enteric nervous system
what do microbiota do?
digestion and metabolism
barrier protection and defense
immune function
systemic metabolic and hormone regulation
neuroactive signaling through gut-brain axis
the gut-brain axis
gut and brain are in constant conversation via nerves, hormones, and the trillions of bacteria living in your gut (the microbiome). This is why stress can give you a stomachache, but also why an unhealthy gut can affect your mood, anxiety, and even cognition — the relationship runs both directions
The gut microbiota-brain axis in disease - ASD (Svoboda, 2020)
linked to gastrointestinal dysfunctions→ positive correlation between the severity of behavioral and gastrointestinal symptoms
Children given microbes from non-ASD donors showed 47% reduction in autism- like behaviors than before administration
increased interest in people after receiving microbiome transplant
ASD patients have different microbiomes than non-ASD children
HOWEVER, since individuals with ASD often have selective eating patterns, these dietary preferences can change gut microbial diversity independently of ASD itself, complicating interpretations
human studies are correlative, animal ones are more causative, but mice and rats don’t have ASD
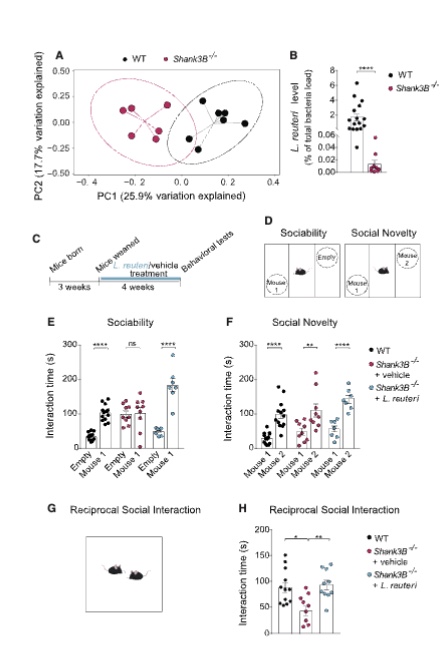
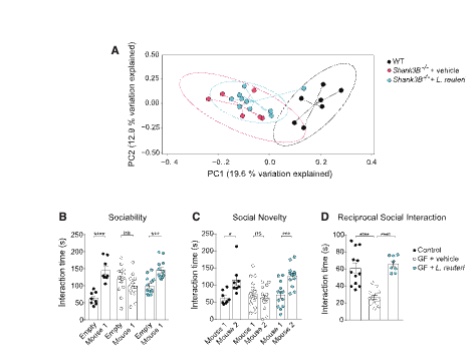
Sgritta fig 1
mice (Shank3B⁻/⁻) have a gene mutation linked to autism and naturally show less interest in socializing with other mice. The researchers first confirmed these mice also had an altered gut microbiome with lower levels of L. reuteri. They then gave the mice L. reuteri in their drinking water for 4 weeks. treated mice started preferring to interact with a stranger mouse over an empty cup (normal sociability), and spent more time interacting with unfamiliar mice one-on-one. Untreated mutant mice did neither.
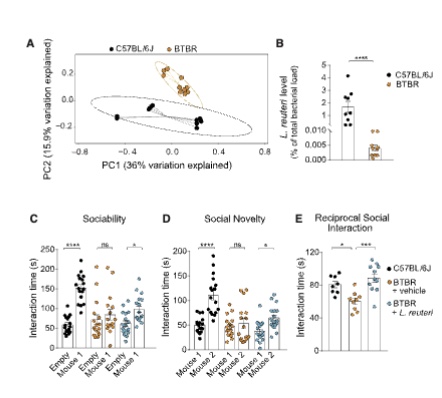
Sgritta fig 2
BTBR mice, a naturally occurring strain that behaves in an autism-like way for unknown genetic reasons. their gut microbiome was altered and L. reuteri levels were low. Treating them with L. reuteri rescued their sociability, social novelty preference, and one-on-one social interaction, bringing them back to normal levels
Sgritta fig 3
giving L. reuteri to the ASD mice didn't actually fix or restore their overall gut microbiome composition — yet it still fixed their behavior. This means the probiotic isn't working by rebalancing the whole gut ecosystem. Second, even germ-free mice — raised in sterile conditions with absolutely no gut bacteria at all — showed social deficits, and colonizing them with L. reuteri alone was enough to restore normal social behavior. This proves L. reuteri is acting directly, not through interactions with other bacteria.
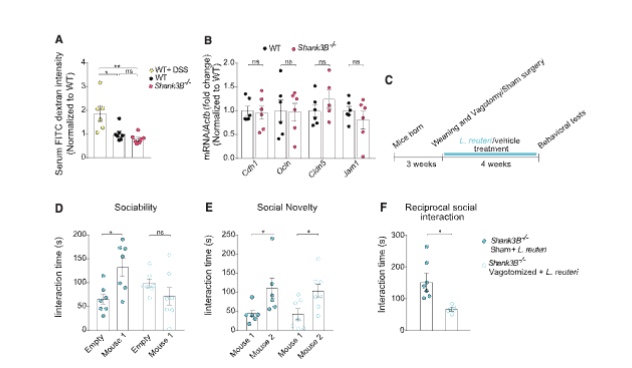
Sgritta fig 4
The vagus nerve is the main physical cable running from the gut to the brain. To test whether it was the communication route, the researchers surgically cut the vagus nerve in some mice (vagotomy) while leaving it intact in others (sham surgery). L. reuteri successfully rescued social behavior in mice with intact vagus nerves, but completely failed to work in mice whose vagus nerves were cut. The gut was also confirmed to not be "leaky" in these mice, ruling out bacteria or chemicals entering the bloodstream as the communication route.
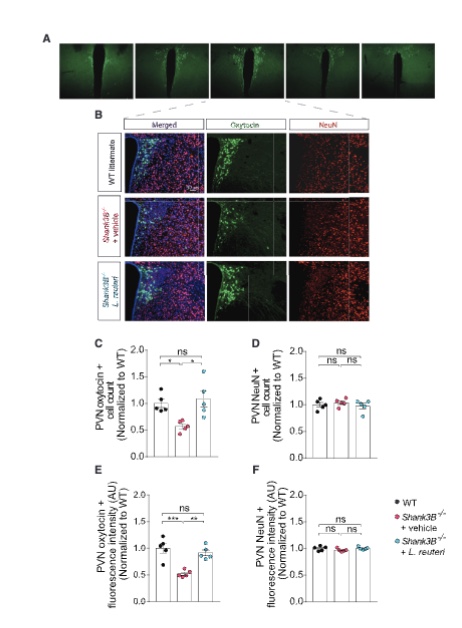
Sgritta fig 5
Oxytocin is often called the "bonding hormone" and is crucial for social behavior. The researchers looked at the brain region (PVN of the hypothalamus) where oxytocin is produced and found that ASD mice had significantly fewer oxytocin-producing neurons and lower oxytocin levels. After L. reuteri treatment, both the number of oxytocin neurons and their activity bounced back to normal levels. Importantly, the total number of neurons didn't change — it was specifically the oxytocin neurons that recovered.
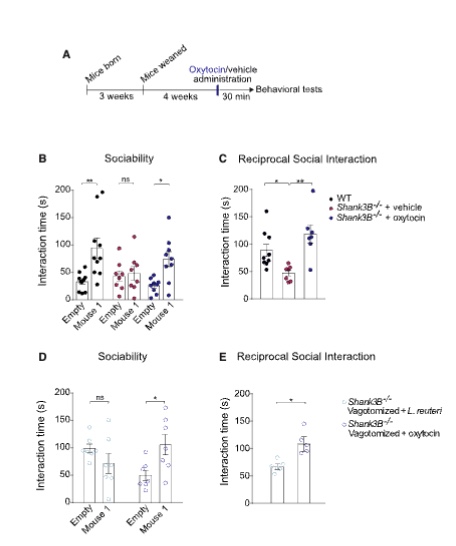
Sgritta fig 6
When researchers gave oxytocin directly through the nose (bypassing the gut-brain axis entirely), it rescued social behavior in the ASD mice — just like L. reuteri did. Critically, intranasal oxytocin also worked in mice whose vagus nerves had been cut, confirming that the vagus nerve is specifically needed for L. reuteri to work, but once oxytocin is delivered directly to the brain, the vagus nerve is no longer needed.
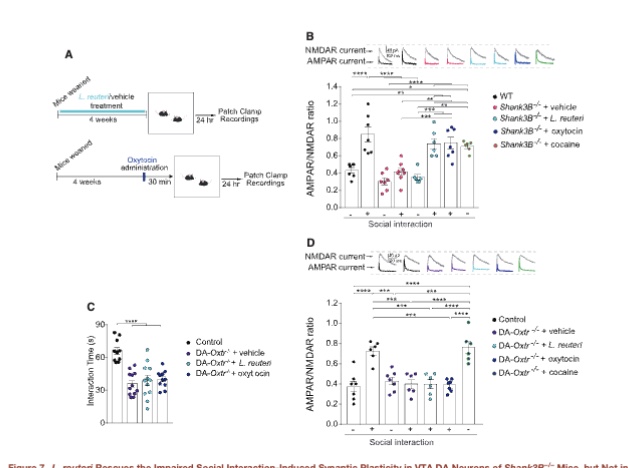
Sgritta fig 7
In normal mice, having a positive social interaction physically strengthens synapses (connections between neurons) in the brain's reward center (the VTA — ventral tegmental area). This is called long-term potentiation (LTP) and essentially means the brain "rewards" social interaction. In ASD mice, this synaptic strengthening after social interaction was completely absent — socializing didn't trigger the reward response. After L. reuteri treatment, the reward response was restored. But — and this is key — when oxytocin receptors were genetically deleted from dopamine neurons in the reward center (DA-Oxtr⁻/⁻ mice), neither L. reuteri nor oxytocin could fix the social deficits or restore the reward response. This proves oxytocin signaling in the reward circuit is the essential final step through which the probiotic works.
vasopressin
male sociosexual behavior (mating, aggression, territoriality, pair bonding)
just having vasopressin doesn’t make a male monogamous, vasopressin receptor expression is needed as well as dopamine
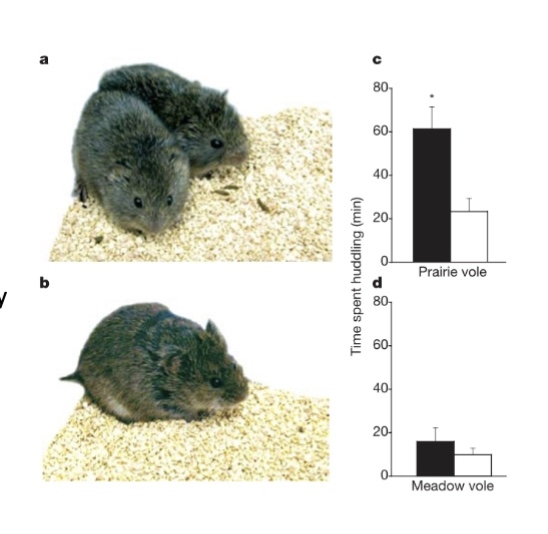
Lim fig 1 a-d
a. prairie voles show more huddling side by side
b. meadow voles are more solitary
c. prairie voles tend to spend significantly more time with their partner
d. meadow voles do not form strong bond with partners, spending relatively little time huddling
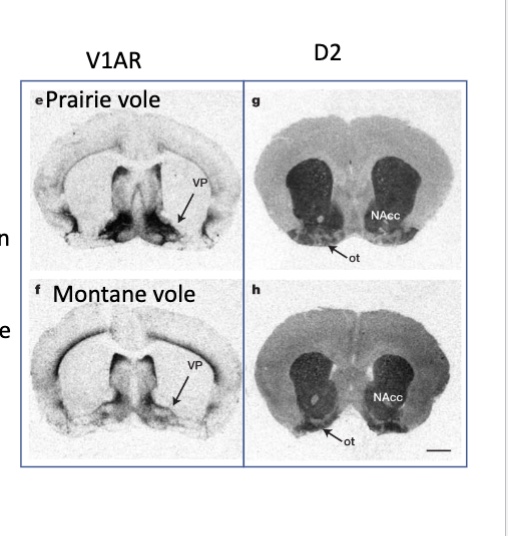
Lim fig 1 e-h
e. prairie vole V1aR receptors expression in the VP
f. meadow vole V1aR receptors expression in VP
g. expression of D2 receptors in prairie vole
h. expression of D2 receptors in meadow vole
observable differences in V1aR, but D2 receptor distribution is relatively similar between both vole species
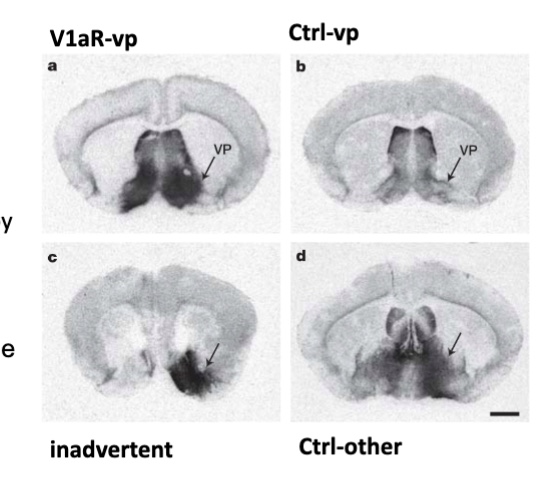
Lim fig 2
a. meadow vole overexpressing the V1aR gene in the VP by AAV-mediated gene transfer (looks like a prairie vole brain)
b. meadow vole infused with the AAV control vector expressing the lacZ gene into the VP
c. stereotactic injection inadvertently placed to rostral to the VP (ventral to the nucleus accumbens)
d. stereotactic injection too caudal to VP, ventral to fornix
AAV works at creating V1aR expression in the VP
Lim fig 3
a. experimental group spend significantly more time huddling with the partner than the stranger
b. experimental group preferred to be with their partner nearly 100% of the time
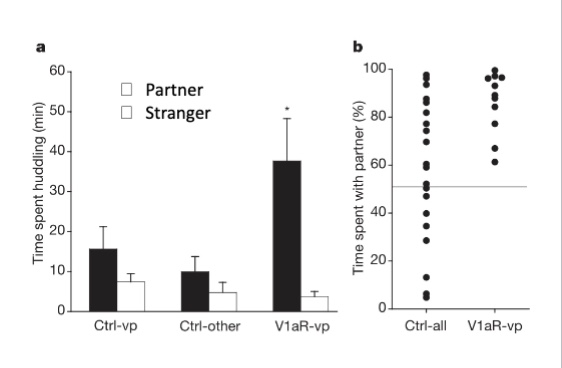
Lim fig 4
a. after being pretreated with eticlopride (a D2 receptor blocker), the experimental V1aR-vp meadow voles no longer spend significantly more time huddling with their partner compared to a stranger. The huddling behavior of the Ctrl-vp and Ctrl-other groups remained unchanged by the drug, as they already lacked a partner preference
b. the percentage of time each individual animal spent with its partner, showing that the V1aR-vp group's distribution shifted back to the random levels seen in control animals.
forward genetics
behavior→ gene
identifies genes associated with a particular phenotype
reverse genetics
gene→ behavior
analyze the phenotype of an organism after disrupting some genes
genetic architecture
genotype-phenotype map
how many genes affect a phenotype, and how strong their effects are
QTL analysis
locate general locations on chromosomes for genes affecting the trait
need a set of known markers to anchor positions on the chromosomes
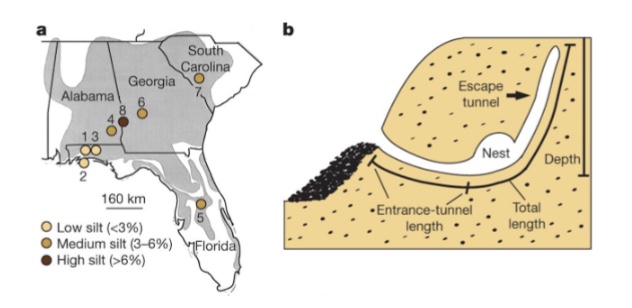
Weber fig 1 a-b
a. general territory of the beach mouse (P. polionotus) and soil sample locations and compositions
b. general structure of P. polionotus burrow. shows the parts that were measured (entrance length and depth)
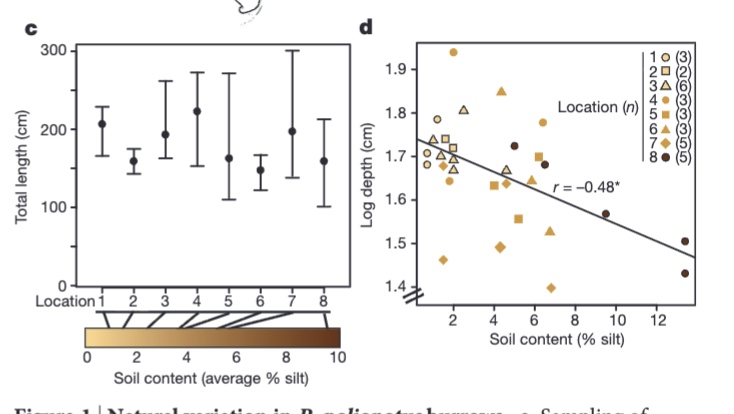
Weber fig 1 c-d
c. entrance lengths were measured across different soil compositions and no significant differences were found across the different sample sites for P. polionotus
d. found a negative correlation between soil composition and burrow depth (deeper the burrow, longer the tunnel)
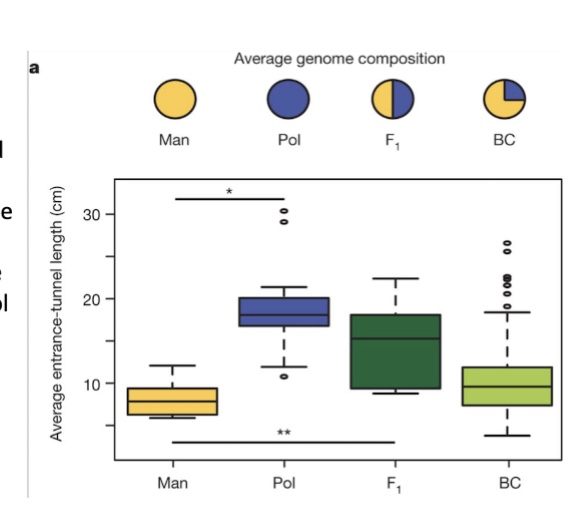
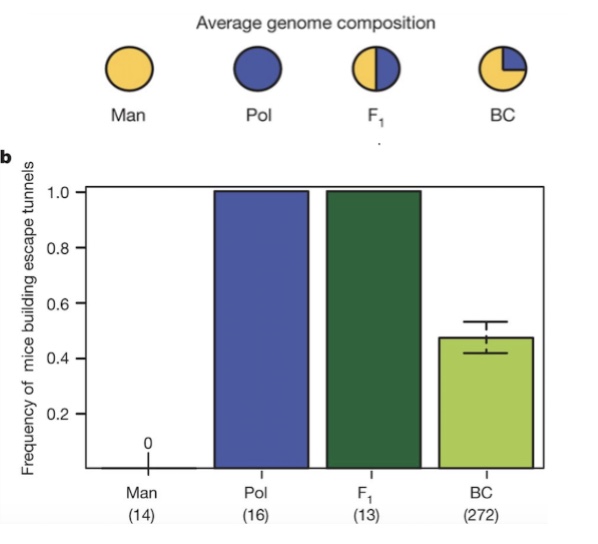
Weber fig 2A
general compositions of mice shown at the top
there is a significant difference between man (deer) and pol (beach) entrance tunnel lengths
Pol and F1 had the same tunnel lengths
BC (F1 x Man) mice ranged between the two extremes of Man and Pol
Weber fig 2B
half of the BC mice display escape tunnels
points to only being controlled by one gene locus
no link between the presence of an escape tunnel and length of the entrance tunnel
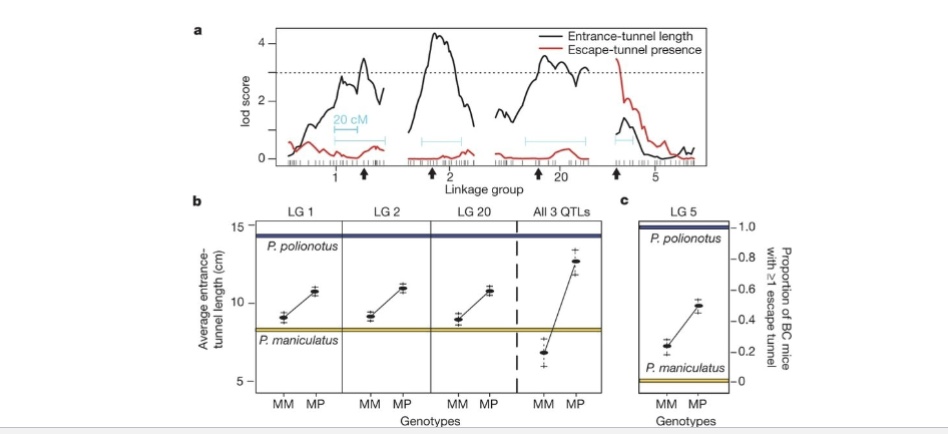
Weber fig 3
a. 3 QTLs associated with entrance length and 1 QTL associated with escape tunnel presence crossed the significance threshold
b. each QTL (linkage group=LG) contributes to about 3cm of length for the entrance tunnel. BC mice with the Pol allele for escape tunnels were 30% more likely to make one
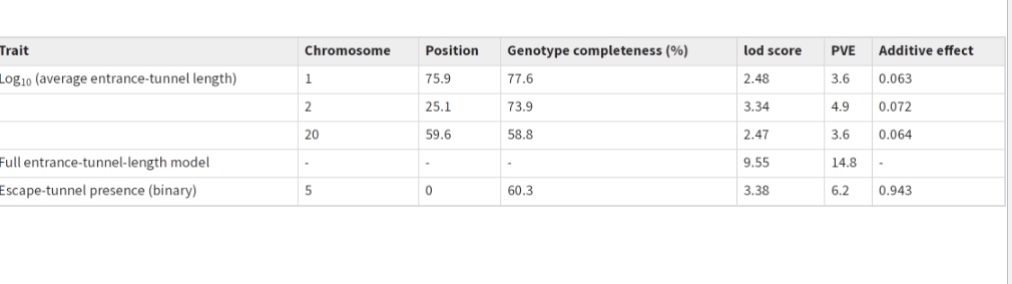
Weber table 1
variance in entrance tunnel length has genetic component of 24%
more than half of the variance explained by the 3 QTLs found
QTL for escape tunnels only accounted for 6% of variance
modularity
the degree to which subunits or segments of a whole can be separated and recombined
personality
consistent, long term behavioral difference between individuals
behavioral syndrome
consistent and/or correlated behavior across two or more situations
Why do personalities/behavioral syndromes exist? Why aren’t individual animals optimally flexible in their behavior?
genetic correlation (pleiotropy): one gene can influence several traits… selection on one behavior may result in suboptimal responses in another, correlated behavior
balancing selection: variation is maintained due to multiple optima… different variants favored in different environments within a population
genetics of human personality
Personality is moderately heritable (~35–50%), but single genes usually have very small effects (~5% or less). This shows personality is polygenic, influenced by many genes plus epigenetic and gene × environment effects shaped by life experiences.
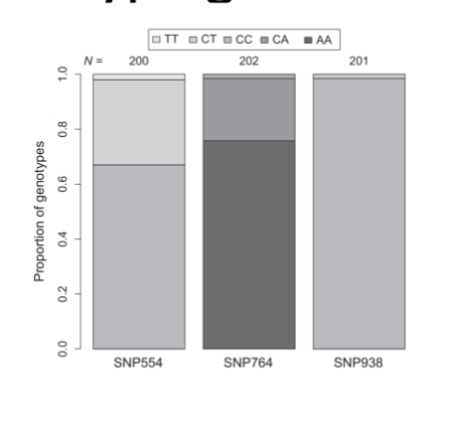
Garamszegi fig 1
SNP genotyped for 3 distinct SNPs on the DRD4 gene in flycatchers
good variation in 554 and 764, but none in SNP 938
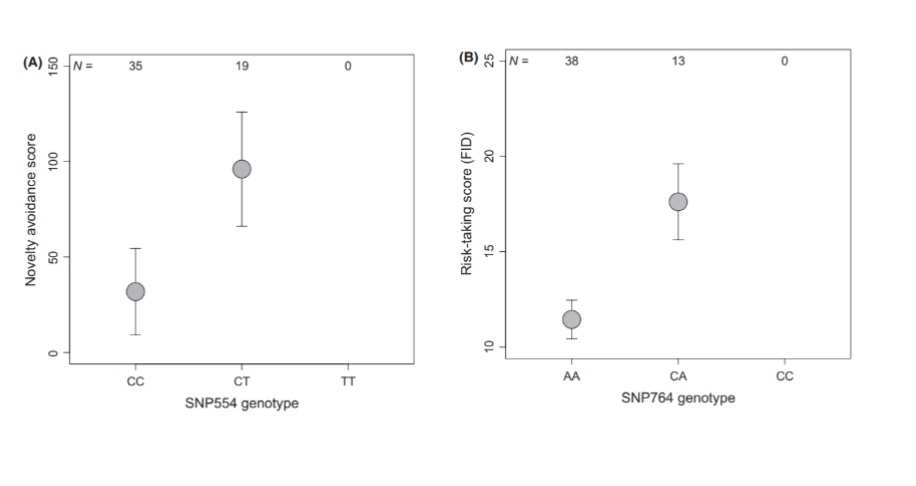
Garamszegi fig 2
the CT genotype on SNP 554 shows a higher novelty avoidance score (takes longer for bird to land on the nest when a new object is present)
the CA genotype on SNP764 shows a higher risk-taking score
the rare TT genotype on SNP554 and CC genotype on SNP764 were not represented
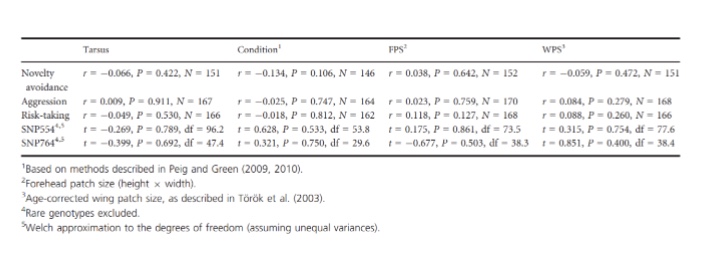
Garamszegi table 1
tested whether the response variables and the DRD4 gene had any correlation to male size, body condition, forehead patch size or wing patch size… there was no correlation
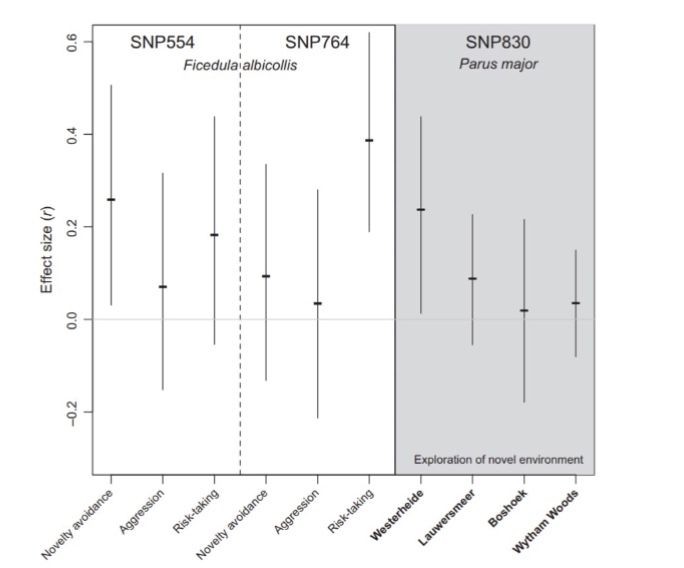
Garamszegi fig 3
a small-medium effect size is shown for the studied behavioral traits in flycatchers
the parus major, the relationship between DRD4 polymorphism and exploration behavior varies by location
exploration inverse of novelty avoidance
correlated to risk-taking and aggression
effect sizes in the parus major study overlap with the flycatcher study
Evolution of sexual preference/variation: hypotheses for humans
neutrality: sexual variation is ancestral and not selected against if it doesn’t strongly impact fitness
pleiotropy/genetic correlation: homosezuality is linked to other traits that are beneficial/adaptive
sexual antagonistic pleiotropy: pleiotropic genes have seemingly opposite
byproduct: homosexuality is a nonadaptive result of some developmental factor
Maternal immune hypothesis
mother produces antibodies to proteins from Y chromosome genes produced by their male fetuses
more antibodies produced with each subsequent male pregnancy
antibodies cross placenta and enter developing fetal brain
antibodies block Y-produced proteins involved in fetus’ brain development
gay uncle hypothesis/ kin selection
selection for traits that increase fitness to one’s relatives, even at cost to self
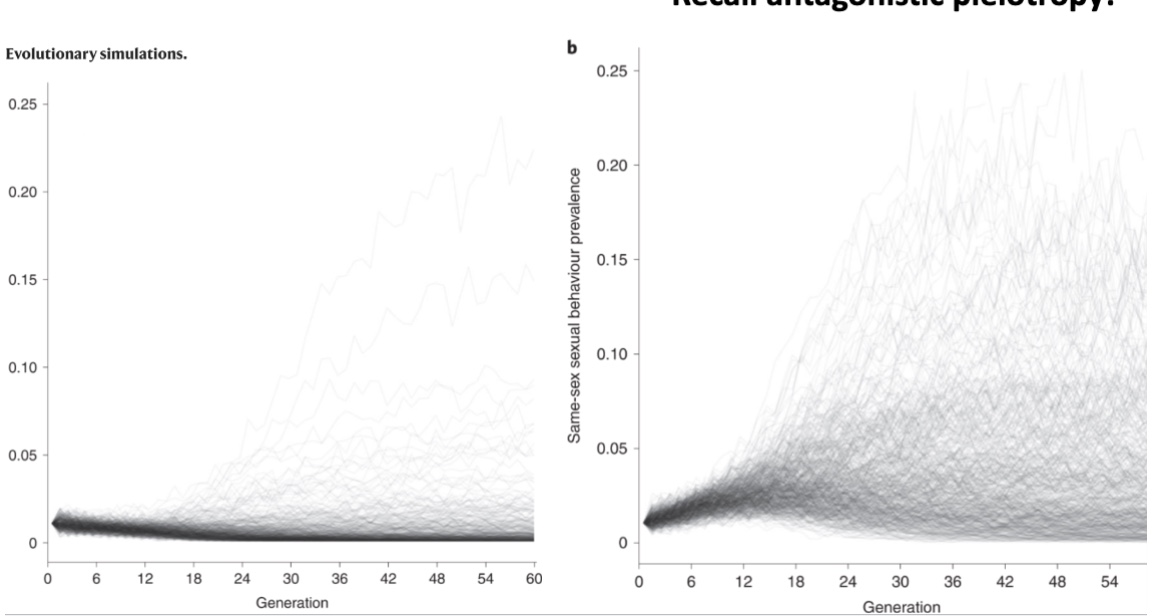
Zietsch fig 1
Same-sex behavior genes would normally vanish over time (panel A), but they can successfully stay in a population if they also provide a mating advantage to other people (graph B, antagonistic pleiotropy)
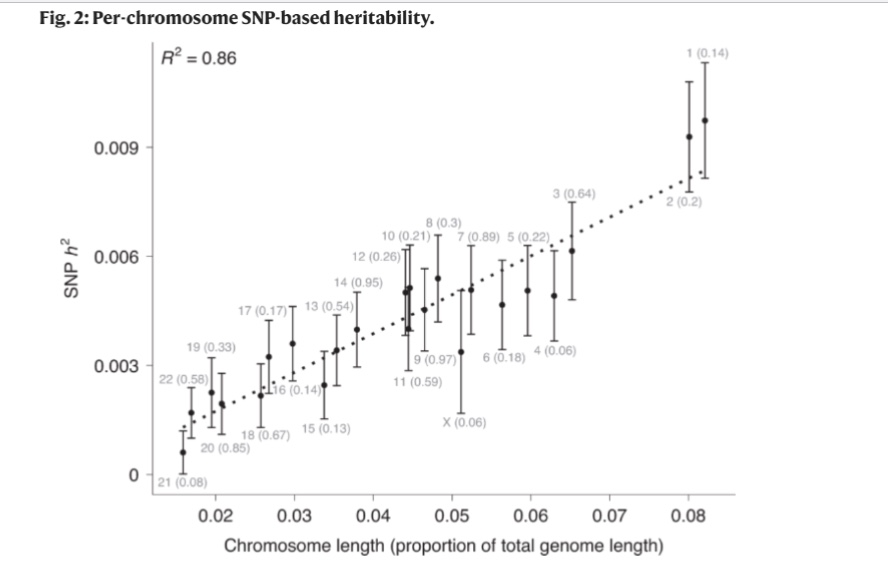
Zietsch fig 2
The longer the chromosome, the more it contributes to sexual behavior. There isn’t just one single gay gene or even one specific part of the DNA responsible for these behaviors.
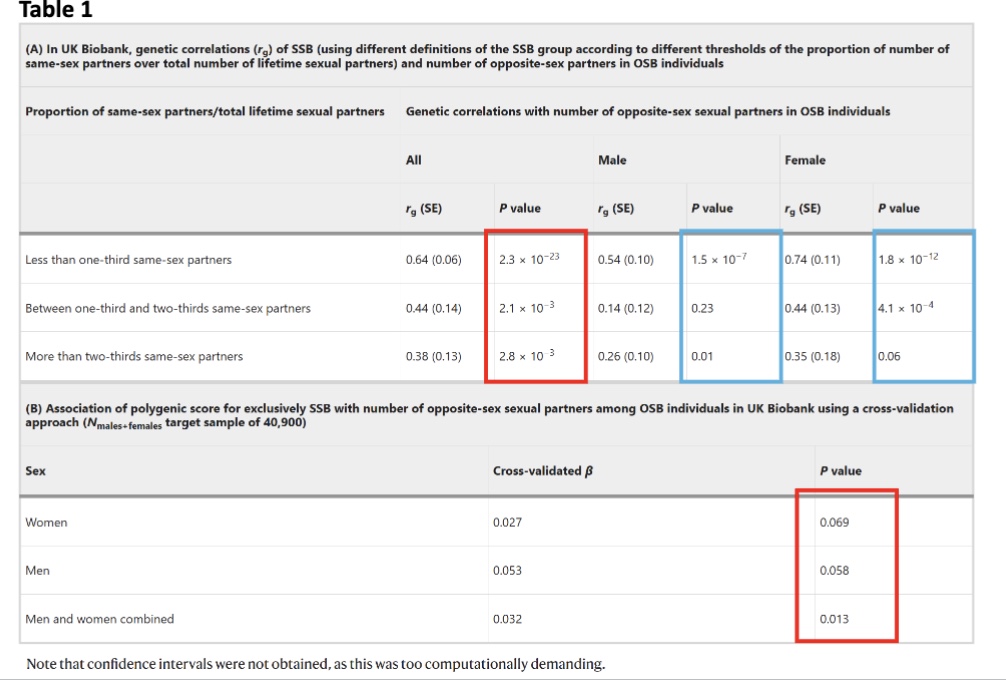
Zietsch table 1
Even when researchers used stricter definitions, they still found a positive genetic correlation with having more opposite-sex partners
Genetic link is stronger in women compared to men
Genes associated with having a higher proportion of same-sex partners were also those most strongly linked to having more opposite-sex partners in heterosexuals
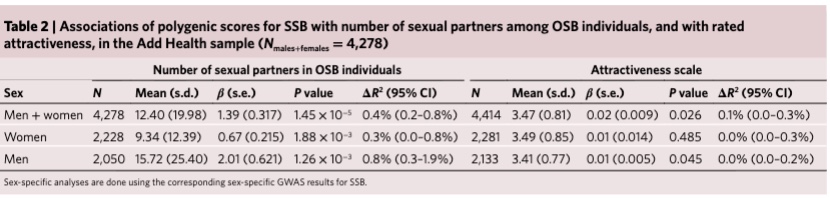
Zietsch table 2
Heterosexual people who carried more SSB genes tended to have a higher number of opposite-sex partners
These same genes were also linked to being rated as more physically attractive by others
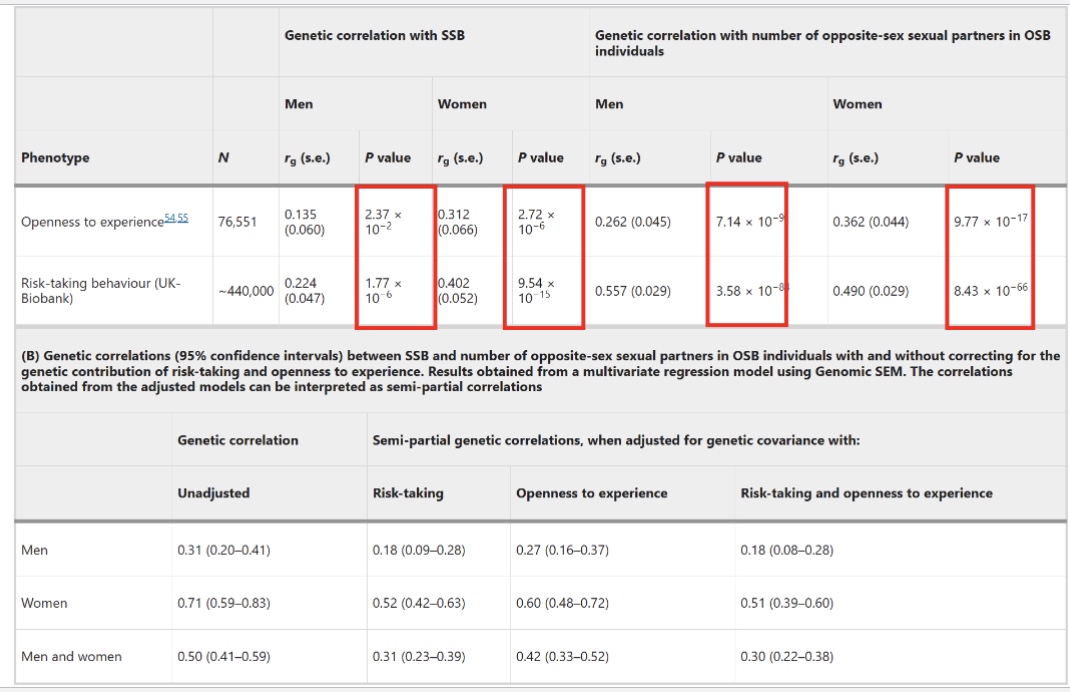
Zietsch table 3
People with more SSB genes also tend to have genes that make them more open to new experiences and more likely to take risks
Risk-taking and openness also explain part of why heterosexual people with these genes have more sexual partners
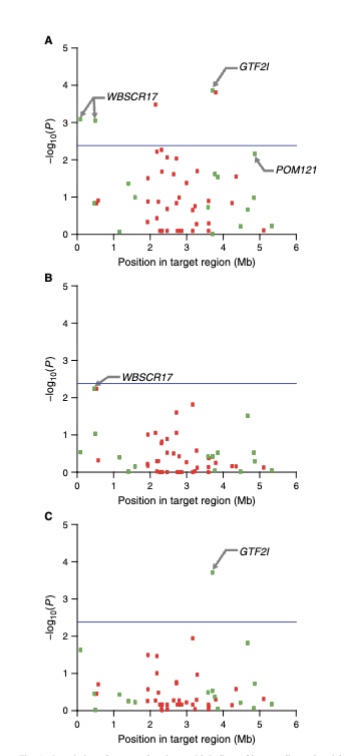
VonHoldt fig 1
Manhattan plots (green= genic regions, red= intergenic regions)
blue line=significant cutoff line
A: WBSCR17 and GTF2I significant SVs for ABS
B: No significant SVs for HYP
C: GTF2I significant SV for SIS
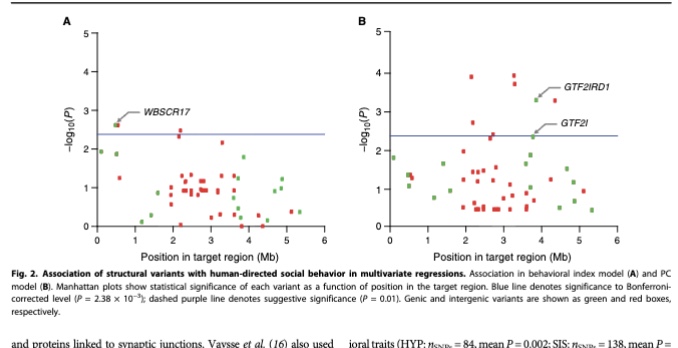
VonHoldt fig 2
test for variation in behavioral model (all 3 behavior tests combined) (A) and PC model (computer derived trait) (B)
A: WBSCR17 significant behavioral index model
B: GTF2ID1 and GTF2I significant in PC model
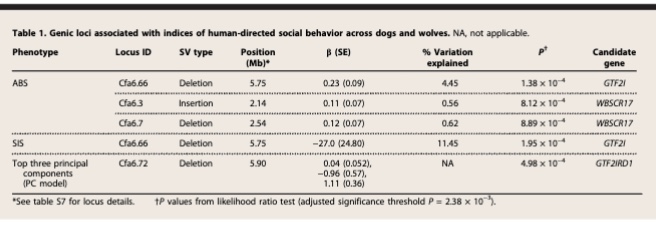
VonHoldt table 1
Loci correlated with behavioral indices in dogs and wolves
Cfa6.66 significant in GTF2I
Cfa6.72 in GTF2ID1
Caf6.3 and Cfab.7 in WBSCR17
what traits are selected for when domesticating animals
reduction in aggression/fear towards humans and each other
increase sociability