1.5 Production Possibility Curves
1/25
There's no tags or description
Looks like no tags are added yet.
Name | Mastery | Learn | Test | Matching | Spaced | Call with Kai |
|---|
No analytics yet
Send a link to your students to track their progress
26 Terms
What is a production possibility curve (PPC)
A curve showing the maximum possible combinations of two goods that can be produced when all resources are fully and efficiently used with the current technology.
- (Also called a production possibility frontier.)
- A simple representation of the maximum level of output that an economy can achieve, given its current state of technology
What does a PPC illustrate in one sentence
Scarcity, choice and opportunity cost—not all combinations are feasible; choosing more of one good requires giving up some of the other.
What does a point on the PPC mean
An efficient allocation: the economy is getting all it can from its resources given the present state of technology.
What does a point inside the PPC mean
Under‑use or inefficiency (e.g., recession/unemployment): output is below what could be achieved with available resources.
What does a point outside the PPC mean
Not attainable with current resources and technology—represents the constraint of scarcity.
What is a straight‑line PPC and what does it show + diagram
A PPC with a constant slope shows constant opportunity cost because the factors of production are equally well suited to both goods.
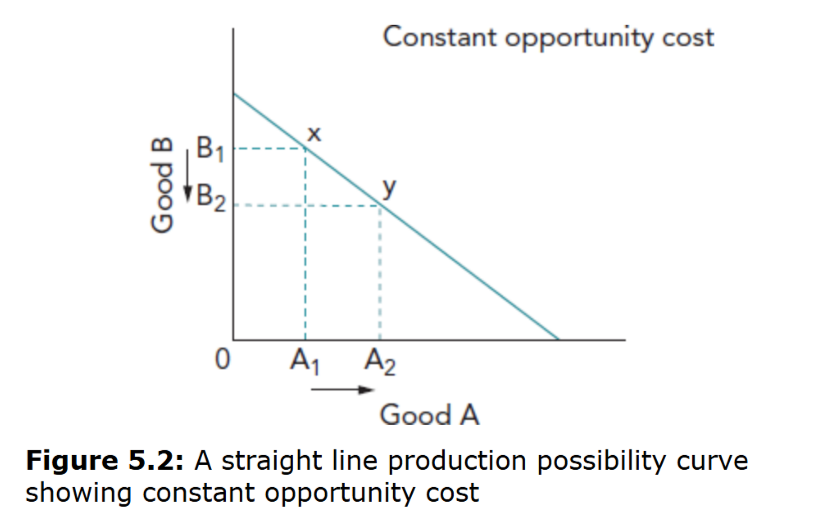
Give a straight‑line PPC example.
Producing two very similar products (e.g., two brands of trainers) where labour and machinery can be switched without loss.
What is a concave‑to‑origin PPC and what does it show + diagram
A concave PPC shows increasing opportunity cost: as production moves toward one good, more and more of the other must be given up because resources are not perfectly adaptable.
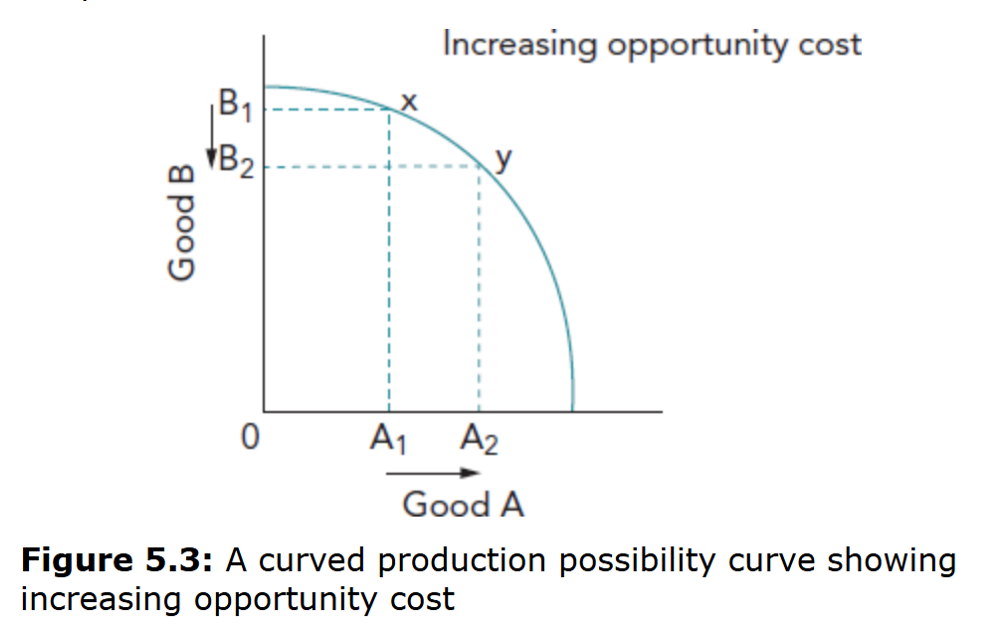
Give a concave PPC example.
Cars vs televisions (or classic guns vs butter): land, labour and capital suited to one are less effective in the other, so the rate of sacrifice rises.
How do you read opportunity cost on a PPC
As the slope (rate of sacrifice) between two points: the amount of one good foregone when producing more of the other.
How do you calculate opportunity cost from a PPC table
Pick two combinations and compute the change in one good divided by the change in the other.
Exam tip – labelling
Always label both axes with goods, mark intercepts, and name points (A, B, C, D).
State explicitly whether OC is constant or increasing.
What is a trade off
What is involved in deciding whether to give up one good for another good
What is a movement along the PPC
A reallocation of resources between the two goods—an illustration of choice and trade‑off with no change in productive capacity.
What is a shift of the entire PPC
A change in productive capacity: the whole frontier moves outward (more of both can be produced) or inward (less of both).
What is productive capacity
The maximum output that can be produced when all resources are used fully
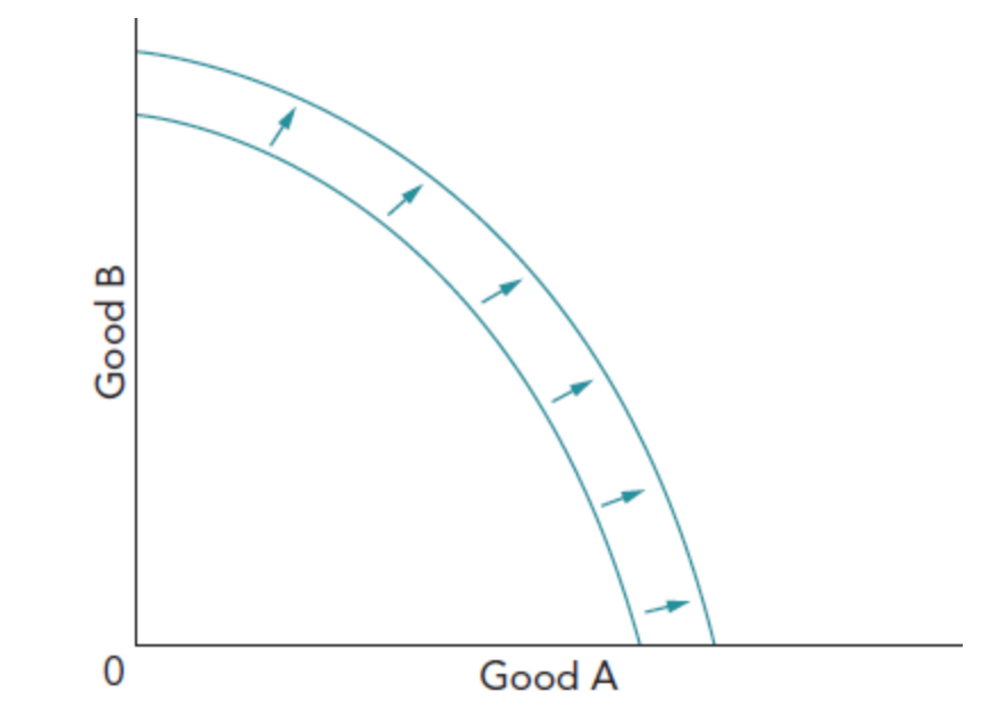
What causes an outward shift of the PPC (3)
More resources become available(e.g., immigration increases labour; higher capital stock; improved enterprise)
2. Better quality resources (education, training, health)
3. Technological progress raising productivity
Result: higher potential output of both goods.
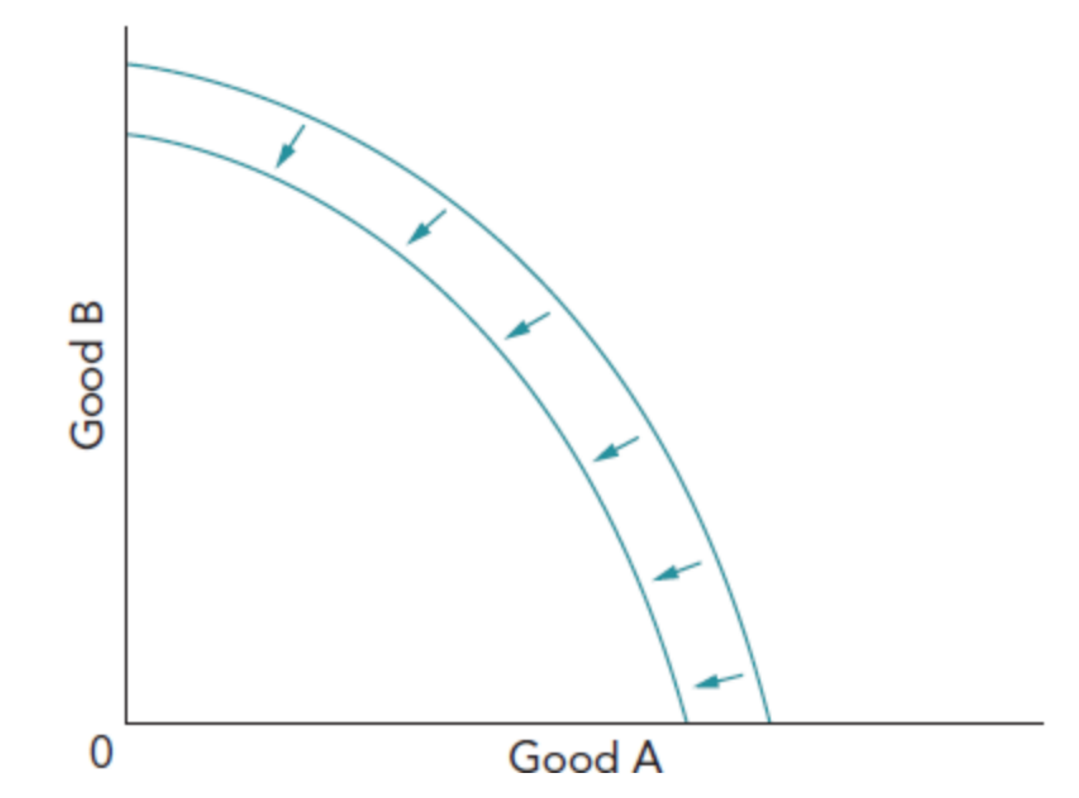
What causes an inward shift of the PPC (3)
Loss of resources (war, natural disaster, emigration)
2. Deterioration in resource quality
3. Technological regress
Result: lower potential output of both goods.
Key concept link
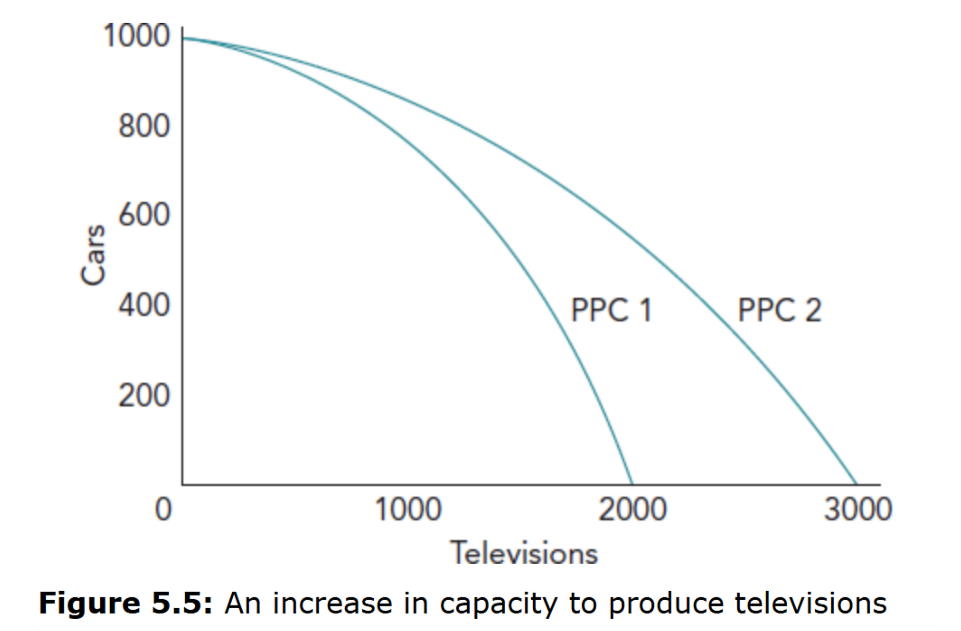
What is a biased (pivot) outward shift (+ diagram) and why does it occur
A pivot where capacity increases more for one good than the other (e.g., a technology improvement in televisions).
- The PPC swings out on the TV axis, showing a larger gain for televisions at any given level of cars.
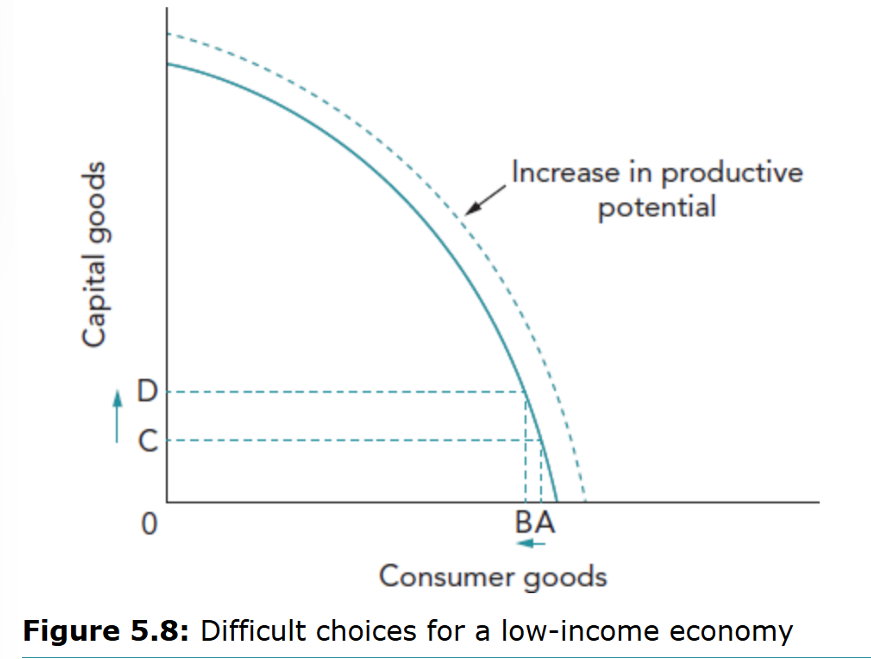
How do PPCs represent difficult choices in low‑income economies (+ diagram)
A small reduction in current consumer goods can free resources for capital goods, shifting the PPC outward over time and raising future productive potential.
- From point B to A (slightly fewer consumer goods now) → more capital goods (from C to D) → future outward shift of the PPC (“increase in productive potential”).
Why does increasing opportunity cost make the PPC curved
Because factors are specialised: as more resources are moved, successively less suitable factors are used, so each extra unit of the chosen good costs more of the other.
When would constant opportunity cost be realistic
When factors are homogeneous across uses—rare in reality, but useful for simple modelling.
How do the PPC endpoints (intercepts) help interpretation
They show the extreme outputs if all resources were devoted to one good—useful for checking feasibility and scale of changes.
What key ideas should be stated whenever you use a PPC
• Identify scarcity (point outside is unattainable)
• Identify choice (movement along the curve)
• Quantify opportunity cost (rate of sacrifice)
• Distinguish movement vs shift (reallocation vs capacity change)
One‑line conclusion to use in essays about PPC
A PPC is a simple but powerful way to show maximum output, efficient/inefficient points, trade‑offs, and how resource/technology changes shift an economy’s productive capacity.