discrete probability distribution (chapter 6); sampling distributions & estimating value of parameter (chapter 8-9)
1/15
There's no tags or description
Looks like no tags are added yet.
Name | Mastery | Learn | Test | Matching | Spaced | Call with Kai |
|---|
No analytics yet
Send a link to your students to track their progress
16 Terms
random variable
numerical measure of the outcome of a probability experiment, so its value is determined by chance. random variables are typically denoted using capital letters such as X
discrete: has either a finite or countable number of values
continuous: infinitely many values
probability distribution
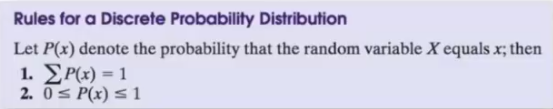
provides the possible values of the random variable and their corresponding probabilities; can be in the form of a table, graph, or mathematical formula
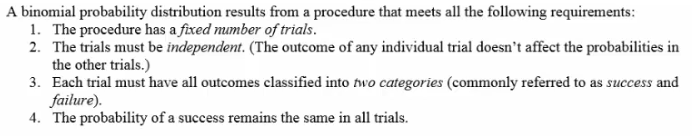
binomial probability (list 1-4)
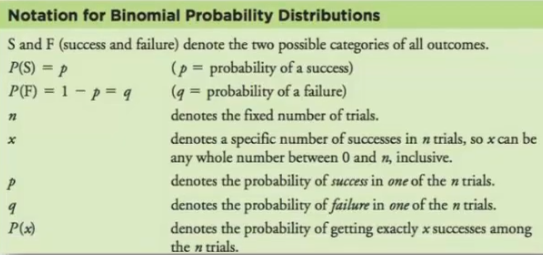
notation for binomial probability distributions (chart)
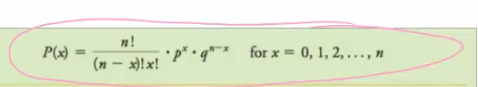
binomial probability formula
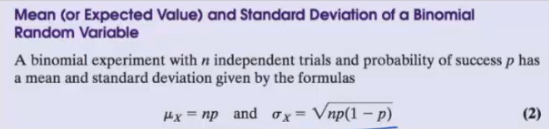
mean (or expected value) and standard deviation of a binomial random variable
life insurance problem logic
(what they make if they live) + (what they lose if they die)*
*don’t forget to account for the price person paid for policy (they get to keep that even if person dies)
binomial experiments
2nd var stats, binompdf, enter, trial n, probability of success , number of successes, x
mean (expected value) of binomial random variable
mean = np
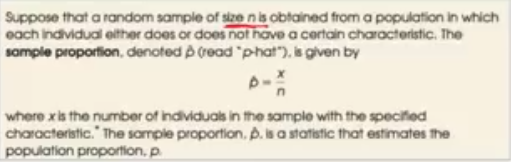
sampling distribution of a sample proportion
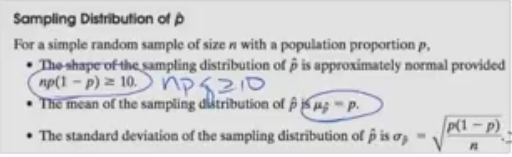
describing sampling distribution of p hat
1.) check if normal: is npq greater than or equal to 10 and is n is less than or equal to 0.05N?
2.) find mean: always equal to p, the population proportion
3.) find standard deviation: sqrt of pq/n
shape, center, and spread of sampling distribution of the sample proportion
shape: as size of sample increases, shape of sampling distribution of sample proportion becomes approximately normal
center: the mean equals the population proportion, p
spread: standard deviation of sampling distribution decreases as the sample size increases
sampling distribution of p-hat
verify independence
n less or equal to .05N
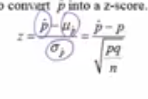
computing probability of a sample proportion
why is the sample proportion, p hat, a random variable