Thẻ ghi nhớ: AP Statistics Vocabulary | Quizlet
1/99
There's no tags or description
Looks like no tags are added yet.
Name | Mastery | Learn | Test | Matching | Spaced | Call with Kai |
|---|
No analytics yet
Send a link to your students to track their progress
100 Terms
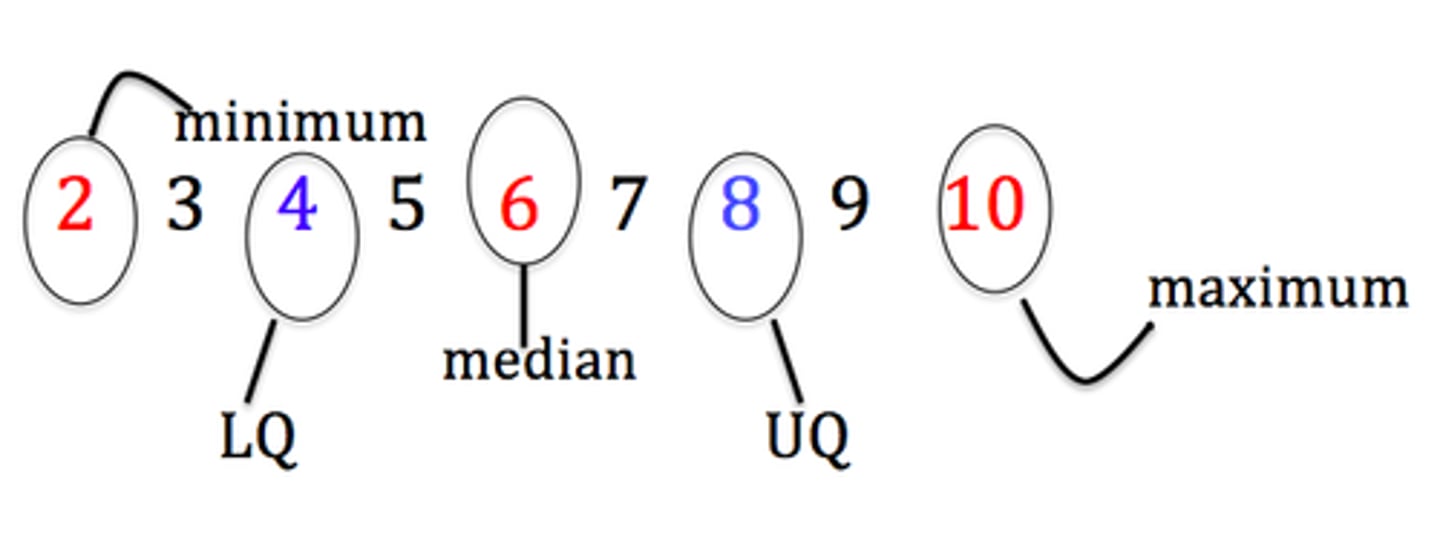
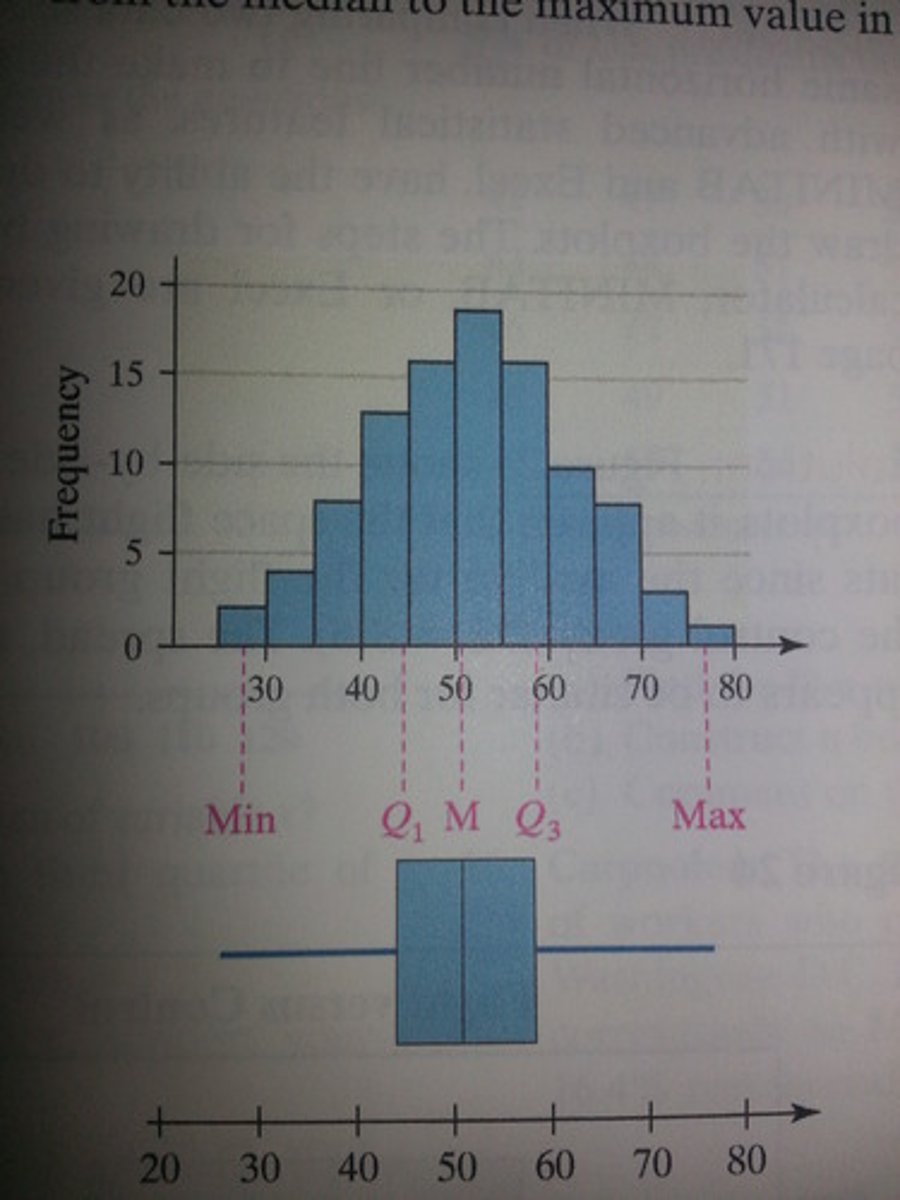
5 number summary
The minumum value, lower quartile, median, upper quartile, and maximum value for a data set. These five values give a summary of the shape of the distribution and are used to make box plots.
The five numbers that help describe the center, spread and shape of data
z score
a measure of how many standard deviations you are away from the norm (average or mean)
-Number of standard deviations a score is above or below the mean (positive above, negative below
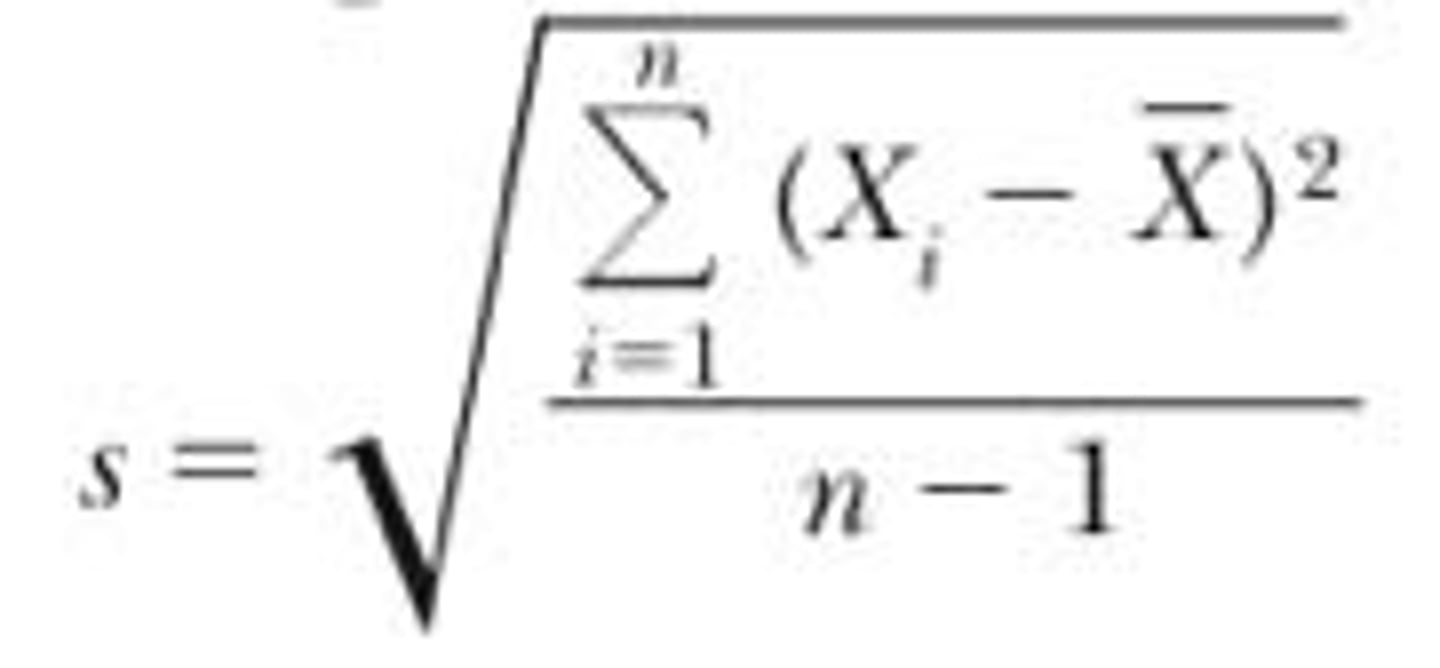
standard deviation
A statistical measure of how far away each value is, on average, from the mean.
A measure of spread. Specifically, the typical distance the data points are from the mean.
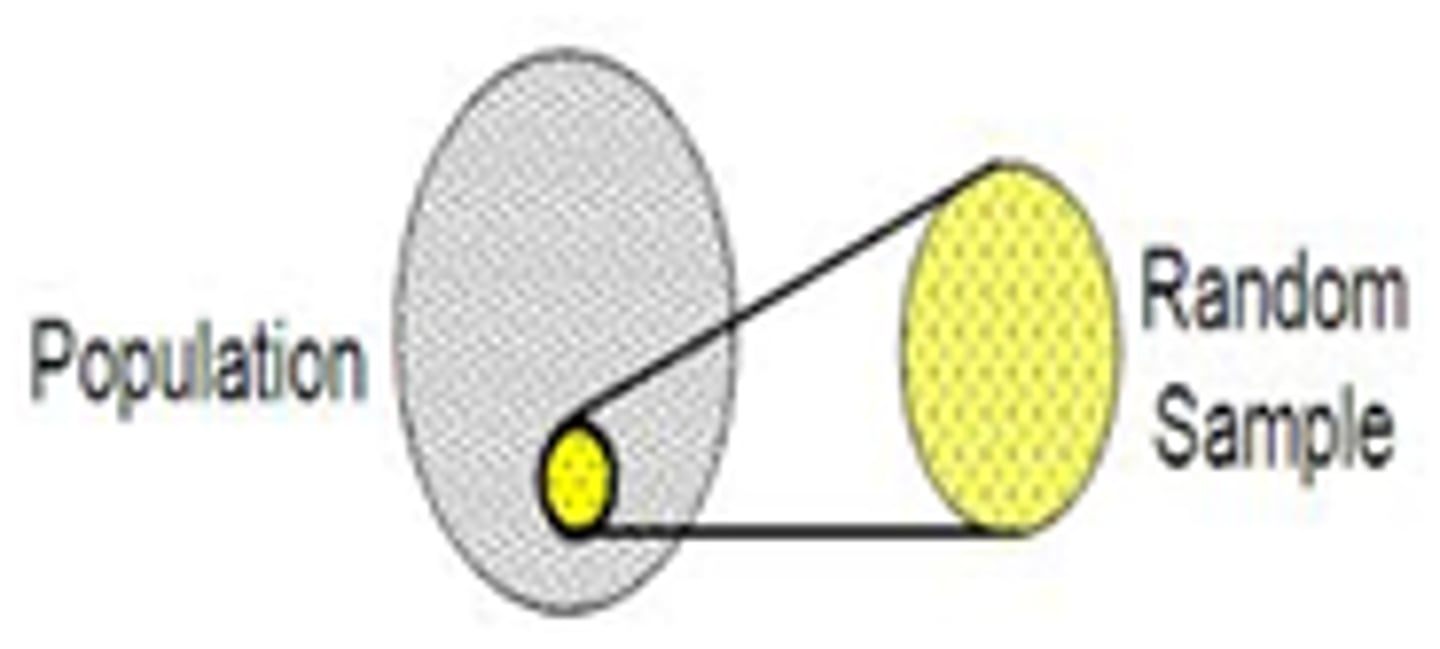
population
(statistics) the entire aggregation of items from which samples can be drawn
What the sample in an experiment or study usually reperesents
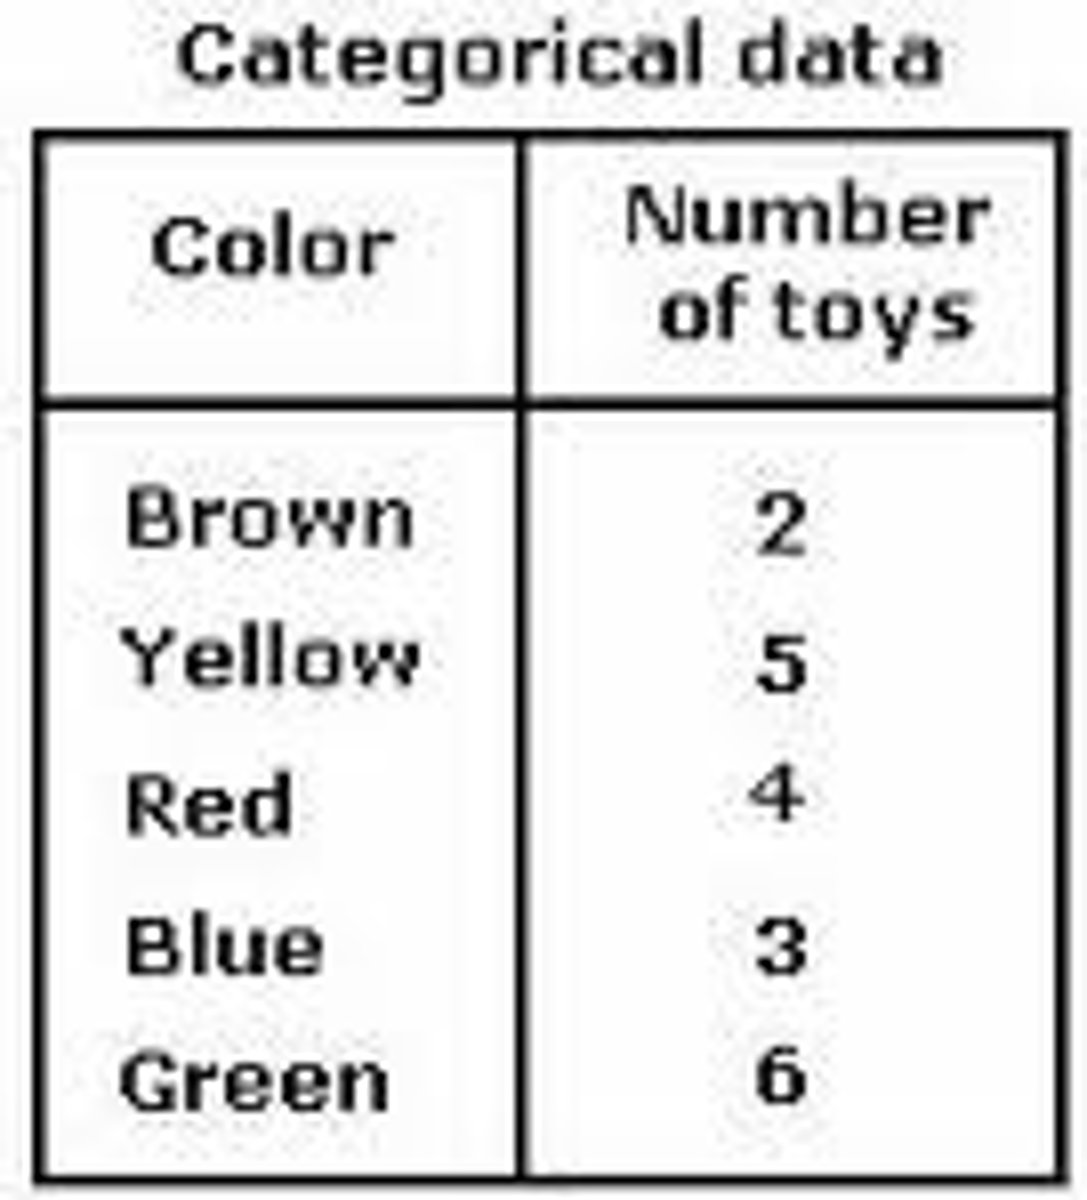
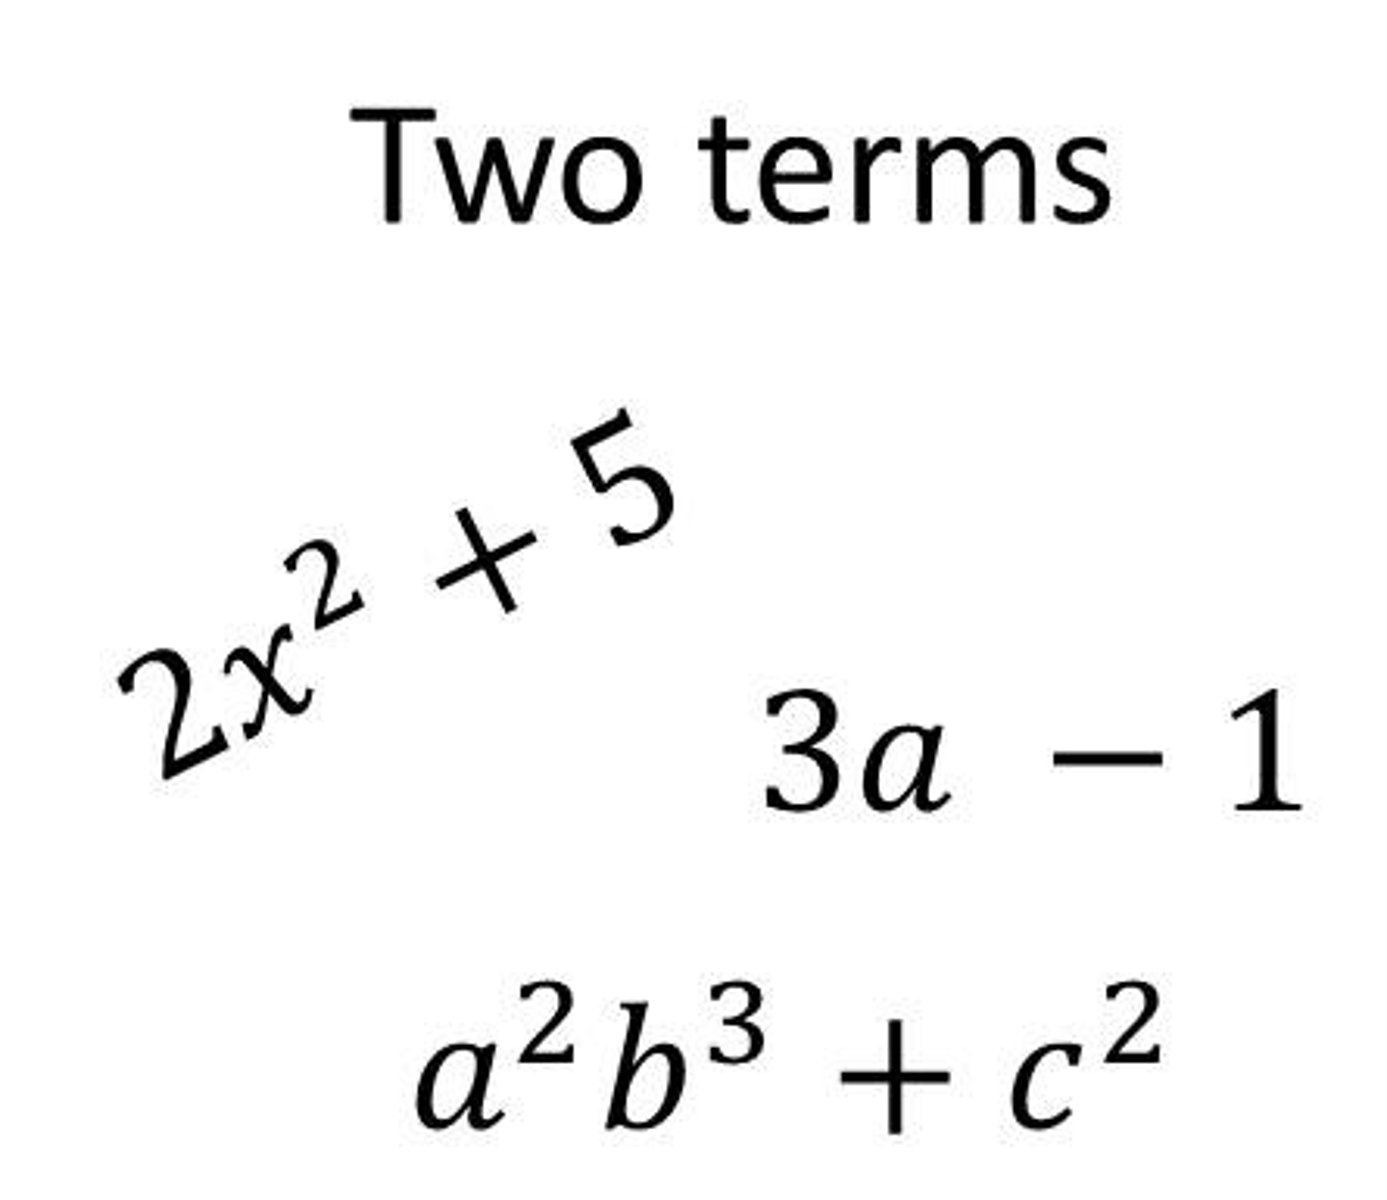
categorical data
Data that can be placed into categories . For example "gender" is a categorical data and the categories are "male" and "female".
Labels or names used to identify categories of like items
If you asked people in which month they were born or what their favorite class is, they would answer with names, which would be categorical data. However, if you asked them how many siblings they have, they would answer with numbers, not categories
Labels or names used to identify categories of like items
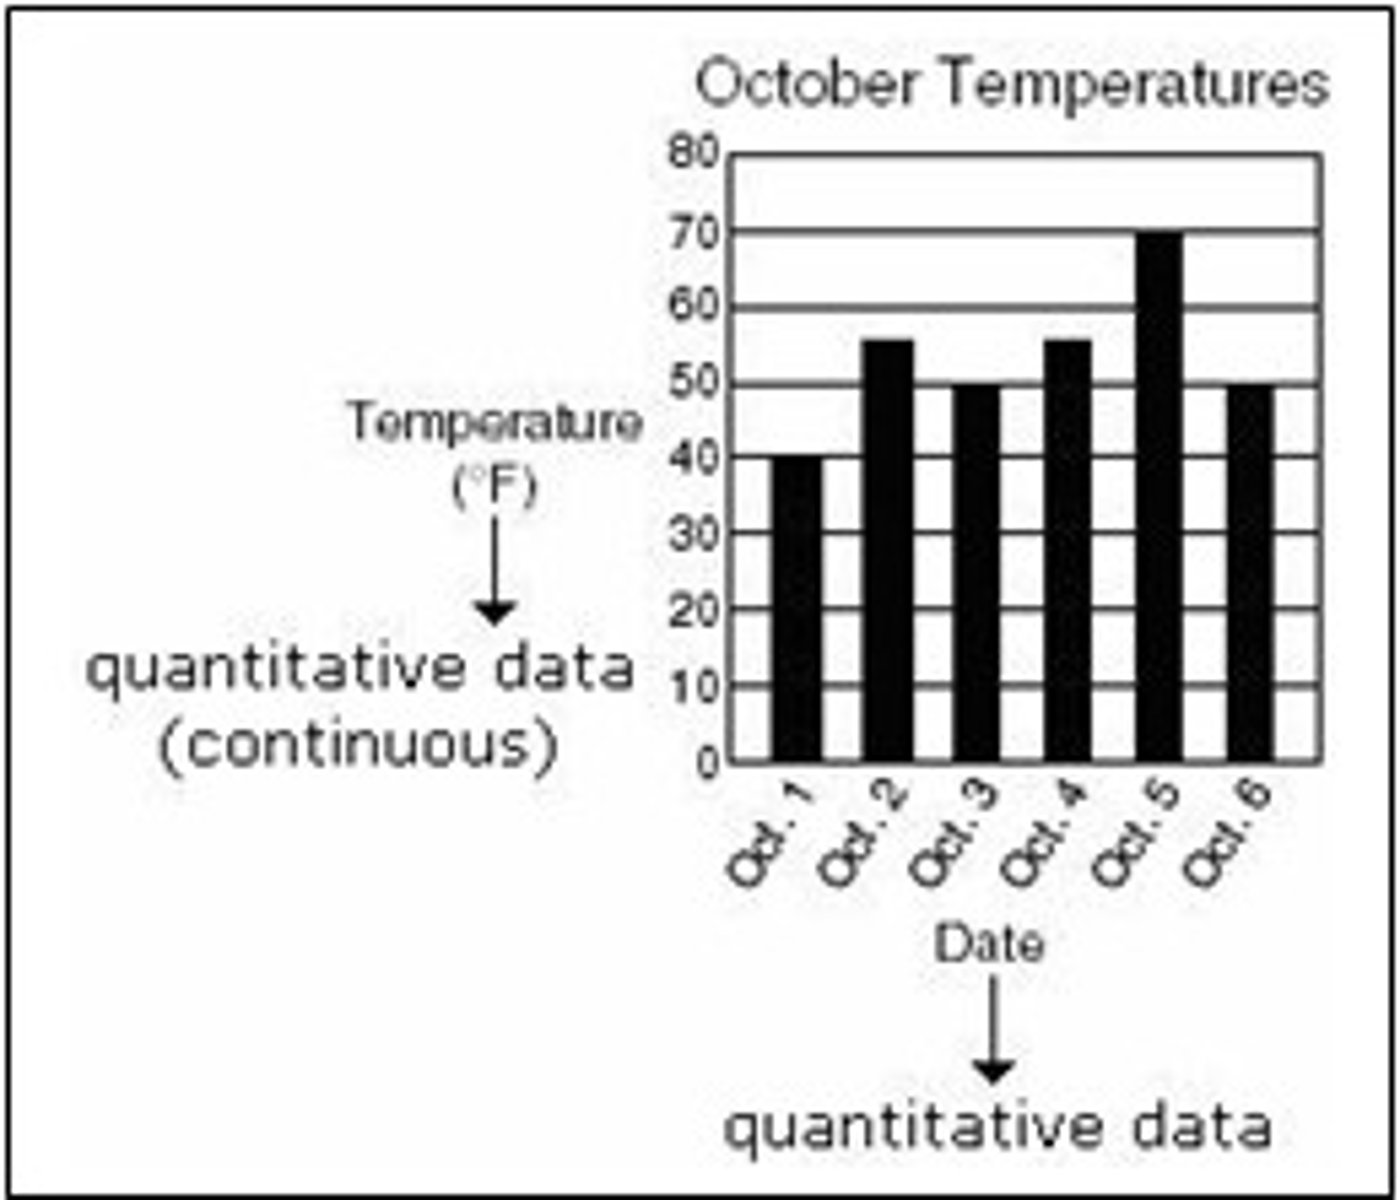
quantitative data
Data associated with mathematical models and statistical techniques used to analyze spatial location and association.
numerical information describing how much, how little, how big, how tall, how fast, etc.
age is quantitative
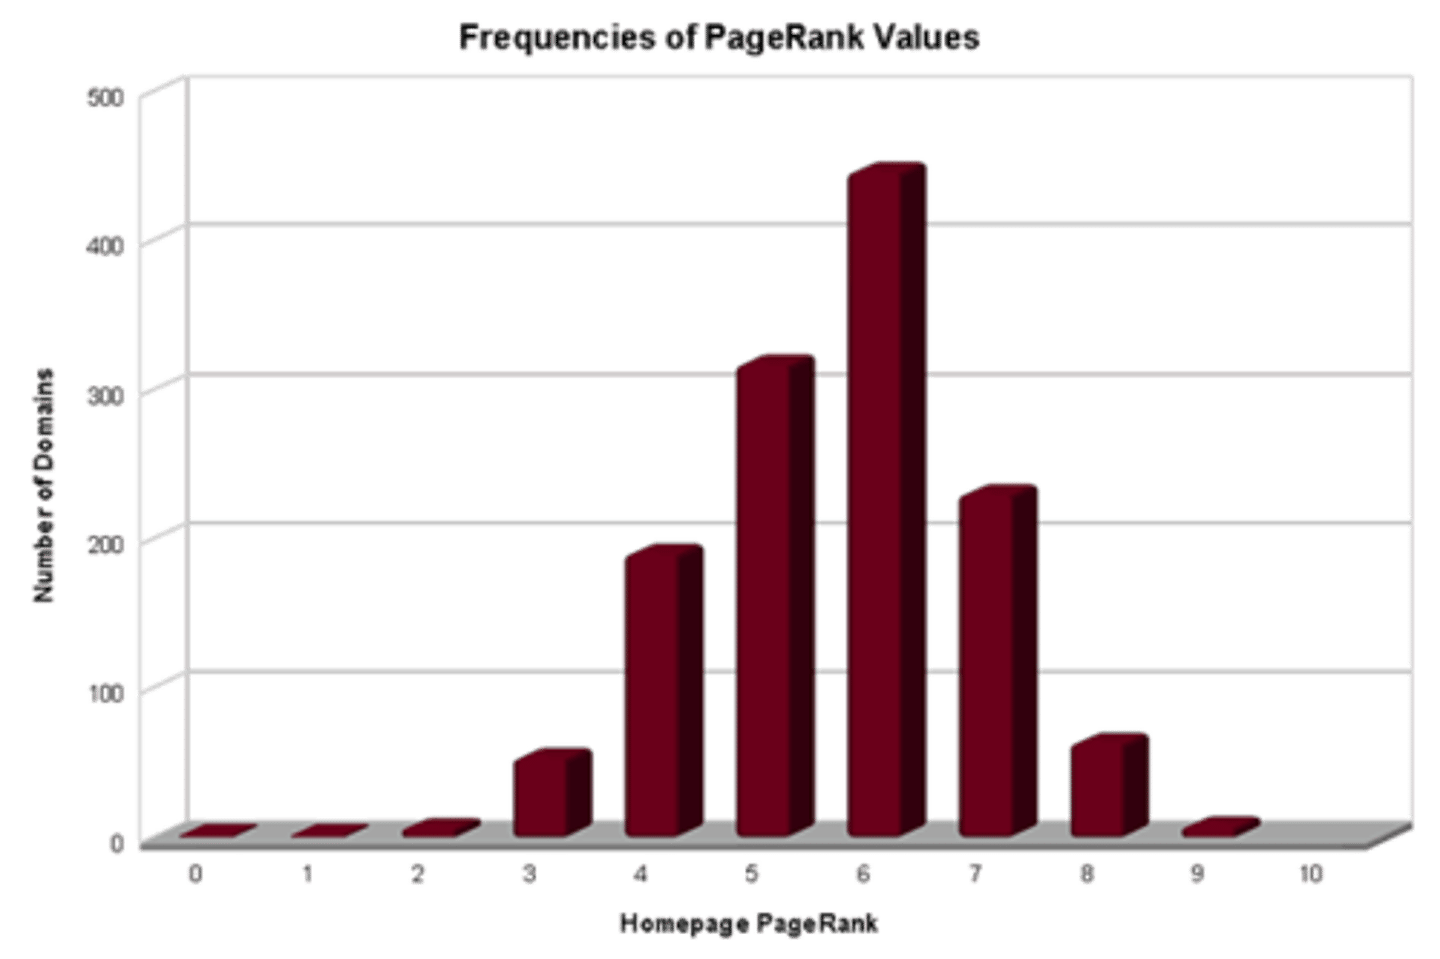
bar graph
a type of graph in which the lengths of bars are used to represent and compare data in categories
A graph that uses horizontal or vertical bars to represent data.
parameter
(n) a determining or characteristic element; a factor that shapes the total outcome; a limit, boundary
a characteristic or constant factor
something that determines the limits of certain data values
sample
A relatively small proportion of people who are chosen in a survey so as to be representative of the whole.
a small part of a population that represents the whole
A survey in star city representing the entire state of arkansas
random
Assigning participants to experimental and control conditions by chance, thus minimizing preexisting differences between those assigned to the different groups.
Assigning subjects to expenrimental groups based on chance.
pulling names or numbers out of a hat
bias
Any systematic failure of a sampling method to represent its population
Any way that tampers with the accuracy of the sample
Undercoverage
A sampling scheme that biases the sample in a way that gives a part of the population less representation than it has in the population.
When some groups in the population are left out of the process of choosing the sample
nonresponse
bias introduced to a sample when a large fraction of those sampled fails to respond
When many people of a sample do not respond
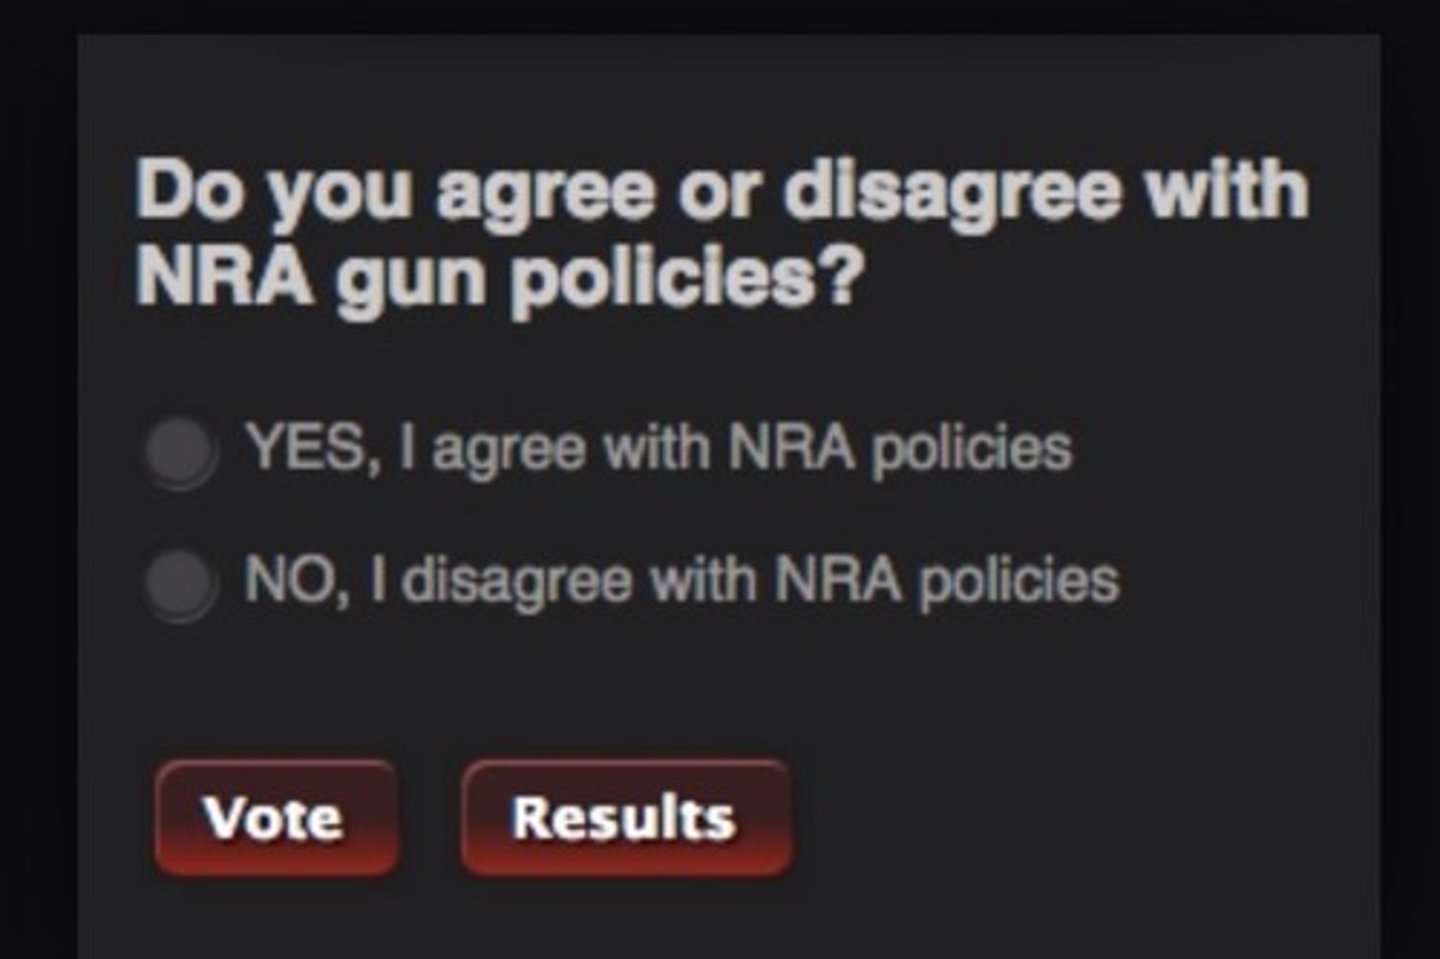
voluntary response bias
Bias introduced to a sample when individuals can choose on their own whether to participate in the sample.
statistic
Application of mathematics to describing and analyzing data
independent
(statistics) a variable whose values are independent of changes in the values of other variables
historgram
graphical representation of a frequency distribution using vertical bars but bars touch each other to indicate variables are related
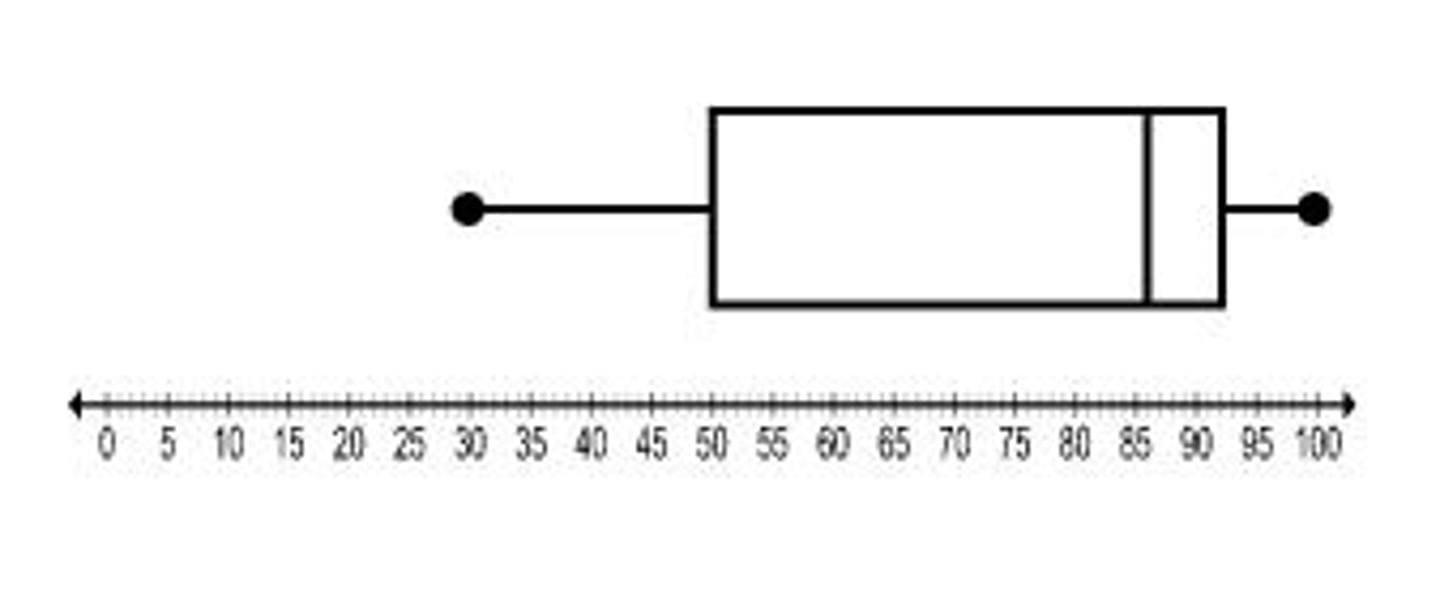
box plot
A dsiplay that shows the distribution of values in a data set seperated into four equal-sized groups. A box plot is constructed from the five number summary of the data.
scatterplot
A graphed cluster of dots, each of which represents the values of two variables. The slope of the points suggests the direction of the relationship between the two variables. The amount of scatter suggests the strength of the correlation (little scatter indicates high correlation).
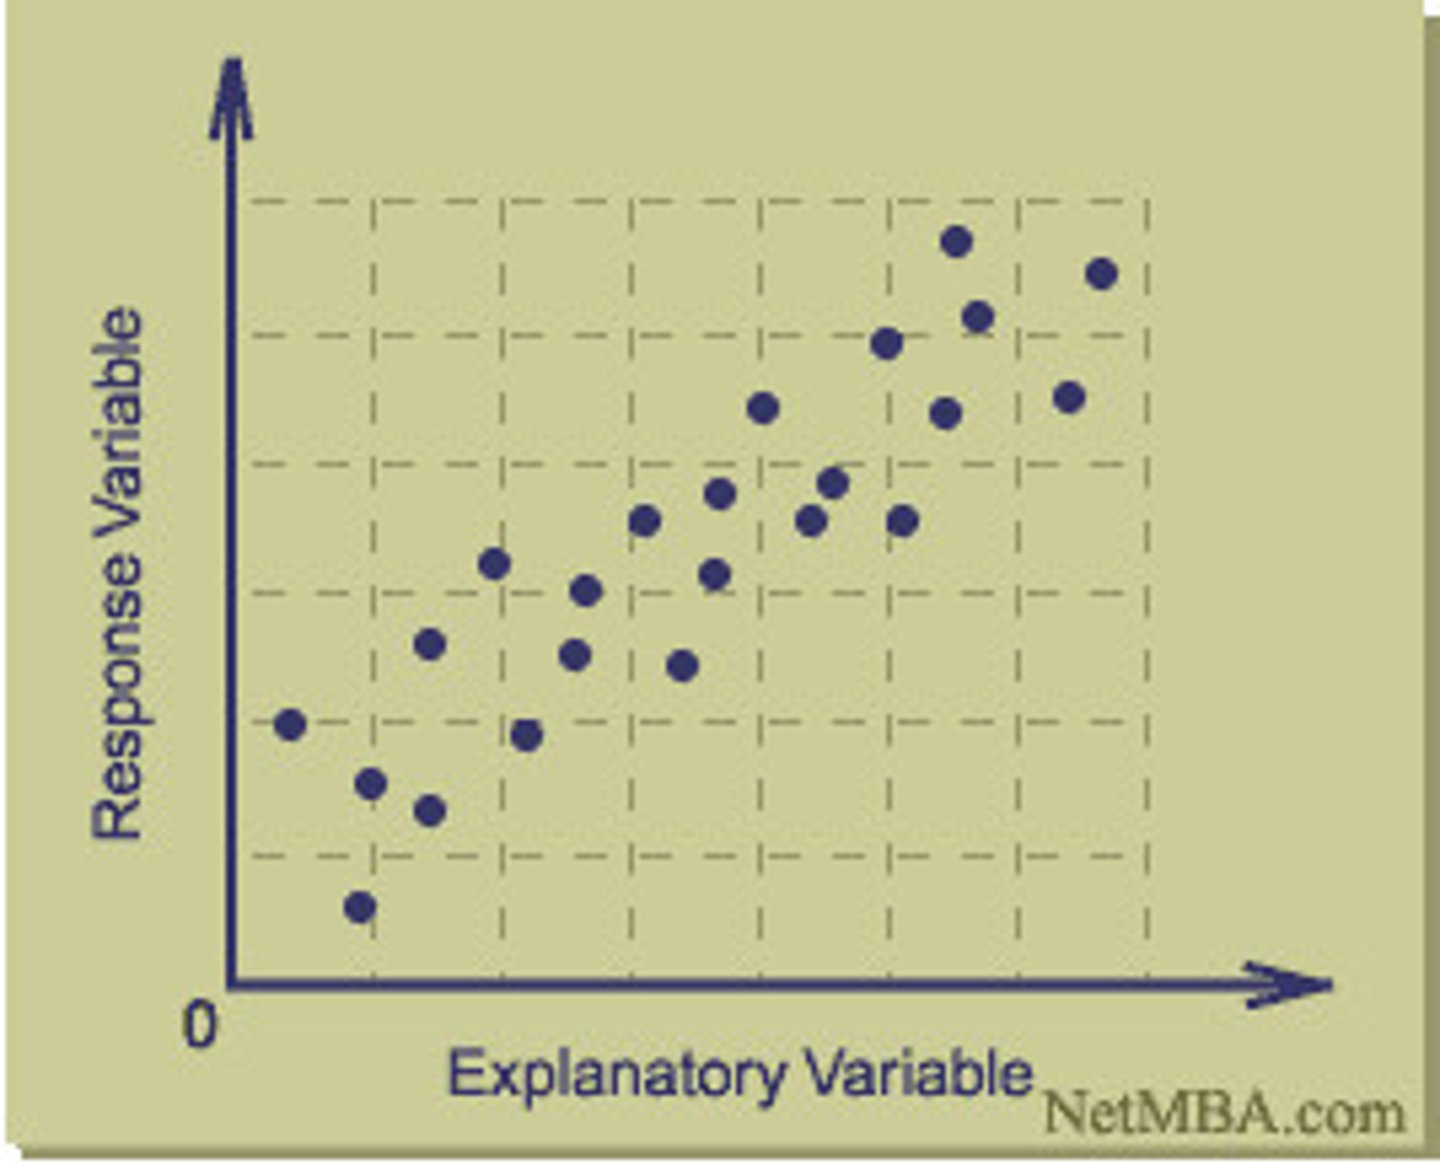
correlation
A measure of the extent to which two factors vary together, and thus of how well either factor predicts the other. The correlation coefficient is the mathematical expression of the relationship, ranging from -1 to +1
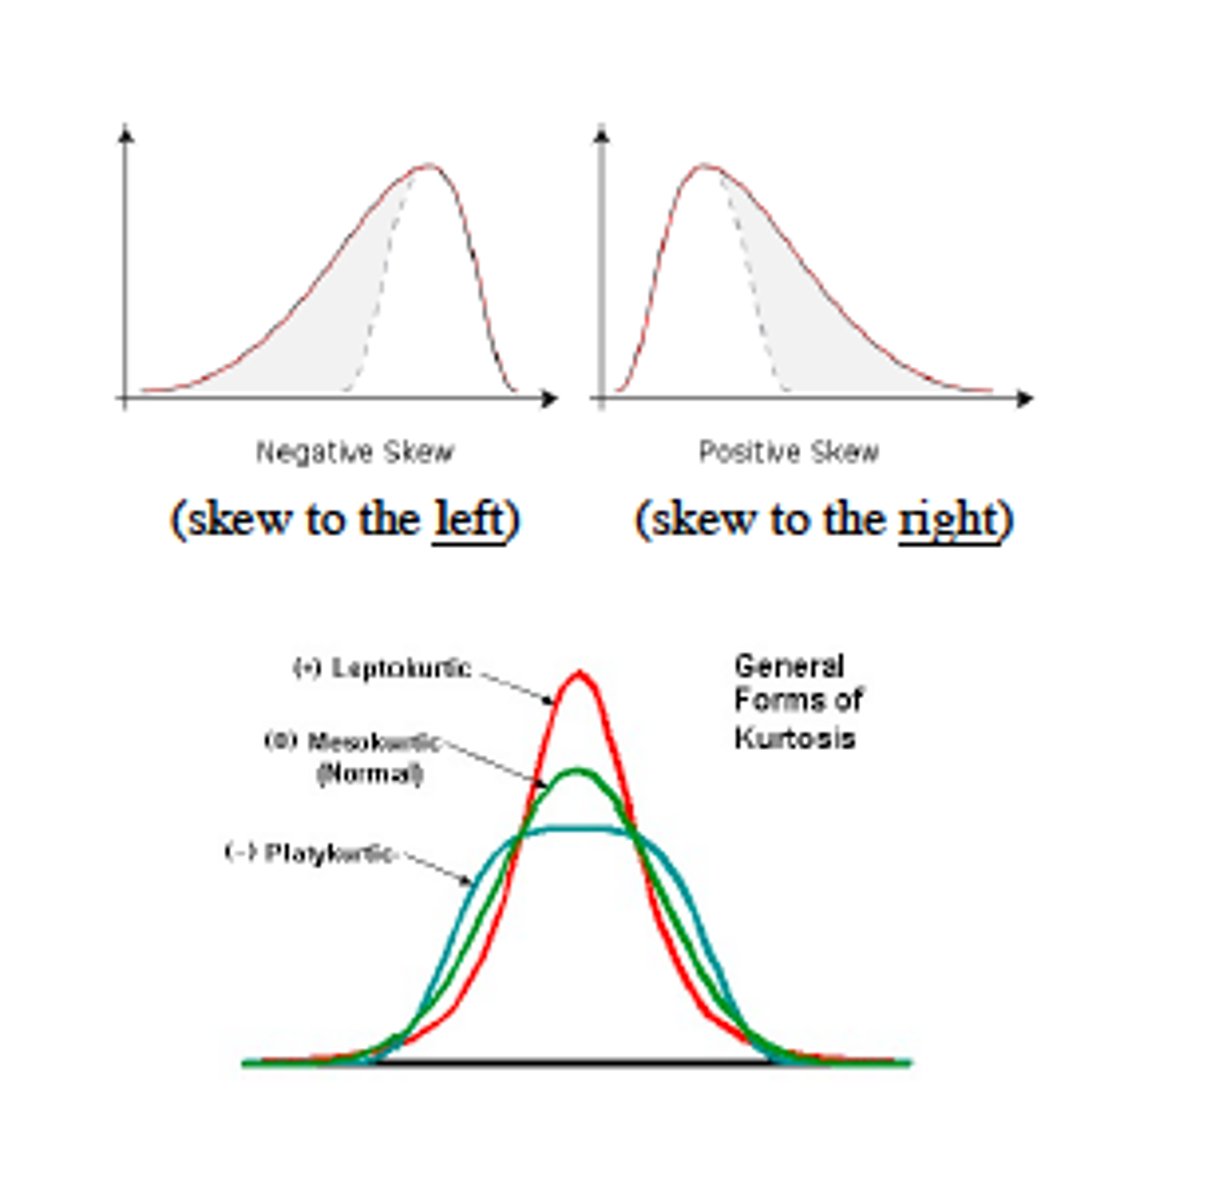
skewness
The extent to which cases are clustered more at one or the other end of the distribution of a quantitative variable rather than in a symmetric pattern around its center
varience
commons measure of spread about the mean as center
statistical significance
A statistical statement of how likely it is that an obtained result occurred by chance/The condition that exists when the probability that the observed findings are due to chance is very low
P-value
A measure of statistical significance. The lower, the more likely the results of an experiment did not occur simply chance.
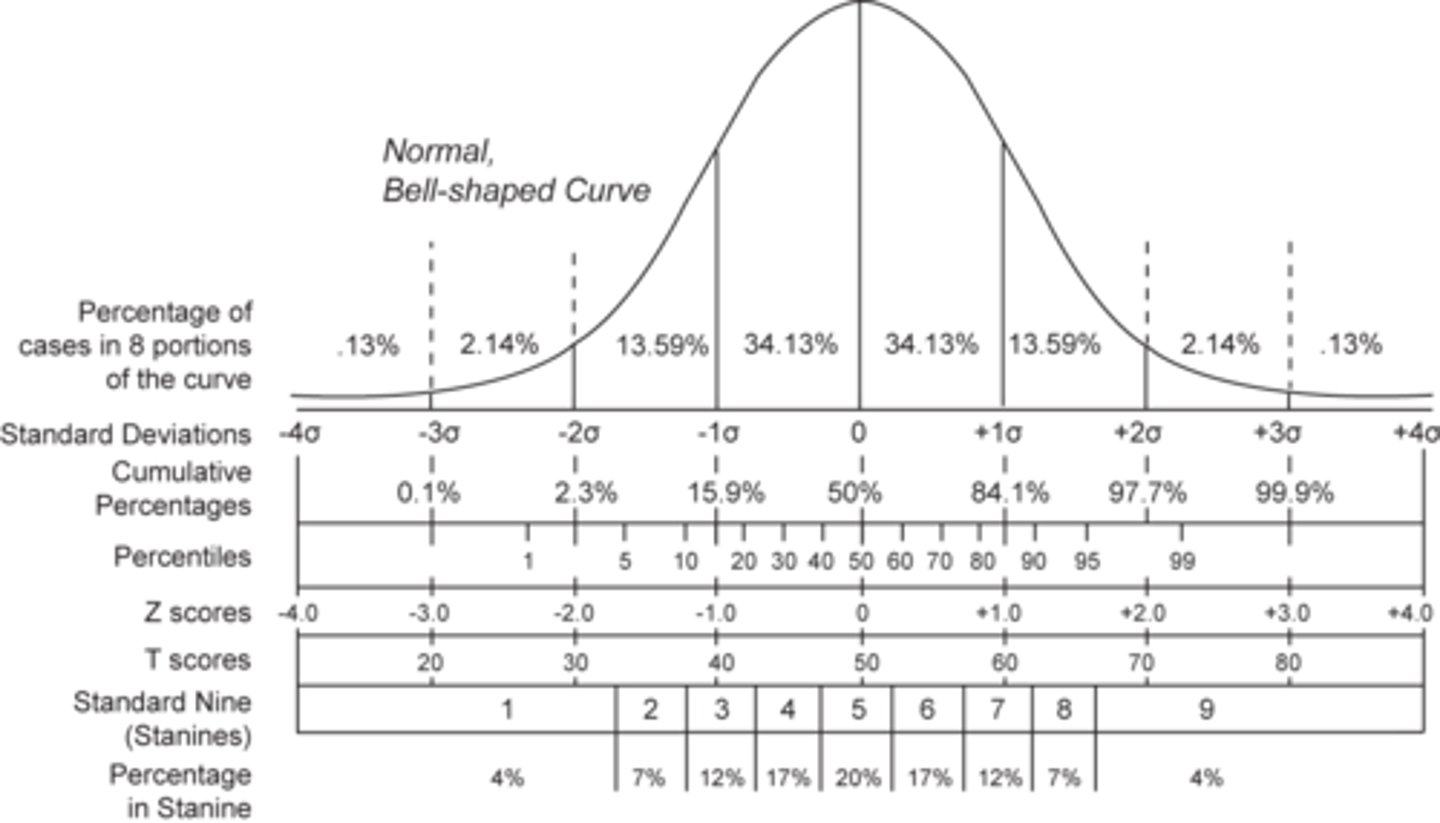
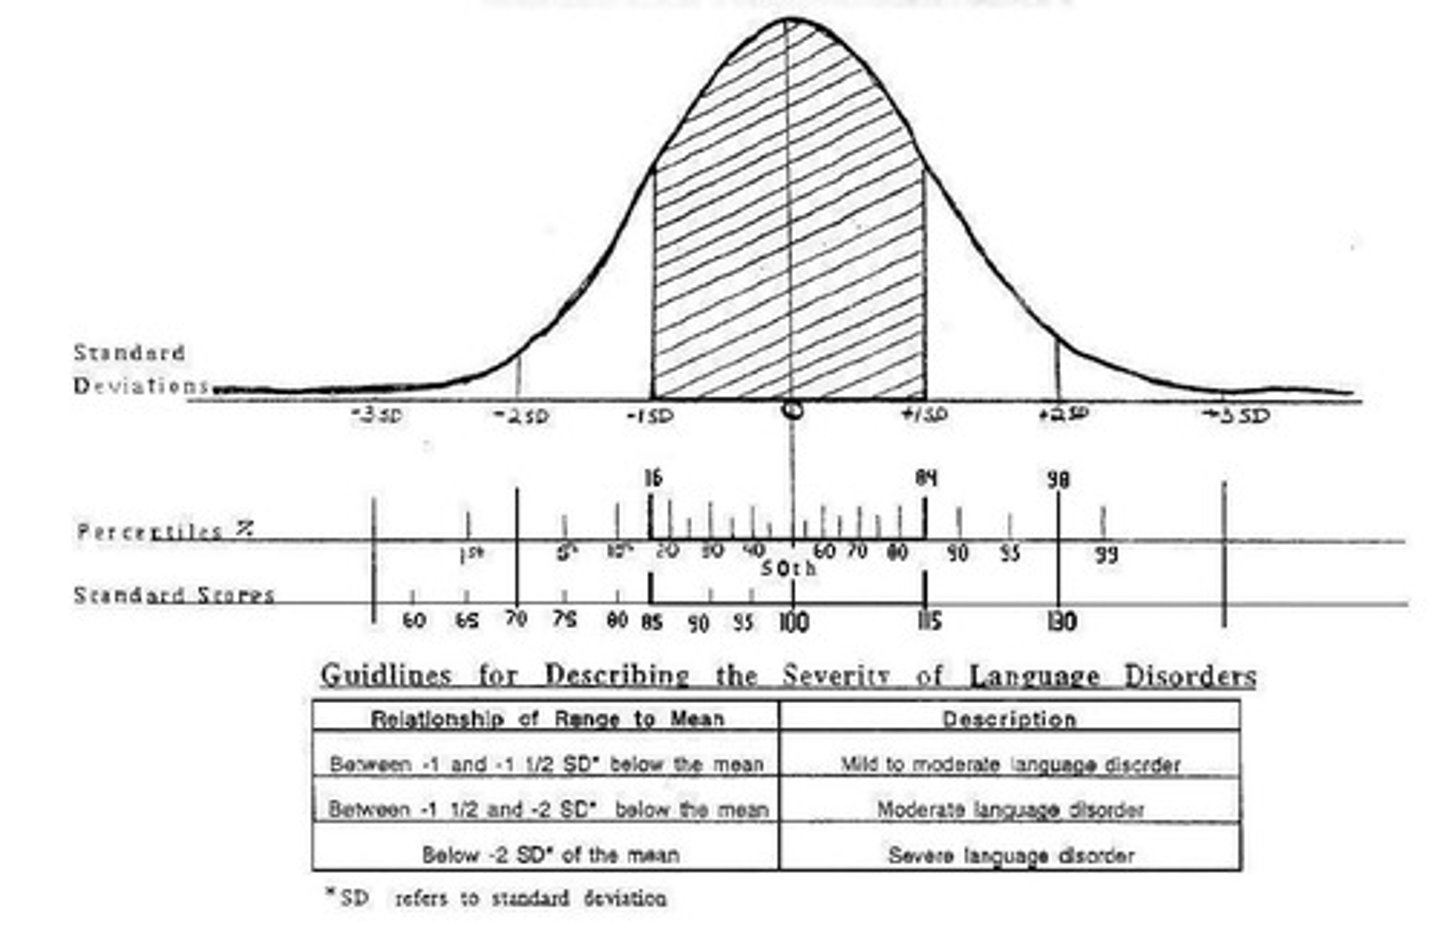
empirical rule
The rules gives the approximate % of observations w/in 1 standard deviation (68%), 2 standard deviations (95%) and 3 standard deviations (99.7%) of the mean when the histogram is well approx. by a normal curve
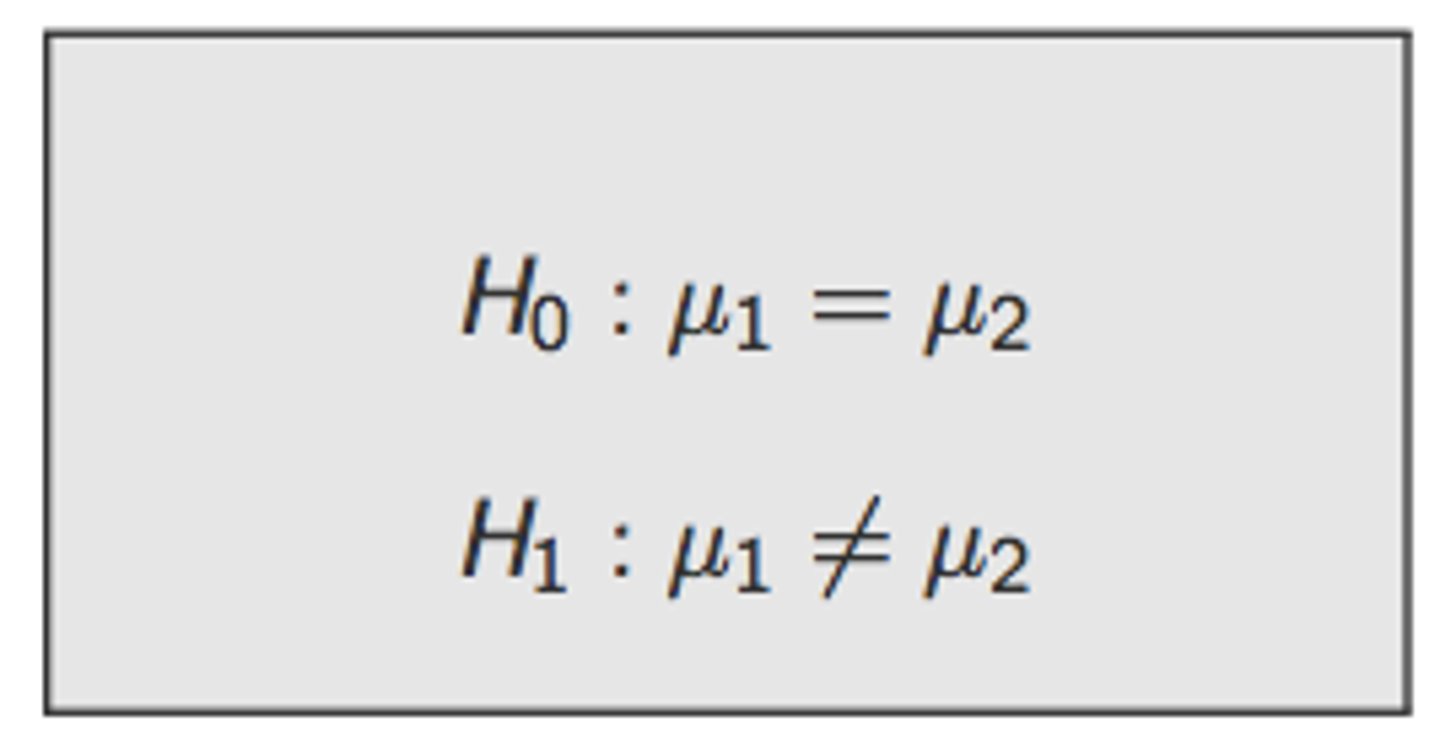
null hypothesis
Hypothesis that predicts NO relationship between variables. The aim of research is to reject this hypothesis
alternate hypothesis
, is the hypothesis to be considered as an alternative to the null hypothesis. The null hypothesis will be rejected in favor of the Ha only if the sample data strongly indicate that the null hypothesis is false.
quota sample
A sample deliberately constructed to reflect several of the major characteristics of a given population
probability
A number with a value from 0 to 1 that describes the likelihood that an event will occur. example, if a bag contains a red marble, a white marble and a blue marble then the probability of selecting a red marble is 1/3.

descriptive statistics
Mathematical procedures for organizing collections of data, such as determining the mean, the median, the range, the variance, and the correlation coefficient
mean
A measure of center in a set of numerical data, computed by adding the values in a list and then dividing by the number of values in the list.
median
A measure of center in a set of numerical data. The median of a list of values is the value appearing at the center of a sorted version of the list - or the mean of the two central values if the list contains an even number of values.
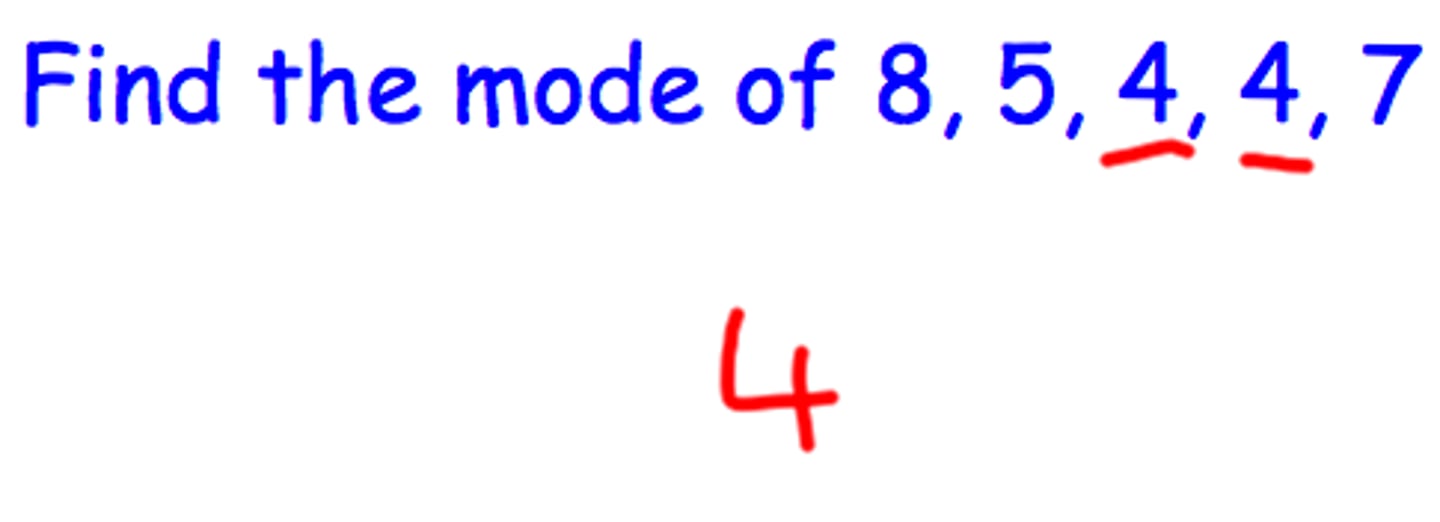
mode
Measure of central tendency that uses most frequently occurring score.
range
Distance between highest and lowest scores in a set of data.
data
Facts and statistics collected together for reference or analysis
Q1
A location measure of the data such that has one fourth or 25% of the data is smaller than it. Found by dividing the ordered data set in half (excluding the middle observation if n is odd) and finding the median of the lower half of the data.
Q3
A location to measeure when counting data to such as the median where instead of counting 50% it is 75% from the beginning of the sorted data
minimum
(n.) the smallest possible amount; (adj.) the lowest permissible or possible
outlier
A value much greater or much less than the others in a data set
margin of error
In statistical research, the range of outcomes we expect for a population, given the data revealed by a sample drawn from that population
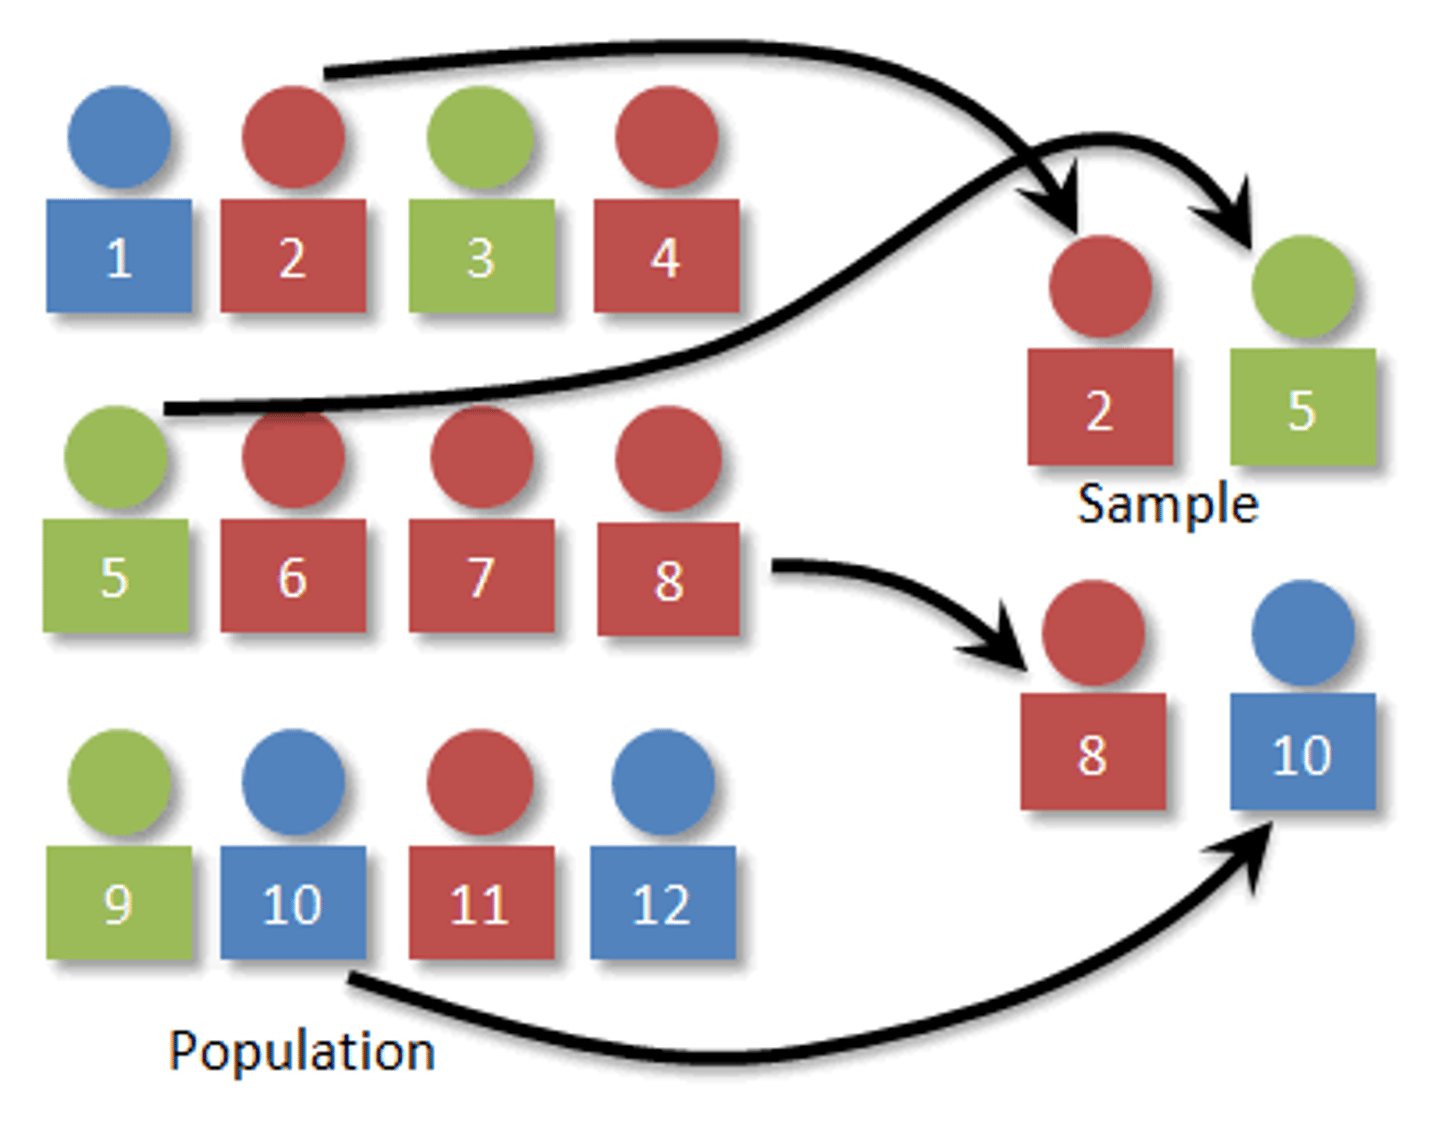
simple random sample
A sample selected in such a way that every element in the population or sampling frame has an equal probability of being chosen. Equivalently, all samples of size n have an equal chance of being selected.
A sample of size n selected from the population in such a way that each possible sample of size n has an equal chance of being selected.

sampling distribution
Distribution of sample proportions from sample to sample. A sampling distribution of a sample statistic for a fixed sample size n is the distribution of that statistic derived from every possible sample of size n for a given population.
A distribution of statistics obtained by selecting all the possible samples of a specific size from a population
stratified random sample
A method of sampling that involves dividing your population into homogeneous subgroups and taking a simple random sample in each subgroup.
a sampling design in which the population is divided into several groups, and random samples are then drawn from each stratum
systematic sample
A sample drawn by selecting individuals systematically from a sampling frame
A sample drawn by selecting individuals systematically from a sampling frame. When there is no relationship between the order of the sampling frame and the variables of interest, a systematic sample can be representative.
cluster sample
Is obtained by selecting all individuals within a randomly selected collection or group of individuals.
10% rule
a sample has to be lass than 10% of the whole population
Interpolation
The estimation of an unknown number between known numbers. Interpolation is a way of approximating price or yield using bond tables that do not give the net yield on every amount invested at every rate of interest and for every maturity.
Qualitative
Data in the form of recorded descriptions rather than numerical measurements.
theoretical probability
A probability obtained by analyzing a situation. If all of the outcomes are equally likely, you can find the theoretical probability of an event by listing all of the possible outcomes and then finding the ratio of the number of outcomes producing the desired event to the total number of outcomes. For example, there are 36 possible equally likely outcomes (number pairs) when two fair number cubes are rolled. of these six have a sum of 7, so the probability of rolling a sum of 7 is 6/36 or 1/6
experimental probability
block design
The subjects in an experiment are first divided into groups (called 'blocks') based on some common characteristic (such as gender) that is hypothesised to have an effect on the response. Randomization of treatments then happens within each block (each block is like its own mini-experiment)."
blinding
The practice of concealing group assignment from study subjects, investigators, and/or those who assess subject outcomes, typically in the context of a randomized controlled trial. For ex, study subjects may receive capsules with identical appearance and taste; however, the treatment group receives the active drug, whereas the control group receives the placebo.
double blind
An experiment in which neither the subjects nor the people who work with them know which treatment each subject is receiving
Neither the subjects nor the people who have contact with them know which treatment a subject received
placebo
A fake treatment.
A chemically inert substance that produces real medical benefits because the patient believes it will help her

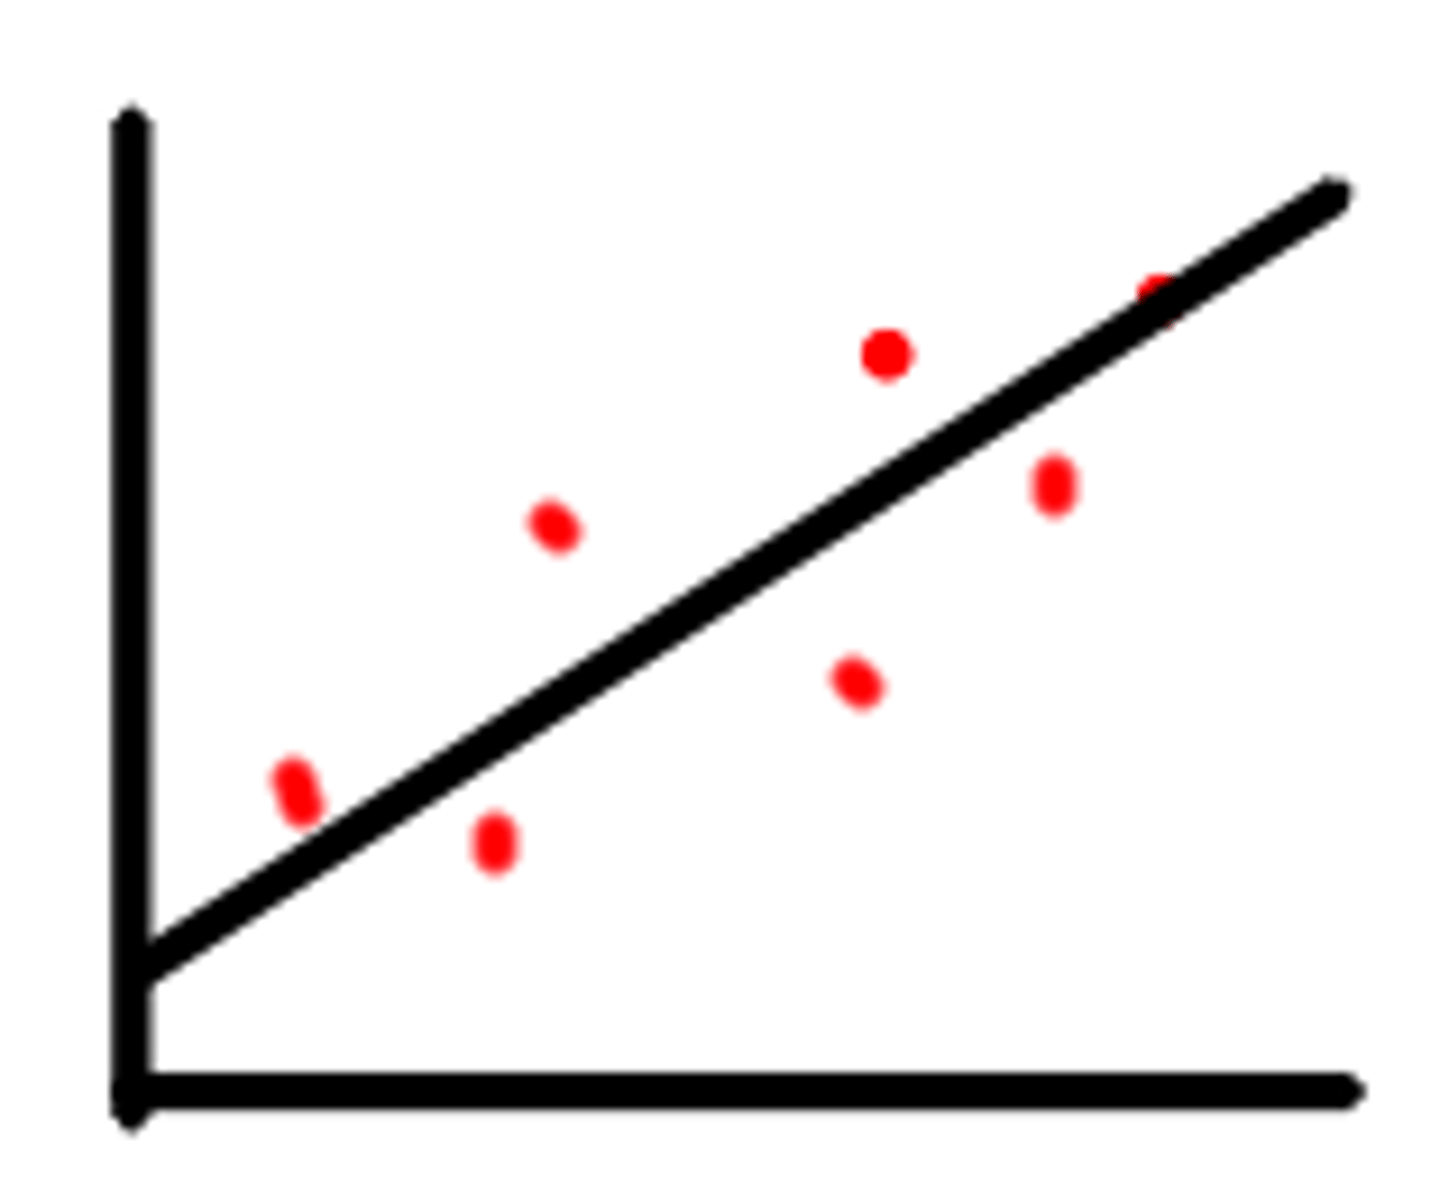
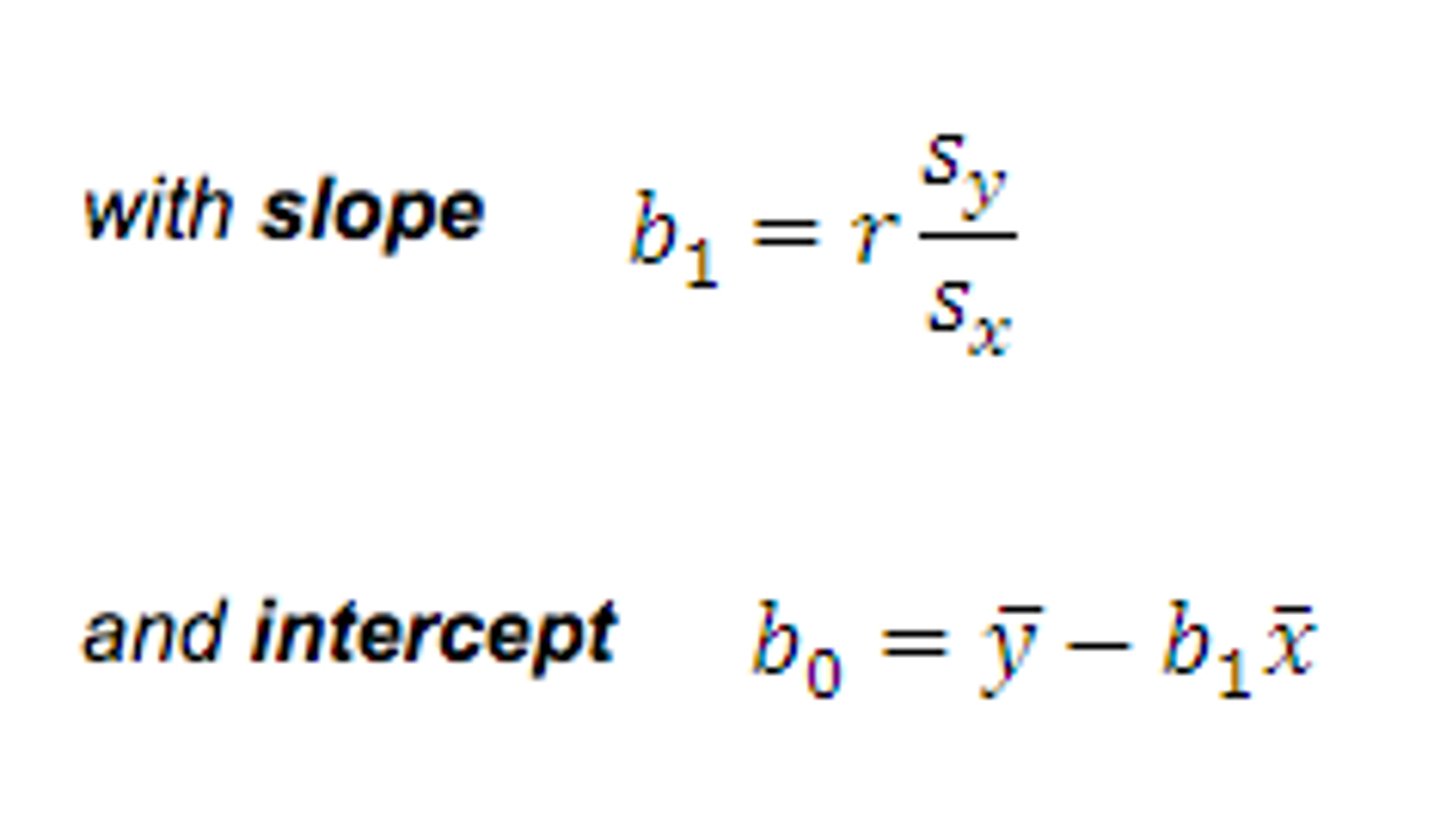
least squares regression line
the line with the smallest sum of squared residuals
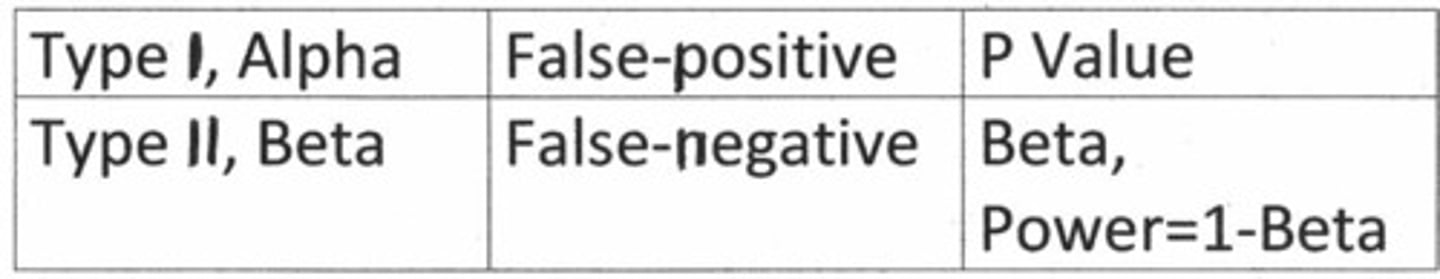
type I error
An error that occurs when a researcher concludes that the independent variable had an effect on the dependent variable, when no such relation exists; a "false positive

type II error
An error that occurs when a researcher concludes that the independent variable had no effect on the dependent variable, when in truth it did; a "false negative
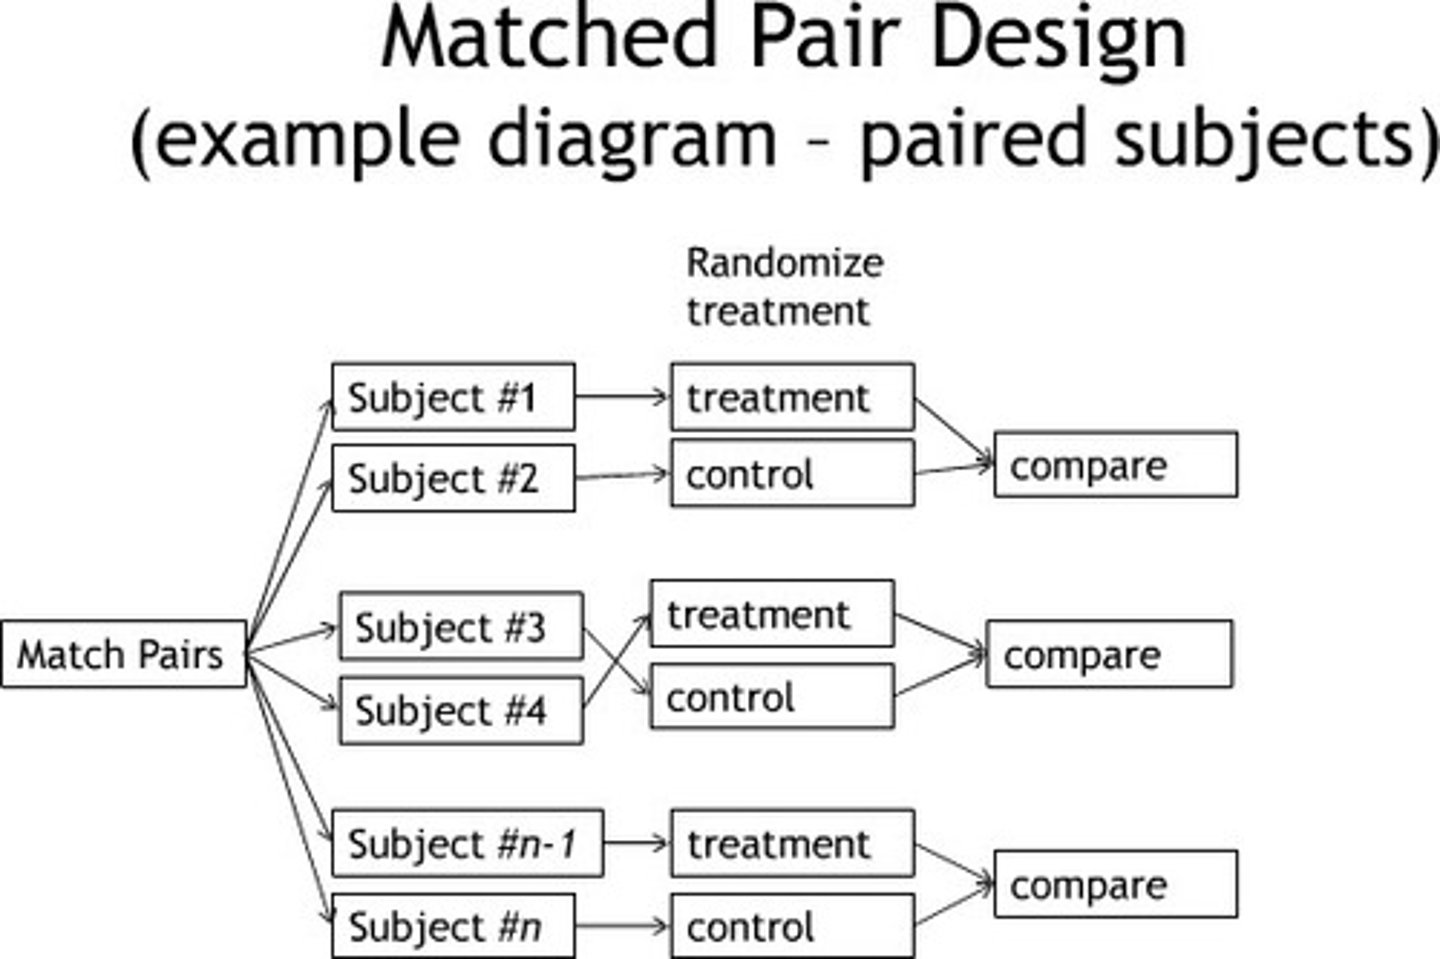
matched pairs
an observational technique that involves matching each participant in the experimental group with a specific participant in the control group in order to eliminate the possibility that a third variable (and not the independent variable) caused changes in the dependent variable
conditional prabability
probability given that something else has already occurred
sample space
Set of all possible outcomes of an experiment
confounded variable
A variable whose effect on the response variable cannot be separated from the effect of the explanatory variable on the response variable. (Note: Usually confounded variables are lurking variables but only a few lurking variables are also confounded.)
marginal frequency
A set of intervals, usually adjacent and of equal width, into which the range of a statistical distribution is divided, each associated with a frequency indicating the number of measurements in that interval.
coefficient of determination
The statistic or number determined by squaring the correlation coefficient. Represents the amount of variance accounted for by that correlation.
Statistic that represents amount of variance accounted for by a correlation.
binomial
A two-name naming system.
unimodal
having one mode; this is a useful term for describing the shape of a histogram when it's generally mound-shaped
a data set with one mode such
a normal distribution usually has only one mode
bimodal
A type of distribution, where there is two or more categories with an equal count or cases and with more cases than the other categories.
A distribution with two modes
experiment
A kind of research in which the researcher controls all the conditions and directly manipulates the conditions, including the independent variable.
Testing the hypothesis
law of large numbers
(statistics) law stating that a large number of items taken at random from a population will (on the average) have the population statistics
extrapolation
calculation of the value of a function outside the range of known values
IQR
A measure of variability, based on dividing a data set into quartiles
Difference between upper and lower quartile of a boxplot
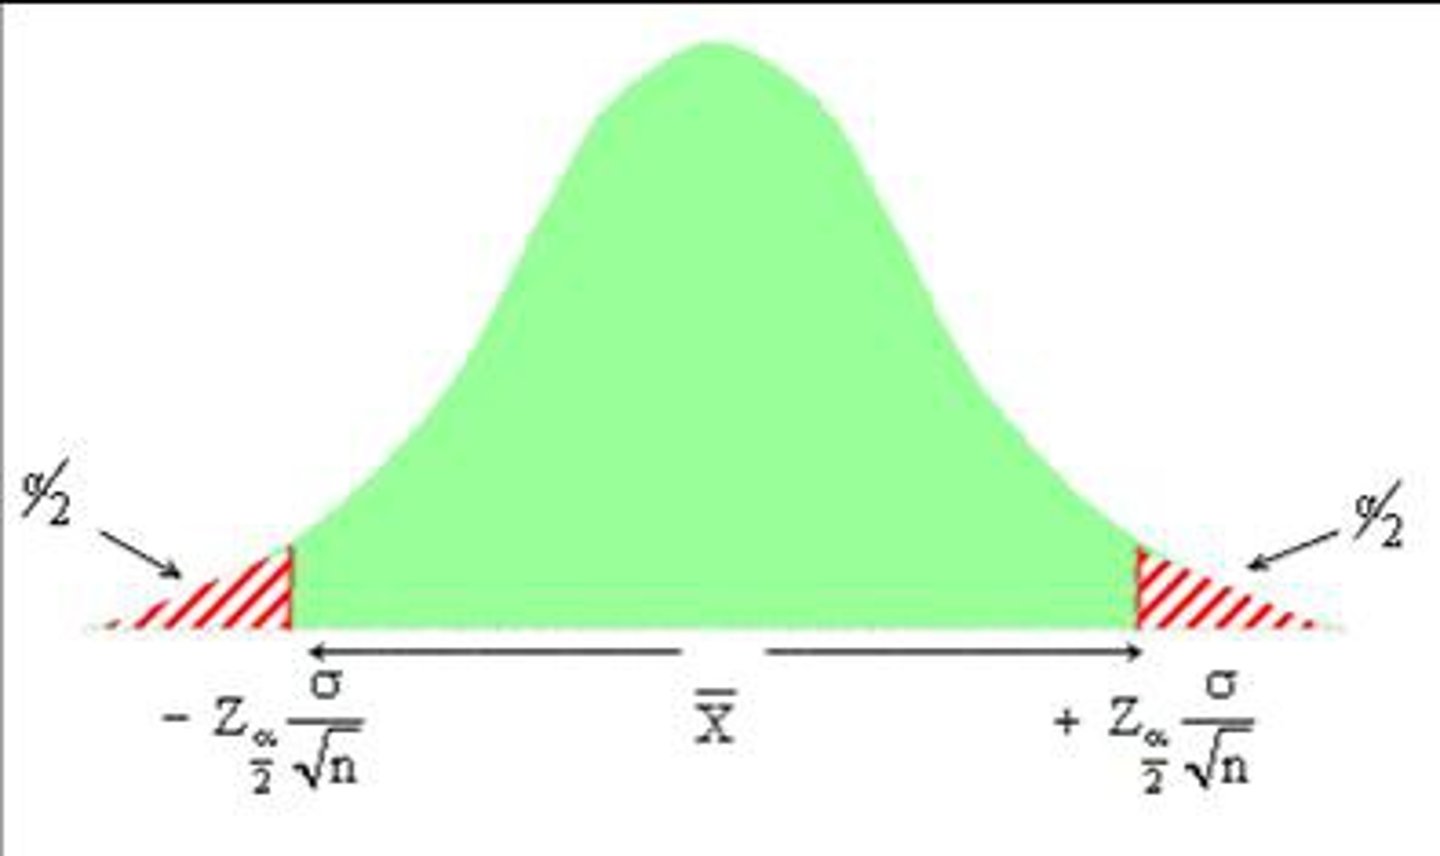
Confidence interval
A range of values for a variable of interest; the specified probability is called the confidence level and the end points of the confidence interval are called the confidence limits
A range of numbers in which most of the data values are likely to fall.
we are 95% confident that etc.
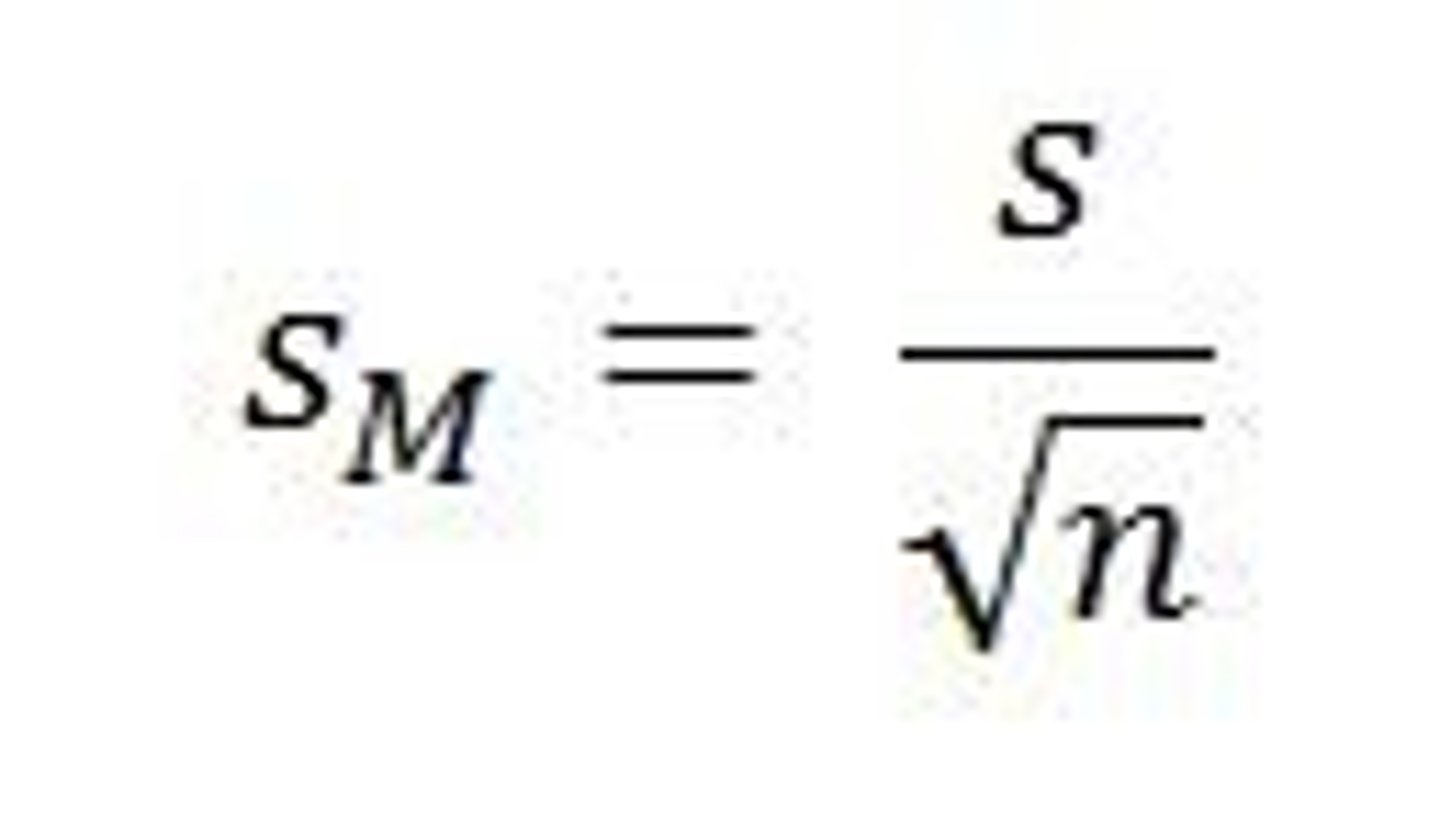
Standard Error
A statistic providing an estimate of the possible magnitude to error. The larger the standard error of measurement, the less reliable the score.
Standard deviation of sampling distribution
Residual
Convenience sample
Whenever a sample is taken it gives an improper results because the sample was taken from a very convenient area instead of representing a population
simulation
A representation of a situation or problem with a similar but simpler model or a more easily manipulated model in order to determine experimental results.
degrees of freedom
The number of individual scores that can vary without changing the sample mean. Statistically written as 'N-1' where N represents the number of subjects.
two way table
A table containing counts for two categorical variables. It has r rows and c columns.
describes to categorical variables with row variable and column variable
spread
The visible variation in a sample distribution
center
The measure of the distance the mode is from the center of a distribution
discrete random variable
a random variable that may assume either a finite number of values or an infinite sequence of values
central limit theorem
the sampling distribution of the mean approaches a normal curve as N gets larger
mutually exclusive
Events that cannot occur at the same time.
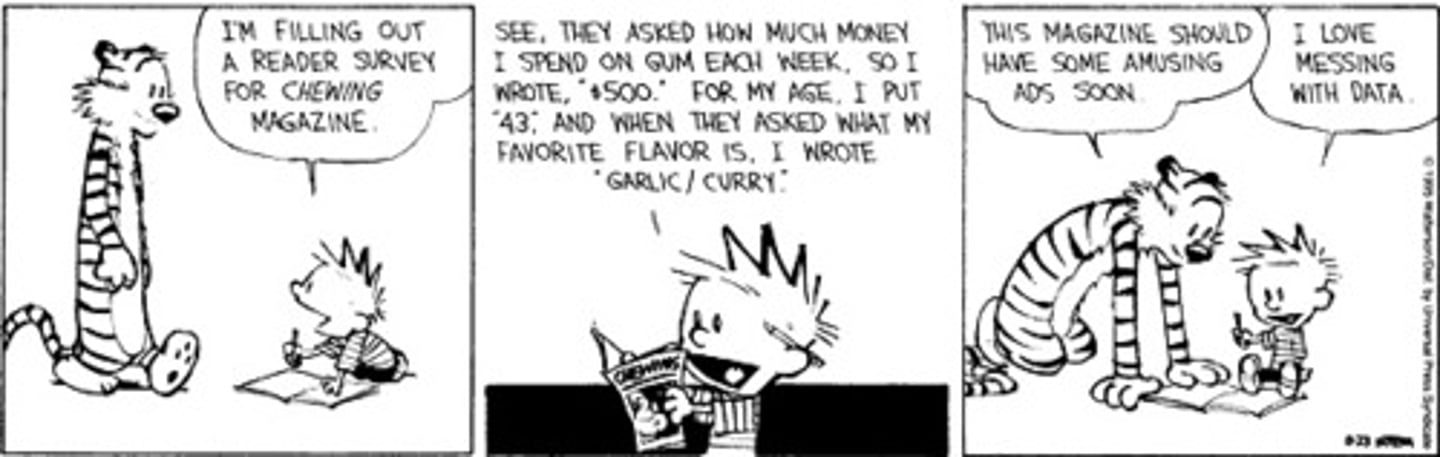
wording bias
Whenever a bias is created in a sample by the way the survey is worded to favor one question
causation
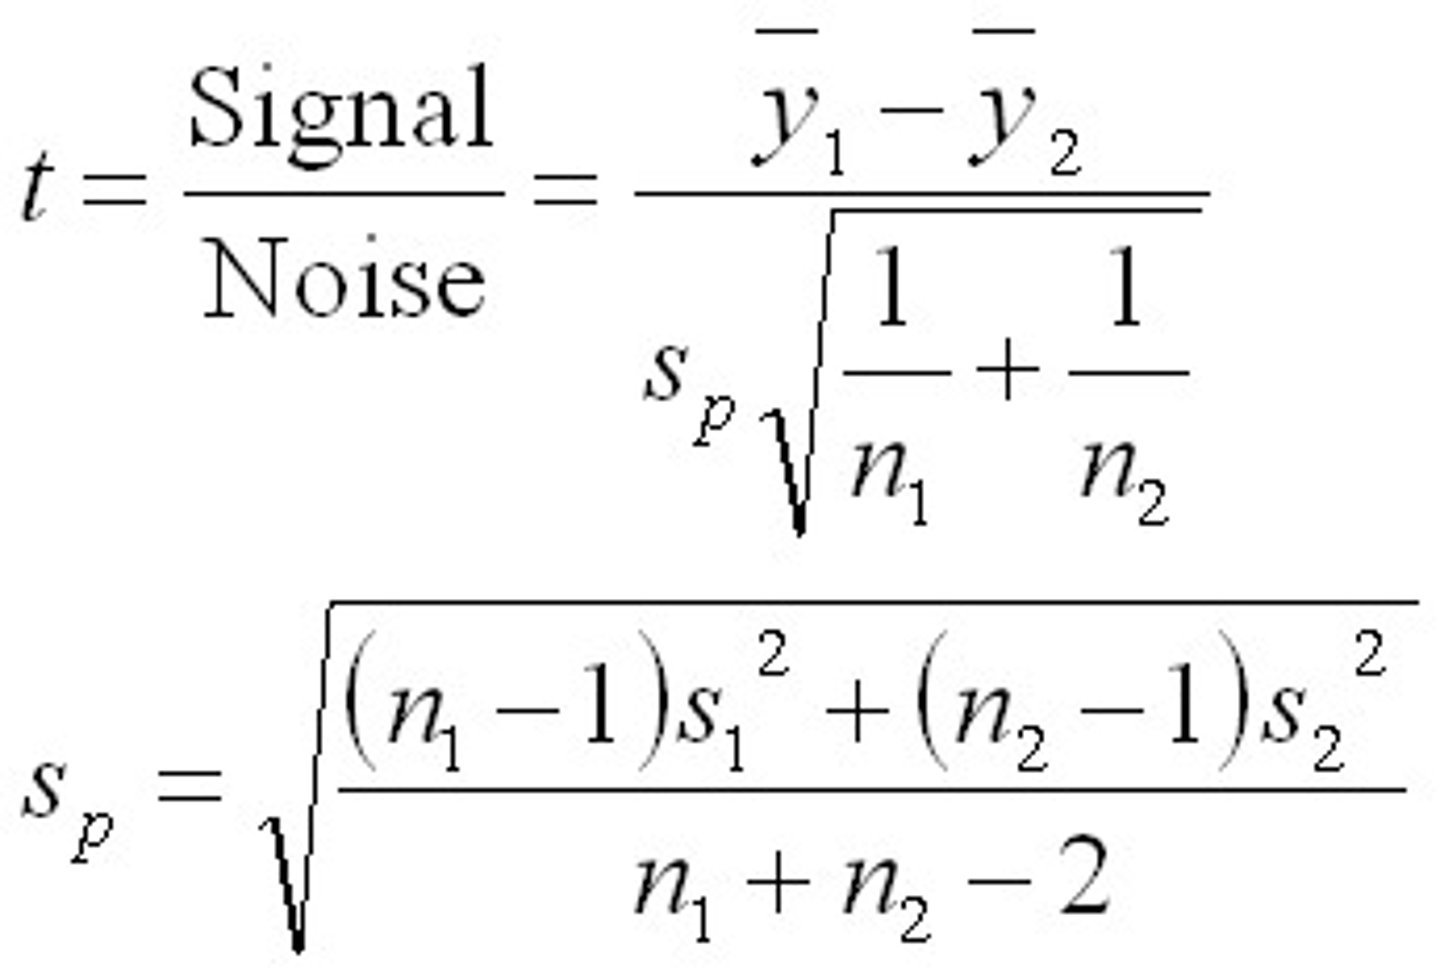
z test
t test
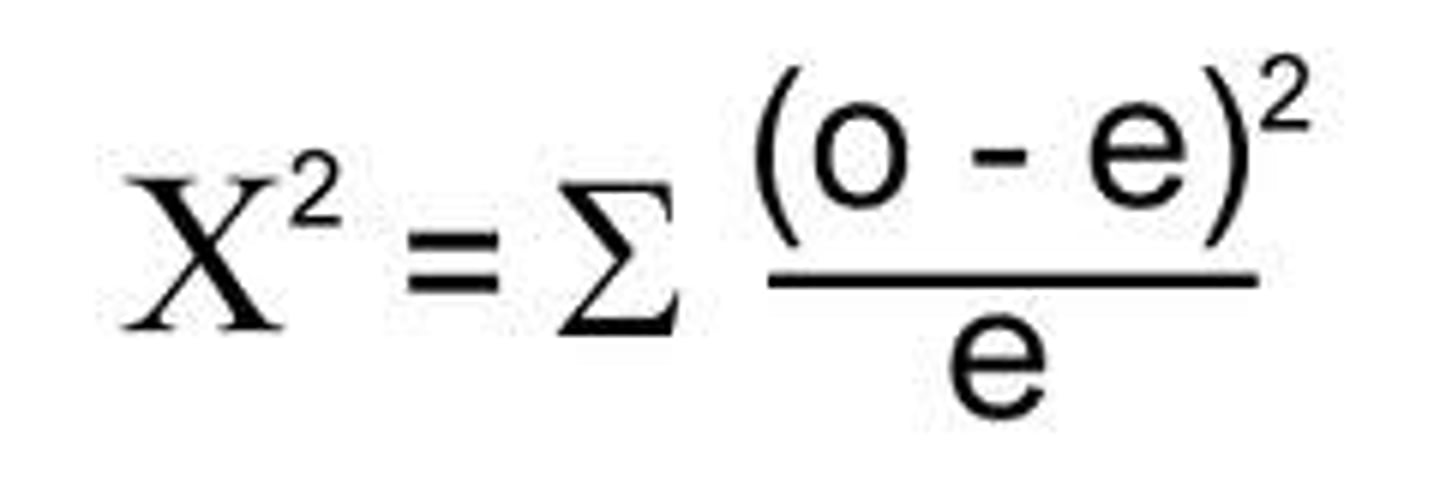
chi squared goodness of fit
tests how well close the observes data is to what would be expected under the model. If a sign diff is found b/w the two then ob. data has not been generated by chance. nominal data
Determine if scores from one variable match expectations for that distribution
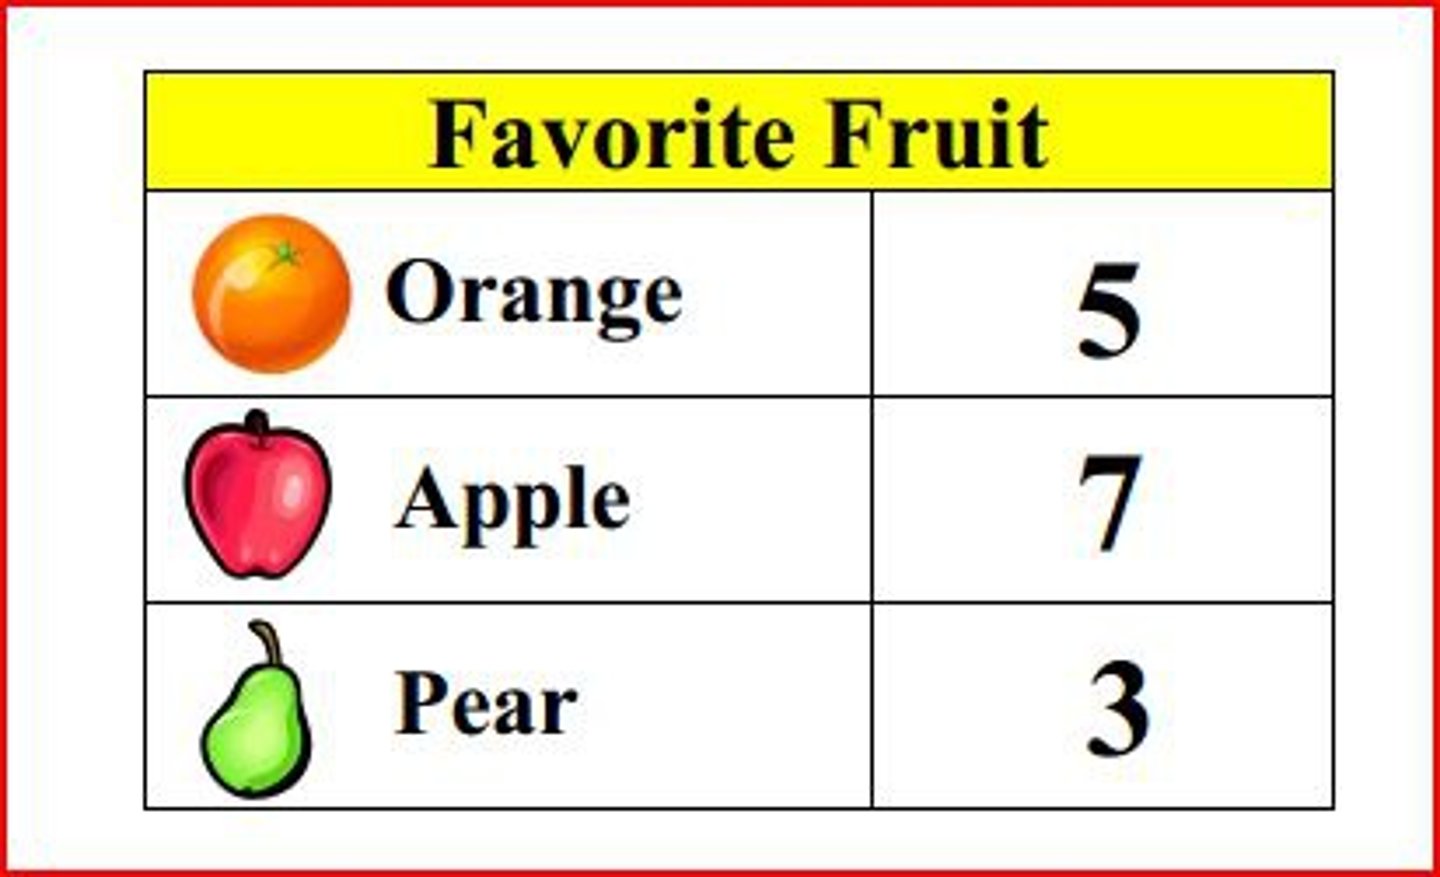
a gambler placed $1,000 into a game of greed in which he lost. He hopes to catch his opponent and bust him for loading the dice. He does this by choosing one dice to roll 36 times. He knows that the each side has an equal chance of landing face up. He hopes to get an outcome abnormal to this. Given the data below, can we prove that the dice are loaded
frequency table
A grouping of qualitative data into mutually exclusive classes showing the number of observations in each class.
A chart showing the number of times a specific event happens.
area principle
the area occupied by a part of the graph should correspond to the magnitude of the value it represents
contingency table
displays counts, and, sometimes, percentages of individuals falling into named categories on two or more variables. The table categorizes the individuals on all variables at once, to reveal possible patterns in one variable that may be contingent on the category of the other.
A two-variable table with cross-tabulated data.
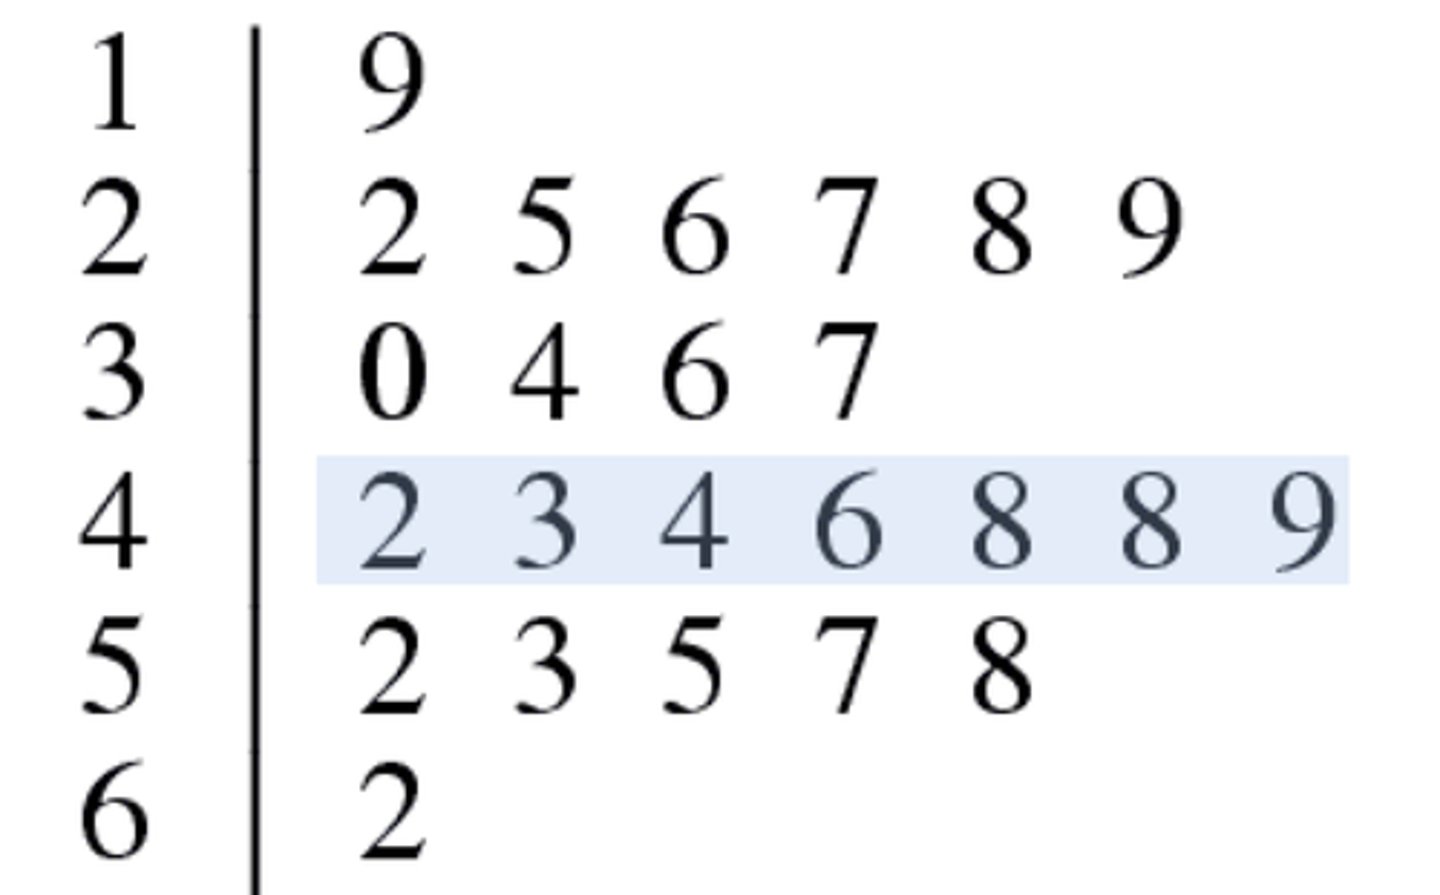
stem and leaf display
A multiple column table depicting the individual digits of the scores. A score of 95 would have a stem of 9 and a leaf of 5, a score of 62 would have a stem of 6 and a leaf of 2. If a particular stem has more than one leaf, such as the scores 54, 58, and 51, the stem of 5 has three leaves, in this case 458.
. It shows the range of values of the variable
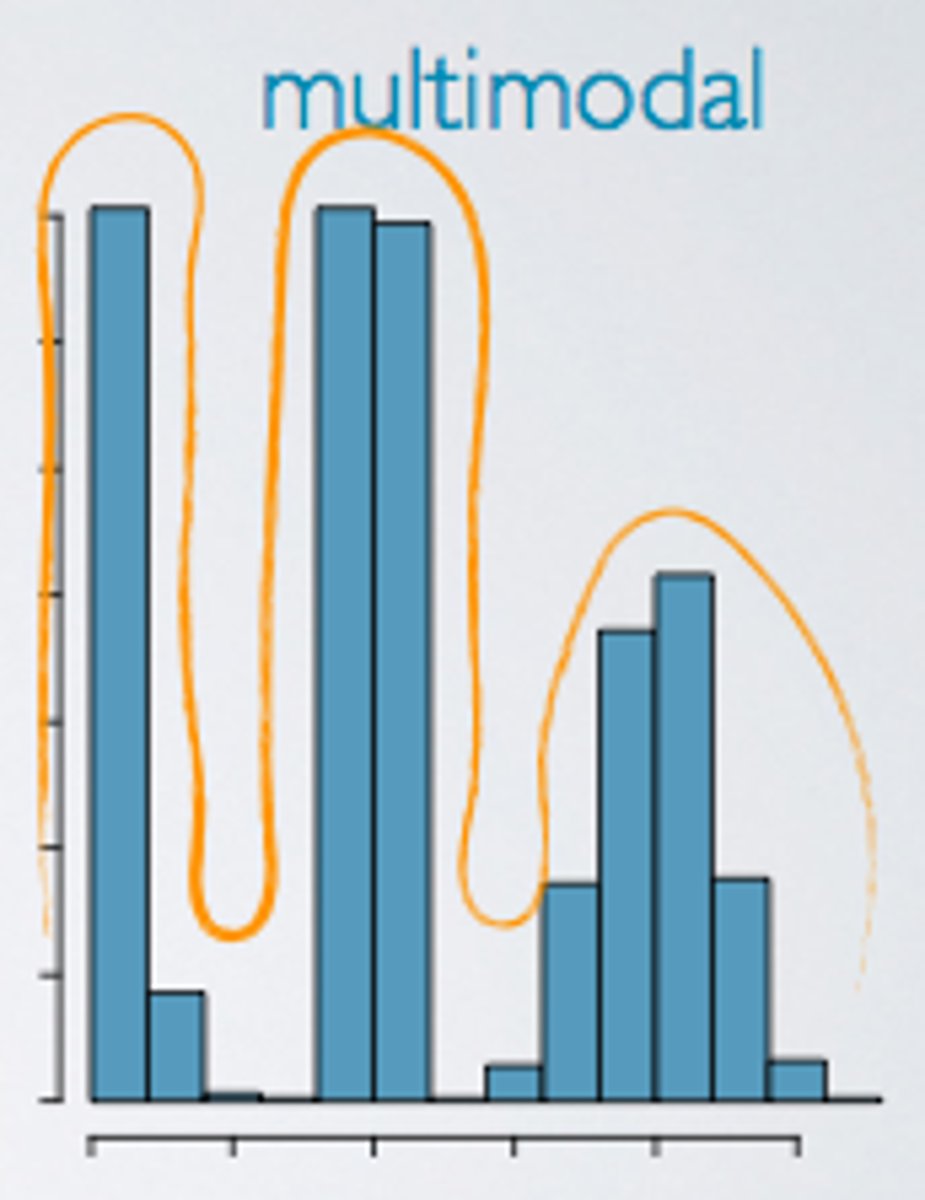
multimodal
Describes a graph of quantitative data with more than two clear peaks.
A distribution with more than two modes
uniform
A histogram doesn't appear to have any mode and in which all the bars are approximately the same height
Evenly spaced
symetric
When in a normal distribution both sides are identical
time plot
Displays data that change over time. Often, successive values are connected with lines to show trends more clearly. Sometimes a smooth curve is added to the plot to help show long-term patterns and trends.
Displays data that change over time.
se
standard deviation of residuals
r2
overall measure of how successful the regression is in linearlly relating to y and x
influential point
a point when omitted will give very different results
census
When a survey has no sample but instead test or surveys the entire population
pilot
small trial run of a survey to see if questions are clear